|
|
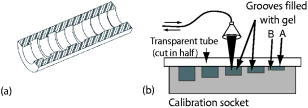
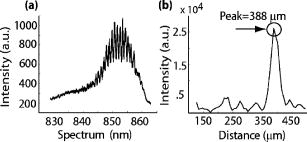
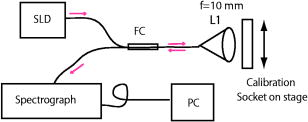
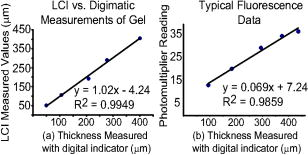
1.IntroductionPromising intravaginal microbicidal agents are now being developed as a potentially efficacious and widely applicable modality for prophylaxis against HIV and other sexually transmitted infections. However, proper deployment, i.e., spreading, contacting, and coating on target tissues, is essential for achieving the desired prophylactic effects. Recent approaches for determining the success of deployment have included gamma scintigraphy1 and magnetic resonance imaging (MRI).2, 3, 4 These methods are useful but provide limited spatial resolution, typically with a voxel size of . More recently, an intravaginal optical system based on gel fluorescence measurements,5 enabled by doping the gel with fluorescein, has been developed. This system greatly improves spatial resolution, and will be valuable in microbicide research and development. More recent studies with this fluorescence-based method suggest that microbicide formulation coating thicknesses as low as are sufficient to neutralize HIV before it reaches mucosal surfaces.6 However, further studies with this device showed that up to 25% of the gel coating was less than or equal to thick, uncovering a potential area of concern in achieving sufficient coating.7 These studies illustrate the need for monitoring gel thickness. While the new fluorescence-based method is a significant advance in methodology over previous approaches, it also has limitations. In particular, the use of an exogenous contrast agent limits the time after gel application during which accurate in vivo measurements can be performed. Effects such as diffusion of dye out of the formulation and photobleaching limit the interval over which measurements can be made accurately. However, extended time studies are highly relevant to understanding the natural progression of gel deployment in vivo. To address these concerns and characterize deployment, we propose to use low-coherence interferometry (LCI) as a novel, label-free, high-resolution method for measuring intravaginal distributions of anti-HIV microbicidal formulations applied to the lower female human reproductive tract. LCI uses broadband light in an interferometry scheme to achieve depth-resolved reflection measurements with micrometer resolution. The preliminary tests presented in this letter show that LCI is well suited to the proposed task with gel thickness measurements exhibiting precision and accuracy meeting or exceeding those of previous methods employed for this purpose. Further, because LCI can determine gel thickness without using an exogenous contrast agent, this new method will enable biologically relevant, longer time studies, avoiding the limitations of fluorescent tags, e.g., photobleaching and dye diffusion. Moreover, the LCI-based method will form the basis for a less-expensive and more robust diagnostic system, providing higher accuracy and easier application. In this letter, we present a common-path LCI configuration used to probe microbicidal gel thickness. We then present the results of experiments which demonstrate accurate LCI measurements of gel thickness in a clinically relevant system. The LCI results are compared to measurements executed with a fluorescence-based approach, which show that LCI performs on par without the need for exogenous contrast agents. Finally, a summary and discussion of future clinical applications are presented as a conclusion. 2.Materials and MethodsThe test sample, consisting of the cylindrical calibration polyacetal test socket and polycarbonate tube [Figs. 1a and 1b ] is relevant to the proposed application of this technique, as the same sample was also used to calibrate the system used for in vivo fluorescence measurements. Gel samples were prepared by placing small amounts of the gel within the calibration socket containing five wide grooves, each a different depth (50, 106, 192, 277, and ), with bottoms concentric to the tube surface [Fig. 1a]. A halved transparent tube was placed within the calibration socket, spreading the gel within the groove and providing a front surface for the gel to adhere to [Fig. 1b]. The tube was secured to the calibration socket to prevent lateral movement of the tube within the socket during measurement. In the experiments presented below, KY Jelly (Johnson & Johnson, Inc.) was used as a sample gel. This gel is based on hydroxyl ethyl cellulose, and has been characterized in vaginal imaging studies in women. The calibration socket was translated laterally relative to the beam exiting the fiber, positioning the beam at each groove for data collection. For the experiments with the clinical fluorescence-based system, the gel was deployed within a similar cylindrical test socket, which is routinely used for calibration prior to clinical application. This second socket also has a series of wide grooves, each of a different depth (94, 183, 294, 373, and ). These grooves are filled with gel rendered fluorescent by the addition of 0.1% USP grade injectable fluorescein powder to allow thickness measurement using the fluorescence-based system. Fig. 1(a) Sketch of calibration socket.5 (b) Simplified drawing showing cross section of calibration socket with transparent tube in place. A and B represent the interfaces responsible for the interference displayed in the spectrum. Groove depths are greatly exaggerated in both (a) and (b).  ln the LCI system (Fig. 2 ), light from a pigtailed superluminescent diode (SLD, output power , , Superlum Diodes Ltd., Russia) is directed to a single-mode 50/50 fiber coupler (AC Photonics, Inc.). The broad bandwidth of the SLD results in a low coherence length , which enables high resolution in the axial thickness measurements. The fiber coupler permits light to be directed toward the sample following one optical path while light returning from the sample is directed along another optical path for detection. The output of the fiber coupler is focused onto the sample using an aspheric lens ( , Thorlabs, Inc.). The sample is located such that the light is focused onto the sample interface of interest [Fig. 1b]. Light returning from the sample is collected by the same lens such that it is focused into the same optical fiber used for delivery. The fiber coupler directs the combined sample and reference fields to a spectrograph for detection. The output of the fiber coupler is coincident with the input slit of a high-resolution spectrograph (HR2000, Ocean Optics, Inc., Dunedin, FL), which achieves a spectral resolution of over a range of centered at . The combined fields are dispersed by the spectrograph, detected with an integrated linear CCD, and downloaded in real time to a PC via the USB interface. For each measurement, LabVIEW software (National Inst., Austin, TX) is used to display and record the spectral interference. To then analyze each spectrum, the data is uploaded into Matlab (The Mathworks Inc.) and processed using the following steps: (1) the individual wavelengths of the spectrum are converted into wavenumber ; (2) a spline interpolation is performed to resample the wavenumber spectra with even spacing; (3) the 1-D Fourier transform (FT) is computed to yield the spatial cross-correlation between the signal and reference fields; and (4) the location of the resulting peak in the FT is identified, which corresponds to the thickness of the sample in each groove. This LCI scheme uses a common path configuration, where the signal and reference fields travel the same optical path until reaching the sample. The reflection from interface A [Fig. 1b] comprises the reference field while the light that is reflected from interface B comprises the signal field. This arrangement offers several benefits, including simplification of system alignment and reduction of noise due to elimination of differential path length changes in the interferometer. The performance of the LCI system was compared to that of a fluorescence-based system currently in use for measuring microbicidal gel thickness in vivo. The fluorescence-based system was developed for executing clinical measurements of microbicidal gel thicknesses in the vagina.5 The system employs a rigid, clinical endoscope (4-mm diameter, 70-deg lens tip angle; Karl Storz, Culver City, CA) contained within a 27-mm diameter, polished transparent polycarbonate tube ( long) with a hemispherical cap, similar to the tube used in the LCI system. The device tube is inserted into the vagina to the fornix, and then remains stationary during measurement. The endoscope can be moved relative to the tube using a custom gearing mechanism. A medical endoscope Xenon arc lamp light source (Richard Wolf, Inc., Vernon Hills, IL) provides illumination. The output light is split between an integrating video camera and an optical subsystem for measuring fluorescence comprising a filter and a photomultiplier tube (PMT). The thickness of the fluorescent gel is determined by comparing the PMT output to a linear calibration curve, generated using a test socket. 3.ResultsThe LCI system was used to assess the thickness of gel samples deployed within the calibration socket. The output of the spectrograph yielded an interferometric signal as a function of wavelength. The typical data, shown in Fig. 3a , exhibit prominent oscillations, which are characteristic of the sample thickness. The spectral data were Fourier transformed to yield a spatial correlation function, which represents the depth resolved reflection profile of the sample [Fig. 3b]. The thickness of the gel sample was determined from the sharp peak in the correlation function. Fig. 3(a) Spectral data from the 388- groove. (b) Correlation function obtained by FT of spectral data. The sharp peak at corresponds to a 277- optical thickness of the gel sample.  In the typical data shown in Fig. 3b, the optical path length through the gel was measured to be , with the uncertainty given by the half width half maximum (HWHM) of this peak. The HWHM is slightly degraded from the coherence length of the SLD source due to uncompensated dispersion from the polycarbonate tube. This can be corrected by digital dispersion compensation if it becomes problematic. The optical path length (OPL) is related to the physical thickness by , where is the refractive index of the gel. The refractive index of the gel was measured previously by observing the refraction of a beam from the near-IR SLD source upon passing through a volume of gel. Using analysis based on the principle of Snell’s law, it was measured to be 1.34. The refractive index of the gel was also measured with an Abbe refractometer with a visible light source and found to be 1.35, demonstrating the wavelength dependent property characteristic of refractive indices. Thus, the thickness of this gel sample is . This is in good agreement with Digimatic indicator (Mitutoyo Products) measurements of this groove depth within the calibration socket [Fig. 2a], which was . The Digimatic indicator notes differential differences between surfaces and was used to obtain groove depth measurements for comparison with the LCI method. LCI measurements were executed on the five grooves within the calibration socket. The results are shown in Fig. 4a , which demonstrates the linearity of the measurements. Excellent agreement was obtained between the LCI-based measurements and the groove depths as measured with the Digimatic indicator to within the precision of the measurements. To assess the relative performance of the LCI method, LCI measurements were compared to fluorescence measurements of gel thickness executed with the clinical system described above, applied to gel deployed within a test socket. The fluorescence measurements were also found to scale linearly with gel thickness [Fig. 4b]. An R-squared value greater than 0.98 was calculated for the clinical system and an R-squared value greater than 0.99 was calculated for the LCI system. The accuracy and linearity of these measurements are discussed and compared below. 4.DiscussionGel thickness measurements were executed on test samples using two sensing modalities: LCI and the clinical fluorescence system. The responses were both found to be linear with respect to thickness. Note that the LCI system demonstrated comparable results to the clinical fluorescence-based system in a clinically relevant test sample but was able to execute the measurements without the need for an exogenous contrast agent. We expect that this characteristic of the LCI system will offer significant advantages as it is developed for clinical applications. This method will enable the time interval of clinical studies to be greatly increased by avoiding both diffusion losses of the fluorophore to the surrounding tissue and the photobleaching effect, which limits the length of time and repetition that the fluorescence-based method can be used to track gel thickness. Further research will focus on developing an endoscopic device that enables measurement within a whole tube, and permits radial and longitudinal scanning to encompass the entire surface area within the tube. This advance will permit the LCI-based technique to be incorporated easily into current in vivo measurement studies. AcknowledgmentsThis work has been supported by grants from the National Science Foundation (BES–0348204) and the National Institute of Health (AI48103). We acknowledge experimental help from Jenny Peters. ReferencesJ. Brown,
“Spreading and retention of vaginal formulations in post-menopausal women as assessed by gamma scintigraphy,”
Pharm. Res., 14
(8), 1073
–1078
(1997). https://doi.org/10.1023/A:1012113714552 0724-8741 Google Scholar
K. T. Barnhart,
E. S. Pretorius,
A. Stolpen, and
D. Malamud,
“Distribution of topical medication in the human vagina as imaged by magnetic resonance imaging,”
Fertil. Steril., 76
(1), 189
–195
(2001). https://doi.org/10.1016/S0015-0282(01)01822-2 0015-0282 Google Scholar
K. T. Barnhart,
A. Stolpen,
E. S. Pretorius, and
D. Malamud,
“Distribution of a spermicide containing Nonoxynol-9 in the vaginal canal and the upper female reproductive tract,”
Hum. Reprod., 16
(6), 1151
–1154
(2001). https://doi.org/10.1093/humrep/16.6.1151 0268-1161 Google Scholar
E. S. Pretorius,
K. Timbers,
D. Malamud, and
K. Barnhart,
“Magnetic resonance imaging to determine the distribution of a vaginal gel: before, during, and after both simulated and real intercourse,”
Contraception, 66
(6), 443
–451
(2002). 0010-7824 Google Scholar
M. H. Henderson,
J. J. Peters,
D. K. Walmer,
G. M. Couchman, and
D. F. Katz,
“Optical instrument for measurement of vaginal coating thickness by drug delivery formulations,”
Rev. Sci. Instrum., 76
(3), 034302
(2005). 0034-6748 Google Scholar
A. R. Geonnotti,
J. J. Peters, and
D. F. Katz,
“Erosion of microbicide formulation coating layers: Effects of contact and shearing with vaginal fluid or semen,”
J. Pharm. Sci., 94 1705
–1712
(2005). 0022-3549 Google Scholar
D. F. Katz,
“Optical imaging and analysis of human vaginal coating by drug delivery formulations,”
Google Scholar
|


