
|
|
1.IntroductionAcute myocardial infarction (AMI) is a leading cause of death in the United States and industrialized countries.1, 2 Research conducted over the past 15 years has demonstrated that several types of minimally or modestly stenotic atherosclerotic plaques, termed vulnerable plaques, are precursors to coronary thrombosis, myocardial ischemia, and sudden cardiac death. Postmortem studies have identified one type of vulnerable plaque, the thin-cap fibroatheroma (TCFA), as the culprit lesion in approximately 80% of sudden cardiac deaths. 3, 4, 5, 6, 7 Over 90% of TCFAs are found within the most proximal segment of each of the main coronary arteries [left anterior descending (LAD); left circumflex (LCx); and right coronary artery (RCA)].3, 5 The TCFA is typically a minimally occlusive plaque characterized histologically by the following features: (1) thin fibrous cap , (2) large lipid pool, and (3) activated macrophages near or within the fibrous cap. 3, 5, 7, 8, 9 It is hypothesized that these features predispose TCFAs to rupture in response to biomechanical stresses.10, 11 Following rupture and the release of procoagulant proteins, such as tissue factor, a substrate for thrombus formation is created, leading to an acute coronary event.12, 13 While TCFAs are associated with the majority of AMIs, recent autopsy studies have shown that coronary plaques with erosions or superficial calcified nodules may also precipitate thrombosis and sudden occlusion of a coronary artery. 3, 5, 14, 15 Although autopsy studies have been valuable in determining features of culprit plaques, the retrospective nature of these studies limits their ability to quantify the risk of an individual plaque for causing acute coronary thrombosis. For instance, TCFAs are a frequent autopsy finding in asymptomatic or stable patients and are found with equal frequency in culprit and nonculprit arteries in acute coronary syndromes.16 Moreover, disrupted TCFAs have been found in 10% of noncardiac deaths.16 Recent findings of multiple ruptured plaques17 and increased systemic inflammation in acute patients18, 19, 20 has challenged the notion of a single vulnerable plaque as the precursor for AMI.19, 21, 22 An improved understanding of the natural history and clinical significance of these lesions would accelerate progress in diagnosis, treatment, and prevention of coronary artery disease (CAD). An attractive approach to studying the evolution of vulnerable plaques is noninvasive or intracoronary imaging of individual lesions at multiple time points. Unfortunately, the microscopic features that characterize vulnerable plaque are not reliably identified by conventional imaging technologies such as intravascular ultrasound (IVUS), 23, 24, 25, 26, 27, 28 CT, 29, 30, 31, 32 and MRI. 32, 33, 34, 35 While experimental intracoronary imaging modalities such as integrated backscatter IVUS,36, 37 elastography,32, 38 angioscopy, 39, 40, 41, 42, 43 near-infrared spectroscopy,44 fluorescence spectroscopy,45, 46, 47 Raman spectroscopy,48, 49 and thermography50, 51 have been investigated for the detection of vulnerable plaque, no method to date has been shown to reliably identify all of the characteristic features of these lesions. 2.Optical Coherence TomographyIntracoronary optical coherence tomography (OCT) is an invasive microscopic imaging technology that has been developed for the identification of vulnerable plaque. 52, 53, 54, 55 OCT acquires cross-sectional images of tissue reflectance and, since it may be implemented through an optical fiber probe, it is readily adaptable to coronary catheters56 for insertion into coronary arteries and circumferential imaging of arterial pathology. The first investigation of vascular optical coherence tomography ex vivo demonstrated the potential of this technique to identify arterial microstructure.57 Subsequent development of OCT technology enabled image acquisition at rates sufficient for intracoronary imaging in human patients.58, 59, 60 In this manuscript, we review studies conducted with this technology over the past five years at the Massachusetts General Hospital (MGH). Results from these studies show that a wide variety of microscopic features, including those associated with TCFAs, can be identified by OCT imaging both ex vivo and in living human patients. These findings suggest that this technology will play an important role in improving our understanding of coronary artery disease, guiding local therapy, and decreasing the mortality of AMI. 3.Optical Coherence Tomography SystemA schematic of the OCT system is shown in Fig. 1 .59 Briefly, the system consists of a polarization-diverse fiber-optic nonreciprocal interferometer, which operates in the time domain. The light source is centered at and has a Gaussian spectral full-width-at-half-maximum of , providing an axial resolution of approximately in tissue. The transverse resolution, determined by the focal spot size produced by the probe, is . Group delay scanning at a rate of was conducted by utilizing a phase-control rapidly scanning optical delay (RSOD) in the reference arm.61 Images (500 pixels transverse 250 pixels axial) were obtained at and stored digitally. A custom-built fiber-optic rotary junction was utilized for catheter-based circumferential imaging and a galvanometer mirror was used for the free-space experiments.62 Catheters were constructed by modifying a commercially available ( diameter), rapid-exchange IVUS catheter to incorporate a central fiber, a distal gradient index (GRIN) lens, and a deflecting prism, which were rotated to construct a circumferential image.62 Fig. 1Schematic of the time-domain intracoronary optical coherence tomography system. Polarized, broad-bandwidth light passes through a circulator (CIRC, port C1 to port C2) and is split into reference and sample arms via a 10/90 fiber optic beam splitter. The optical path length (group delay) of the reference arm is scanned by translating the galvanometer of the rapidly scanning optical delay (RSOD) line. Sample arm light is coupled into the catheter by a rotating optical junction (ROTJ). Light returned from the reference and sample arms is combined at the splitter and transmitted back to the circulator at port C2. The circulator then passes this light through port C3 to a polarizing beam splitter (PBS). The two orthogonal polarization states are detected separately by photodiodes D1 and D2. The two signals are demodulated and summed to create the final output signal, which is digitized (A/D) and transferred to the CPU. Detection of the fringe patterns created by sample and reference arm interference allows one radial scan (A-line) to be constructed that maps tissue reflectivity axial or depth location. A cross-sectional image is generated by repeating this process at successive transverse locations on the sample while the ROTJ rotates the internal components of the catheter. 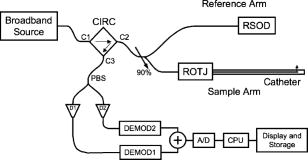 4.Ex Vivo Studies4.1.Plaque CharacterizationThe first steps in validating this imaging modality were to establish and test the accuracy of objective image criteria for discrimination of atherosclerotic plaque types ex vivo. A total of 357 specimens (162 aortas, 105 carotid bulbs, and 90 coronary arteries) were obtained from 90 cadavers (48 male, 42 female, mean age ). The specimens were imaged fresh at , less than postmortem. Registration was accomplished by placing ink marks on the tissue prior to imaging so that both OCT images and histopathology slides contained visibly recognizable reference points. Following imaging, specimens were fixed in Formalin and processed for paraffin embedding, sectioning, and staining (H&E, Trichrome, Movat’s Pentachrome, and immunohistochemistry). For the training set, 50 cadaver plaques were imaged by OCT and correlated with histology obtained at the imaging site.55 Fibrous plaques were characterized by homogeneous, signal-rich regions, fibrocalcific plaques by signal-poor regions with sharp borders, and lipid-rich plaques by signal-poor regions with diffuse borders (Fig. 2 ). Two blinded readers prospectively applied these criteria to images of the remaining 307 plaques (validation set). Using histopathologic diagnosis as the gold standard, the accuracy of OCT for characterizing plaque type was then determined. These criteria yielded a sensitivity and specificity ranging from 71–79% and 97–98%, for fibrous plaques, 95–96% and 97% for fibrocalcific plaques, and 90–94% and 90–92% for lipid-rich plaques, respectively (overall agreement, ).55 These results demonstrated that objective OCT criteria are highly sensitive and specific for differentiating lipid-rich plaques from other plaque types.55 Fig. 2OCT images and corresponding histology for fibrous (A, B), calcific (C, D), and lipid-rich (E, F) plaque types (obtained ex vivo). In fibrous plaques, the OCT signal (Fib) is observed to be strong and homogeneous. In comparison, both calcific (arrows) and lipid-rich regions appear as signal poor regions within the vessel wall. Lipid-rich plaques have diffuse or poorly demarcated borders while the borders of calcific nodules are sharply delineated. (B, D) Hematoxylin & Eosin; (F) Masson’s trichome; original magnification . Scale bars, tick marks, .  4.2.Quantification of Macrophage ContentMacrophages are central to the etiology of coronary artery disease. 12, 63, 64, 65 Due to the high quantity of intracellular phagolysosomes containing lipid and other cellular debris, we hypothesized that the refractive index contrast provided by the cytoplasm of macrophages would result in a strong optical signal from these cells (Fig. 3 ). Furthermore, since macrophages are typically heterogeneously distributed in atherosclerotic tissue, the spatial variance of OCT signal in plaques with high macrophage content should also be elevated. In order to test this hypothesis, cap macrophage and smooth muscle densities of 27 necrotic core fibroatheromas were quantified by analyzing indirect horseradish immunoperoxidase staining of paraffin embedded tissue sections incubated with CD68 and smooth muscle actin monoclonal antibodies, respectively.66 Hematoxylin was the counter-stain. Morphometric measurements (single cross-sectional field) of cell density (% area stained) within a (lateral) (axial) region of interest were then compared to the normalized standard deviation (NSD) of the OCT signal intensity at corresponding locations.66 We found a high degree of positive correlation between OCT and histologic measurements of fibrous cap macrophage density ( , ) and a negative correlation between OCT and histologic measurements of smooth muscle actin density ( , ). A range of NSD thresholds yielded greater than 90% sensitivity and specificity for identifying caps containing CD68 staining. This study demonstrated that the high contrast and resolution of OCT enables the quantification of macrophages within fibrous caps of atherosclerotic plaques. Fig. 3Images of atherosclerotic plaques (obtained ex vivo) (A) OCT image of a fibroatheroma with a low density of macrophages within the fibrous cap (arrow). (C) OCT image of a fibroatheroma with a high density of macrophages within the fibrous cap (arrow). (B, D) Histology corresponding to (A) and (C), respectively; Masson’s trichome; original magnification . Scale bars (both OCT and histology), . 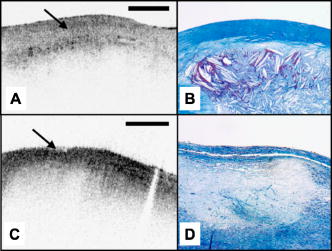 4.3.Other Plaque FeaturesWhile the previously described studies demonstrated accurate characterization of features associated with TCFAs, OCT is capable of identifying additional plaque components that may be associated with acute coronary events. These features are described below. 4.3.1.Calcific NodulesCalcific nodules have been associated with plaque thrombosis in a minority of cases.3, 5 Calcium by OCT appears as a signal-poor region with a sharp delineation between the nodule and the surrounding tissue [Fig. 2C]. In our histopathologic study of plaque characterization, we were able to use this criterion to diagnose calcific nodules with 96% sensitivity and 97% specificity.55 4.3.2.ThrombusDifferentiation of thrombus from plaque is critical for accurate plaque characterization. In addition, there is evidence to suggest that thrombus type, platelet-rich versus red-blood-cell-rich, is an indicator of the flow conditions associated with the thrombus formation and could be an important predictor of the efficacy of thrombolytic therapy.67, 68 We have conducted a study to correlate histopathologic sections of thrombus with OCT. Our preliminary results suggest that a “red” thrombus (red-blood-cell-rich) rapidly attenuates the signal in a manner similar to whole blood [Fig. 4A ]. In contrast, a “white” thrombus (platelet-rich) appears to exhibit a homogeneous moderate-strong signal with significantly less attenuation [Fig. 4B].60 In our experience, both forms of thrombus are usually easily distinguished from the arterial wall proper. Fig. 4OCT images of red blood cell-rich (A) and platelet-rich (B) thrombi (obtained ex vivo). The red blood cell-rich thrombus demonstrates high OCT signal attenuation, whereas the platelet rich thrombus shows a homogeneous scattering signal with relatively little attenuation. Insets depict corresponding histology sections from each thrombus; Hematoxylin & Eosin; original magnification . Scale bar, . 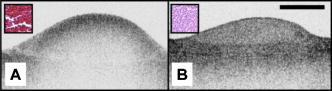 4.3.3.Macrophages at the Cap-Lipid Pool BorderHigh-resolution cross-sectional optical imaging affords the unique opportunity to study the location of macrophage accumulations within a given plaque cross-section. Using our macrophage data set,66 we found that 84% of OCT images demonstrated a high signal at the junction between the cap and the lipid pool [Fig. 5A, 5B ] when CD68 staining at this interface was greater than 50%. Fig. 5Images of atherosclerotic plaques (obtained ex vivo) (A) OCT image of a fibroatheroma with macrophages present at the cap lipid-pool interface. (C) OCT image demonstrating giant cells (arrow). (E) Cholesterol crystals (arrows) appear as signal-rich linear structures. (B, D, and F) Histology corresponding to (A), (C), and (E); (B) CD68; (D, F) Masson’s trichrome; original magnification . Scale bars (both OCT and histology), . 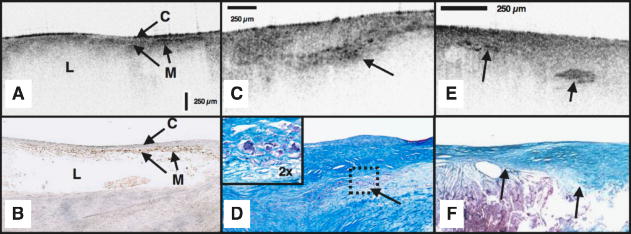 4.3.4.Giant CellsMultinucleated macrophages, or giant cells, are an inflammatory response to a foreign body (e.g., cholesterol crystals) within atherosclerotic plaques. Giant cells can be visualized by OCT as large highly reflecting regions within the cap and at the cap-lipid pool interface [Fig. 5C, 5D]. 4.3.5.Cholesterol CrystalsResearch investigating the biomechanical properties of atherosclerotic plaques has shown that the presence of cholesterol crystals increases the stiffness of lipid pools, and as a result, may decrease the likelihood of plaque rupture.69 Images of cholesterol crystals demonstrate oriented, linear, highly reflecting structures within the plaques [Fig. 5E, 5F].70 5.Clinical StudiesHistopathologic validation of qualitative and quantitative image criteria ex vivo provided a foundation for interpreting data obtained from living human patients. Between January 2000 and September 2003, a total of 86 patients undergoing routine percutaneous transluminal coronary intervention (PTCI) were enrolled in a study at the Massachusetts General Hospital (Boston, MA) to investigate the feasibility of intracoronary OCT. Informed consent was obtained for all patients. Imaging was performed in culprit lesions and remote sites with IVUS and OCT pre- and post-coronary intervention.60, 71 Clear visualization of the arterial wall was accomplished by use of intermittent saline flushes through the guide catheter. All patients tolerated the procedure well without complications. Images demonstrating detailed arterial microstructure were successfully obtained in all patients studied and in all three major coronary arteries.60, 71 To compare IVUS and OCT, images were registered by angiographic visualization of the catheter tip, anatomical landmarks, and guide catheter tip location. Summaries of the results from our clinical study are described below: OCT images obtained in living patients contained the same image features as those obtained ex vivo. All of the characteristics of macrophage-rich TCFAs as well as the additional plaque features described in the previous section were observed in vivo; there were no image features in the clinical data that had not been observed ex vivo (Fig. 6 ).60 These observations suggest that image interpretation criteria and algorithms validated ex vivo can also be applied to images obtained from patients. Fig. 6OCT images of coronary plaques acquired from living human patients (obtained in vivo). (A) Fibrous plaque (Fib); (B) calcific nodule (Ca); (C) TCFA with circumferential lipid pool and a region consistent with a platelet-rich thrombus (arrowheads). The * represents guidewire artifacts. Tick marks, .  OCT observations were consistent with IVUS, the current gold standard for intracoronary imaging. 60 Although IVUS is unable to resolve microstructural features associated with vulnerable plaque, it can identify nonatherosclerotic (normal) vessels, large thrombi, calcific deposits, and pronounced arterial disruptions. While unconfirmed, indirect evidence suggests that IVUS may detect large lipid deposits.24 A study was conducted, comparing 17 OCT-IVUS image pairs obtained from 10 patients.60 In all cases where IVUS identified these characteristics, blinded OCT observations were consistent (Table 1 ). OCT detected additional cases of intimal hyperplasia, thrombus, intimal disruption, and lipid pool not identified by IVUS.60 Table 1IVUS and OCT findings for corresponding image pairs (n=17) . All features of the vessel wall structure identified by the IVUS reader were seen in the corresponding OCT image (column A). Additional findings by OCT that were not identified by the IVUS reader are enumerated in column B. (Taken from Ref. 60.)
Imaging of culprit lesions demonstrated a higher prevalence of TCFA in patients with acute coronary disease than patients with stable coronary disease. 72 In this analysis, TCFA was defined as a plaque with lipid area quadrants and cap thickness . A summary of the OCT findings, obtained from 57 patients with varying clinical presentations of coronary artery disease, is depicted in Table 2 .72 From these 57 patients, 20 presented with AMI, 20 with an acute coronary syndrome (ACS), and 17 with stable angina pectoris (SAP).73 TCFAs identified by OCT were found in 13 AMI patients (65%), 9 with ACS (45%), and 3 with SAP (18%).72 TCFAs were more prevalent in acute presentations (AMI and ACS) of CAD (55% versus 18%, ).72 Plaque disruption was found more frequently in acute CAD (20% versus 12%, ) and calcifications were more frequent in stable disease (41% versus 12%, ).72 These findings represent the first observation of presentation-dependent plaque morphology in living human patients and confirm our current knowledge of the relationship between morphology and patient outcome that has been obtained in previous autopsy studies. 3, 4, 5, 6, 7 Table 2OCT findings from MGH clinical study (n=57) . TCFA indicates thin-cap fibroatheroma (lipid ⩾2quadrants+fibrouscapthickness⩽65μm ). (Taken from Ref. 72.)
Macrophage content was significantly higher in fibroatheroma caps in patients with acute presentations of CAD, versus caps in patients with SAP. 74, 75 For this study, we created NSD (macrophage density) images (Fig. 7 ) and analyzed the macrophage distributions in both culprit and remote plaques of 49 patients with different clinical syndromes. Macrophage density was found to be significantly higher in the AMI and ACS groups compared to the SAP group .74, 75 Fig. 7Conventional OCT image of a ruptured TCFA obtained from a patient with AMI (obtained in vivo). (B) In this image, macrophage density data (NSD) from the fibrous cap is displayed using a color look-up table. , lipid pool; arrow, intimal disruption; *, guidewire artifacts. Tick marks, .  Both focal and multi-focal elevations of macrophage density were associated with severity of clinical presentation. 75 There is great interest in understanding the role of focal versus multi-focal plaque features in the pathogenesis of acute coronary thrombosis. The unique ability of OCT to quantify macrophage content and observe the spatial distribution of plaque macrophages provides a valuable tool for investigating this critical question. Supporting the concept of focal risk, sites of plaque rupture demonstrated a greater macrophage density than nonrupture sites ( , ; ).75 In addition, macrophage density was significantly higher at the surface (first ) of culprit plaques in comparison to remote lesions, indicating that superficial macrophages confer a higher risk for developing an acute thrombus.75 This finding represents a new understanding of the role of macrophages in the pathogenesis of acute coronary disease and may provide an additional parameter to assess individual plaque risk. We also found evidence in support of the multi-focal hypothesis. Macrophage densities at remote sites were correlated with measurements at culprit sites within the same patient ( ; ).75 Fibrous plaques, which are not considered to be high-risk lesions, had a higher macrophage content in patients with acute disease, compared with stable patients .75 Taken together, these results suggest that both focal and multi-focal macrophage distributions play important roles governing the severity of CAD. 6.Current Technology ChallengesStudies conducted with OCT clearly demonstrate the potential of this technology for impacting the management of CAD. However, limitations of current technology may preclude widespread use. Most importantly, due to its scattering and absorption, removal of blood interposed between the catheter and the arterial wall is required in order to obtain a clear, unobstructed view. Saline purging adequately removes blood from the field, but at current imaging frame rates , intracoronary OCT with saline flushing reduces to a single cross-sectional measurement. As a result, large area screening of vessel pathology required for widespread adoption is untenable with this paradigm. Balloon occlusion with saline purging, such as is commonly employed during angioscopy, remains a viable option for certain interventional communities.42, 76 However, this technique is not favored in the United States. Strategies such as reducing the scattering of blood by administering an index matching fluid or administration of a transparent oxygen-carrying blood substitute have been proposed to reduce the blood-attenuation problem.77, 78 More research needs to be conducted in these areas to determine the clinical viability of these methods. Another line of attack for overcoming the blood-attenuation problem is to increase the frame rate significantly, which can commensurately increase the information yield per purge. While conventional time-domain OCT systems have a frame rate of approximately , new frequency-domain OCT technology, spectral-domain OCT (SD-OCT) 79, 80, 81, 82, 83 and optical frequency domain imaging (OFDI), enable more than an order of magnitude higher frame rates.84, 85, 86 Due to their high speeds, these second-generation OCT systems further open up the possibility of conducting three-dimensional comprehensive volumetric microscopy of long arterial segments. One common misconception regarding OCT is that it can replace intravascular ultrasound. In fact, each technology excels at different tasks. IVUS obtains images through blood with approximately resolution and a depth of penetration of approximately . OCT on the other hand obtains images with much higher resolution, but cannot penetrate as deeply . As a result, OCT is particularly well suited to investigating microscopic features at the surface of the arterial wall, which are characteristic of high-risk vulnerable plaques. However, the infrared light utilized by OCT does not reach the back wall of thick atherosclerotic lesions and therefore this technology is probably not appropriate for evaluating pathology such as remodeling that is manifested by alterations of the elastic laminae. Separate from the depth of penetration issue, conventional time-domain technology also has a limited depth range over which signals can be obtained. This limited ranging depth presents difficulties visualizing the entire arterial circumference, notably when the catheter is eccentrically placed within a large diameter vessel. Auto-ranging, which adaptively adjusts the RSOD galvanometer to follow the lumen of the arterial wall, is one viable solution to this problem.87 Additionally, second generation OFDI systems84 inherently provide up to of ranging depth, which is sufficient to visualize the entire artery even at the coronary ostia. 7.ConclusionTo date, optical coherence tomography has had a tangible impact on the quest to understand and identify the vulnerable plaque. It is the only method demonstrated to be capable of measuring all of the microscopic features associated with TCFAs. Our knowledge of the morphology of plaques associated with AMI, previously predicated on retrospective autopsy studies, has now been confirmed in living human patients with this technology. New information regarding macrophage distributions in patients with severe CAD, and insight into the focal and diffuse nature of the inflammatory atherosclerotic process has been uncovered. The promise of intracoronary OCT is great, yet important challenges still remain. Much needs to be learned about the disease in order to ascertain the eventual role of this or any other intravascular modality in clinical practice. The prevalence, incidence, and natural history of high-risk lesions are presently poorly understood. Studies are currently underway using OCT and other imaging modalities to investigate the evolution of individual coronary lesions. Tests capable of screening a large population to determine patients that require more detailed intracoronary evaluation must be developed. Local treatment strategies have been proposed, including lesion stabilization with drug-eluting stents88, 89 and photodynamic therapy,90, 91 but the long-term clinical viability of these approaches is currently unknown. While there is still much to be done, we anticipate that the unique capabilities of OCT as an investigational tool for high-risk lesions will serve the cardiology community well as it advances to understand, identify, and ultimately treat the vulnerable plaque. AcknowledgmentsStudies by the authors described in this manuscript were funded in part by the Center for Integration of Medicine and Innovative Technology (development of the imaging platform), Guidant Corporation, and the National Institutes of Health (grants R01-HL70039 and R01-HL76398). We gratefully acknowledge Masamichi Takano for his assistance with OCT imaging of thrombus. References, “Heart and Stroke Facts: Statistical Supplement,”
(1996) Google Scholar
, “Heart Disease and Stroke Statistics—2003 Update,”
(2003) Google Scholar
F. D. Kolodgie,
A. P. Burke,
A. Farb,
H. K. Gold,
J. Yuan,
J. Narula,
A. V. Finn, and
R. Virmani,
“The thin-cap fibroatheroma: a type of vulnerable plaque: the major precursor lesion to acute coronary syndromes,”
Curr. Opin. Cardiol., 16 285
–292
(2001). 0268-4705 Google Scholar
R. Virmani,
F. D. Kolodgie,
A. P. Burke,
A. Farb, and
S. M. Schwartz,
“Lesions from sudden coronary death: a comprehensive morphological classification scheme for atherosclerotic lesions,”
Arterioscler., Thromb., Vasc. Biol., 20 1262
–1275
(2000). 1079-5642 Google Scholar
R. Virmani,
A. P. Burke,
A. Farb, and
F. D. Kolodgie,
“Pathology of the unstable plaque,”
Prog. Cardiovasc. Dis., 44 349
–356
(2002). 0033-0620 Google Scholar
M. J. Davies,
“Stability and instability: two faces of coronary atherosclerosis. The Paul Dudley White Lecture 1995,”
Circulation, 94 2013
–2020
(1996). 0009-7322 Google Scholar
E. Falk,
“Why do plaques rupture?,”
Circulation, 86 III30
–42
(1992). 0009-7322 Google Scholar
M. J. Davies,
“Detecting vulnerable coronary plaques,”
Lancet, 347 1422
–1423
(1996). 0140-6736 Google Scholar
G. K. Sukhova,
U. Schonbeck,
E. Rabkin,
F. J. Schoen,
A. R. Poole,
R. C. Billinghurst, and
P. Libby,
“Evidence for increased collagenolysis by interstitial collagenases-1 and -3 in vulnerable human atheromatous plaques,”
Circulation, 99 2503
–2509
(1999). 0009-7322 Google Scholar
G. C. Cheng,
H. M. Loree,
R. D. Kamm,
M. C. Fishbein, and
R. T. Lee,
“Distribution of circumferential stress in ruptured and stable atherosclerotic lesions. A structural analysis with histopathological correlation,”
Circulation, 87 1179
–1187
(1993). 0009-7322 Google Scholar
R. T. Lee,
A. J. Grodzinsky,
E. H. Frank,
R. D. Kamm, and
F. J. Schoen,
“Structure-dependent dynamic mechanical behavior of fibrous caps from human atherosclerotic plaques,”
Circulation, 83 1764
–1770
(1991). 0009-7322 Google Scholar
P. R. Moreno,
V. H. Bernardi,
J. Lopez-Cuellar,
A. M. Murcia,
I. F. Palacios,
H. K. Gold,
R. Mehran,
S. K. Sharma,
Y. Nemerson,
V. Fuster, and
J. T. Fallon,
“Macrophages, smooth muscle cells, and tissue factor in unstable angina. Implications for cell-mediated thrombogenicity in acute coronary syndromes,”
Circulation, 94 3090
–3097
(1996). 0009-7322 Google Scholar
A. G. Zaman,
G. Helft,
S. G. Worthley, and
J. J. Badimon,
“The role of plaque rupture and thrombosis in coronary artery disease,”
Atherosclerosis, 149 251
–266
(2000). 0021-9150 Google Scholar
A. C. van der Wal,
A. E. Becker,
C. M. van der Loos, and
P. K. Das,
“Site of intimal rupture or erosion of thrombosed coronary atherosclerotic plaques is characterized by an inflammatory process irrespective of the dominant plaque morphology,”
Circulation, 89 36
–44
(1994). 0009-7322 Google Scholar
A. Farb,
A. P. Burke,
A. L. Tang,
T. Y. Liang,
P. Mannan,
J. Smialek, and
R. Virmani,
“Coronary plaque erosion without rupture into a lipid core. A frequent cause of coronary thrombosis in sudden coronary death,”
Circulation, 93 1354
–1363
(1996). 0009-7322 Google Scholar
E. Arbustini,
M. Grasso,
M. Diegoli,
A. Pucci,
M. Bramerio,
D. Ardissino,
L. Angoli,
S. de Servi,
E. Bramucci,
A. Mussini,
“Coronary atherosclerotic plaques with and without thrombus in ischemic heart syndromes: a morphologic, immunohistochemical, and biochemical study,”
Am. J. Cardiol., 68 36B
–50B
(1991). 0002-9149 Google Scholar
G. Rioufol,
G. Finet,
I. Ginon,
X. Andre-Fouet,
R. Rossi,
E. Vialle,
E. Desjoyaux,
G. Convert,
J. F. Huret, and
A. Tabib,
“Multiple atherosclerotic plaque rupture in acute coronary syndrome: a three-vessel intravascular ultrasound study,”
Circulation, 106 804
–808
(2002). 0009-7322 Google Scholar
L. M. Biasucci,
G. Liuzzo,
C. Colizzi, and
A. Maseri,
“The role of cytokines in unstable angina,”
Expert Opin. Investig. Drugs, 7 1667
–1672
(1998) Google Scholar
W. Cascells,
M. Naghavi, and
J. T. Willerson,
“Vulnerable atherosclerotic plaque: a multfocal disease,”
Circulation, 107 2072
–2075
(2003). 0009-7322 Google Scholar
R. Krams,
D. Segers,
B. M. Gourabi,
W. Maat,
C. Cheng,
C. van Pelt,
L. C. van Damme,
P. de Feyter,
T. van der Steen,
C. L. de Korte, and
P. W. Serruys,
“Inflammation and atherosclerosis: mechanisms underlying vulnerable plaque,”
J. Intery. Cardiol., 16 107
–113
(2003) Google Scholar
A. Maseri and
V. Fuster,
“Is there a vulnerable plaque?,”
Circulation, 107 2068
–2071
(2003). 0009-7322 Google Scholar
D. J. Kereiakes,
“The emperor’s clothes: in search of the vulnerable plaque,”
Circulation, 107 2076
–2077
(2003). 0009-7322 Google Scholar
P. G. Yock and
P. J. Fitzgerald,
“Intravascular ultrasound: state of the art and future directions,”
Am. J. Cardiol., 81 27E
–32E
(1998). 0002-9149 Google Scholar
M. Yamaguchi,
M. Terashima,
K. Awano,
M. Kijima,
S. Nakatani,
S. Daikoku,
K. Ito,
Y. Yasamura, and
K. Miyatake,
“Morphology of vulnerable coronary plaques: insights from follow-up of patients examined by intravascular ultrasound before an acute coronary event,”
J. Am. Coll. Cardiol., 35 106
–111
(2000). 0735-1097 Google Scholar
A. J. Martin,
L. K. Ryan,
A. I. Gotlieb,
R. M. Henkelman, and
F. S. Foster,
“Arterial imaging: comparison of high-resolution US and MR imaging with histologic correlation,”
Radiographics, 17 189
–202
(1997). 0271-5333 Google Scholar
P. Schoenhagen and
S. E. Nissen,
“Understanding coronary artery disease: tomographic imaging with intravascular ultrasound,”
Heart, 88 91
–96
(2002). 1355-6037 Google Scholar
J. M. Tobis,
J. Mallery,
D. Mahon,
K. Lehmann,
P. Zalesky,
J. Griffith,
J. Gessert,
M. Moriuchi,
M. McRae,
M.-L. Dwyer,
N. Greep, and
W. L. Henry,
“Intravascular ultrasound imaging of human cornary arteries in vivo: analysis of tissue characterizations with comparison to in vitro histological specimens,”
Circulation, 83 913
–926
(1991). 0009-7322 Google Scholar
F. Prati,
E. Arbustini,
A. Labellarte,
B. Dal Bello,
L. Sommariva,
M. T. Mallus,
A. Pagano, and
A. Boccanelli,
“Correlation between high frequency intravascular ultrasound and histomorphology in human coronary arteries,”
Heart, 85 567
–570
(2001). 1355-6037 Google Scholar
J. A. Rumberger,
T. Behrenbeck,
J. F. Breen, P. F. Sheedy II,
“Coronary calcification by electron beam computed tomography and obstructive coronary artery disease: a model for costs and effectiveness of diagnosis as compared with conventional cardiac testing methods,”
J. Am. Coll. Cardiol., 33 453
–462
(1999). 0735-1097 Google Scholar
N. D. Wong,
A. Vo,
D. Abrahamson,
J. M. Tobis,
H. Eisenberg, and
R. C. Detrano,
“Detection of coronary artery calcium by ultrafast computed tomography and its relation to clinical evidence or coronary artery disease,”
Am. J. Cardiol., 73 223
–227
(1994). 0002-9149 Google Scholar
M. J. Budoff and
B. H. Brundage,
“Electron beam computed tomography: screening for coronary artery disease,”
Clin. Cardiol., 22 554
–558
(1999). 0160-9289 Google Scholar
M. Naghavi,
M. Madjid,
M. R. Khan,
R. M. Mohammadi,
J. T. Willerson, and
S. W. Casscells,
“New developments in the detection of vulnerable plaque,”
Current Atherosclerosis Rep., 3 125
–135
(2001) Google Scholar
F. M. Baer,
P. Theissen,
J. Crnac,
M. Schmidt,
M. Jochims, and
H. Schicha,
“MRI assessment of coronary artery disease,”
Rays, 24 46
–59
(1999). 0390-7740 Google Scholar
J. F. Toussaint,
G. M. LaMuraglia,
J. F. Southern,
V. Fuster, and
H. L. Kantor,
“Magnetic resonance images lipid, fibrous, calcified, hemorrhagic, and thrombotic components of human atherosclerosis in vivo,”
Circulation, 94 932
–938
(1996). 0009-7322 Google Scholar
G. Helft,
S. G. Worthley,
V. Fuster,
Z. A. Fayad,
A. G. Zaman,
R. Corti,
J. T. Fallon, and
J. J. Badimon,
“Progression and regression of atherosclerotic lesions: monitoring with serial noninvasive magnetic resonance imaging,”
Circulation, 105 993
–998
(2002). 0009-7322 Google Scholar
J. C. Machado and
F. S. Foster,
“Ultrasonic integrated backscatter coefficient profiling of human coronary arteries in vitro,”
IEEE Trans. Ultrason. Ferroelectr. Freq. Control, 48 17
–27
(2001). 0885-3010 Google Scholar
M. P. Urbani,
E. Picano,
G. Parenti,
A. Mazzarisi,
L. Fiori,
M. Paterni,
G. Pelosi, and
L. Landini,
“In vivo radiofrequency-based ultrasonic tissue characterization of the atherosclerotic plaque,”
Stroke, 24 1507
–1512
(1993). 0039-2499 Google Scholar
C. L. de Korte,
A. F. W. van der Steen,
E. I. Cespedes,
G. Pasterkamp,
S. G. Carlier,
F. Mastik,
A. H. Schoneveld,
P. W. Serruys, and
N. Bom,
“Characterization of plaque components and vulnerability with intravascular ultrasound elastography,”
Phys. Med. Biol., 45 1465
–1475
(2000). https://doi.org/10.1088/0031-9155/45/6/305 0031-9155 Google Scholar
Y. Ueda,
M. Asakura,
O. Yamaguchi,
A. Hirayama,
M. Hori, and
K. Kodama,
“The healing process of infarct-related plaques,”
J. Am. Coll. Cardiol., 38 1916
–1922
(2001). 0735-1097 Google Scholar
M. Asakura,
Y. Ueda,
O. Yamaguchi,
T. Adachi,
A. Hirayama,
M. Hori, and
K. Kodama,
“Extensive development of vulnerable plaques as a pan-coronary process in patients with myocardial infarction: an angioscopic study,”
J. Am. Coll. Cardiol., 37 1284
–1288
(2001). 0735-1097 Google Scholar
K. Kodama,
A. Hirayama, and
Y. Ueda,
“Usefulness of coronary angioscopy for the evaluation of hyperlipidemia,”
Nippon Rinsho, 60 927
–932
(2002). 0047-1852 Google Scholar
K. Mizuno and
H. Nakamura,
“Percutaneous coronary angioscopy: present role and future direction,”
Ann. Med., 25 1
–2
(1993). 0785-3890 Google Scholar
S. Waxman,
“Characterization of the unstable lesion by angiography, angioscopy, and intravascular ultrasound,”
Cardiol. Clin., 17 295
–305
(1999). 0733-8651 Google Scholar
P. R. Moreno,
R. A. Lodder,
K. R. Purushothaman,
W. E. Charash,
W. N. O’Connor, and
J. E. Muller,
“Detection of lipid pool, thin fibrous cap, and inflammatory cells in human aortic atherosclerotic plaques by near-infrared spectroscopy,”
Circulation, 105 923
–927
(2002). https://doi.org/10.1161/hc0802.104291 0009-7322 Google Scholar
A. Christov,
R. M. Korol,
E. Dai,
L. Liu,
H. Guan,
M. A. Bernards,
P. B. Cavers,
D. Susko, and
A. Lucas,
“In vivo optical analysis of quantitative changes in collagen and elastin during arterial remodeling,”
Photochem. Photobiol., 81 457
–466
(2005). 0031-8655 Google Scholar
L. Marcu,
Q. Fang,
J. A. Jo,
T. Papaioannou,
A. Dorafshar,
T. Reil,
J. H. Qiao,
J. D. Baker,
J. A. Freischlag, and
M. C. Fishbein,
“In vivo detection of macrophages in a rabbit atherosclerotic model by time-resolved laser-induced fluorescence spectroscopy,”
Atherosclerosis, 181 295
–303
(2005). https://doi.org/10.1016/j.atherosclerosis.2005.02.010 0021-9150 Google Scholar
L. Marcu,
M. C. Fishbein,
J. M. Maarek, and
W. S. Grundfest,
“Discrimination of human coronary artery atherosclerotic lipid-rich lesions by time-resolved laser-induced fluorescence spectroscopy,”
Arterioscler., Thromb., Vasc. Biol., 21 1244
–1250
(2001). 1079-5642 Google Scholar
T. J. Romer, J. F. Brennan III, M. Fitzmaurice,
M. L. Feldstein,
G. Deinum,
J. L. Myles,
J. R. Kramer,
R. S. Lees, and
M. S. Feld,
“Histopathology of human coronary atherosclerosis by quantifying its chemical composition with Raman spectroscopy,”
Circulation, 97 878
–885
(1998). 0009-7322 Google Scholar
H. P. Buschman,
G. Deinum,
J. T. Motz,
M. Fitzmaurice,
J. R. Kramer,
A. van der Laarse,
A. V. Bruschke, and
M. S. Feld,
“Raman microspectroscopy of human coronary atherosclerosis: biochemical assessment of cellular and extracellular morphologic structures in situ,”
Cardiovasc. Pathol., 10 69
–82
(2001). https://doi.org/10.1016/S1054-8807(01)00064-3 1054-8807 Google Scholar
W. Casscells,
B. Hathorn,
M. David,
T. Krabach,
W. K. Vaughn,
H. A. McAllister,
G. Bearman, and
J. T. Willerson,
“Thermal detection of cellular infiltrates in living atherosclerotic plaques: possible implications for plaque rupture and thrombosis,”
Lancet, 347 1447
–1451
(1996). 0140-6736 Google Scholar
C. Stefanadis,
K. Toutouzas,
E. Tsiamis,
C. Stratos,
M. Vavuranakis,
I. Kallikazaros,
D. Panagiotakos, and
P. Toutouzas,
“Increased local temperature in human coronary atherosclerotic plaques: an independent predictor of clinical outcome in patients undergoing a percutaneous coronary intervention,”
J. Am. Coll. Cardiol., 37 1277
–1283
(2001). 0735-1097 Google Scholar
F. J. van der Meer,
D. J. Faber,
D. M. Baraznji Sassoon,
M. C. Aalders,
G. Pasterkamp, and
T. G. van Leeuwen,
“Localized measurement of optical attenuation coefficients of atherosclerotic plaque constituents by quantitative optical coherence tomography,”
IEEE Trans. Med. Imaging, 24 1369
–1376
(2005). 0278-0062 Google Scholar
N. A. Patel,
D. L. Stamper, and
M. E. Brezinski,
“Review of the ability of optical coherence tomography to characterize plaque, including a comparison with intravascular ultrasound,”
Cardiovasc. Intervent Radiol., 28 1
–9
(2005). 0174-1551 Google Scholar
E. Regar,
J. A. Schaar,
E. Mont,
R. Virmani, and
P. W. Serruys,
“Optical coherence tomography,”
Cardiovasc. Radiat. Med., 4 198
–204
(2003) Google Scholar
H. Yabushita,
B. E. Bouma,
S. L. Houser,
H. T. Aretz,
I. K. Jang,
K. Schlendorf,
C. R. Kauffman,
M. Shishkov,
D. H. Kang,
E. F. Halpern, and
G. J. Tearney,
“Characterization of human atherosclerosis by optical coherence tomography,”
Circulation, 106 1640
–1645
(2002). https://doi.org/10.1161/01.CIR.0000029927.92825.F6 0009-7322 Google Scholar
G. J. Tearney,
S. A. Boppart,
B. E. Bouma,
M. E. Brezinski,
N. J. Weissman,
J. F. Southern, and
J. G. Fujimoto,
“Scanning single-mode fiber optic catheter-endoscope for optical coherence tomography,”
Opt. Lett., 21 1
–3
(1996). 0146-9592 Google Scholar
M. E. Brezinski,
G. J. Tearney,
B. E. Bouma,
J. A. Izatt,
M. R. Hee,
E. A. Swanson,
J. F. Southern, and
J. G. Fujimoto,
“Optical coherence tomography for optical biopsy: properties and demonstration of vascular pathology,”
Circulation, 93 1206
–1213
(1996). 0009-7322 Google Scholar
G. J. Tearney,
M. E. Brezinski,
B. E. Bouma,
S. A. Boppart,
C. Pitris,
J. F. Southern, and
J. G. Fujimoto,
“In vivo endoscopic optical biopsy with optical coherence tomography,”
Science, 276 2037
–2039
(1997). https://doi.org/10.1126/science.276.5321.2037 0036-8075 Google Scholar
B. E. Bouma and
G. J. Tearney,
“Power-efficient nonreciprocal interferometer and linear-scanning fiber-optic catheter for optical coherence tomography,”
Opt. Lett., 24 531
–533
(1999). 0146-9592 Google Scholar
I. K. Jang,
B. E. Bouma,
D. H. Kang,
S. J. Park,
S. W. Park,
K. B. Seung,
K. B. Choi,
M. Shishkov,
K. Schlendorf,
E. Pomerantsev,
S. L. Houser,
H. T. Aretz, and
G. J. Tearney,
“Visualization of coronary atherosclerotic plaques in patients using optical coherence tomography,”
J. Am. Coll. Cardiol., 39 604
–609
(2002). https://doi.org/10.1016/S0735-1097(01)01799-5 0735-1097 Google Scholar
G. J. Tearney,
B. E. Bouma, and
J. G. Fujimoto,
“High-speed phase- and group-delay scanning with a grating-based phase control delay line,”
Opt. Lett., 22 1811
–1813
(1997). 0146-9592 Google Scholar
M. Shishkov,
B. E. Bouma,
I. K. Jang,
H. T. Aretz,
S. L. Houser,
T. J. Brady,
K. Schlendorf, and
G. J. Tearney,
“Optical coherence tomography of porcine coronary arteries in vivo,”
Google Scholar
P. R. Moreno,
E. Falk,
I. F. Palacios,
J. B. Newell,
V. Fuster, and
J. T. Fallon,
“Macrophage infiltration in acute coronary syndromes: implications for plaque rupture,”
Circulation, 90 775
–778
(1994). 0009-7322 Google Scholar
C. L. Lendon,
M. J. Davies,
G. V. Born, and
P. D. Richardson,
“Atherosclerotic plaque caps are locally weakened when macrophage density is increased,”
Atherosclerosis, 87 87
–90
(1991). https://doi.org/10.1016/0021-9150(91)90235-U 0021-9150 Google Scholar
M. J. Davies,
P. D. Richardson,
N. Woolf,
D. R. Katz, and
J. Mann,
“Risk of thrombosis in human atherosclerotic plaques: role of extracellular lipid, macrophage, and smooth muscle cell content,”
Br. Heart J., 69 377
–381
(1993). 0007-0769 Google Scholar
G. J. Tearney,
H. Yabushita,
S. L. Houser,
H. T. Aretz,
I. K. Jang,
K. Schlendorf,
C. R. Kauffman,
M. Shishkov,
E. F. Halpern, and
B. E. Bouma,
“Quantification of macrophage content in atherosclerotic plaques by optical coherence tomography,”
Circulation, 107 113
–119
(2003). https://doi.org/10.1161/01.CIR.0000044384.41037.43 0009-7322 Google Scholar
S. Goto and
S. Handa,
“Coronary thrombosis. Effects of blood flow on the mechanism of thrombus formation,”
Jpn. Heart J., 39 579
–596
(1998). 0021-4868 Google Scholar
I. K. Jang and
M. J. Hursting,
“When heparins promote thrombosis: review of heparin-induced thrombocytopenia,”
Circulation, 111 2671
–2683
(2005). 0009-7322 Google Scholar
H. M. Loree,
A. J. Grodzinsky,
S. Y. Park,
L. J. Gibson, and
R. T. Lee,
“Static circumferential tangential modulus of human atherosclerotic tissue,”
J. Biomech., 27 195
–204
(1994). https://doi.org/10.1016/0021-9290(94)90209-7 0021-9290 Google Scholar
G. J. Tearney,
I. K. Jang, and
B. E. Bouma,
“Evidence of cholesterol crystals in atherosclerotic plaque by optical coherence tomographic (OCT) imaging,”
Eur. Heart J., 24 1462
(2003). 0195-668X Google Scholar
I. K. Jang,
G. Tearney, and
B. Bouma,
“Visualization of tissue prolapse between coronary stent struts by optical coherence tomography: comparison with intravascular ultrasound,”
Circulation, 104 2754
(2001). 0009-7322 Google Scholar
I. K. Jang,
G. J. Tearney,
B. MacNeill,
M. Takano,
F. Moselewski,
N. Iftima,
M. Shishkov,
S. Houser,
H. T. Aretz,
E. F. Halpern, and
B. E. Bouma,
“In vivo characterization of coronary atherosclerotic plaque by use of optical coherence tomography,”
Circulation, 111 1551
–1555
(2005). https://doi.org/10.1161/01.CIR.0000159354.43778.69 0009-7322 Google Scholar
C. P. Cannon,
A. Battler,
R. G. Brindis,
J. L. Cox,
S. G. Ellis,
N. R. Every,
J. T. Flaherty,
R. A. Harrington,
H. M. Krumholz,
M. L. Simoons,
F. J. Van De Werf,
W. S. Weintraub,
K. R. Mitchell,
S. L. Morrisson,
R. G. Brindis,
H. V. Anderson,
D. S. Cannom,
W. R. Chitwood,
J. E. Cigarroa,
R. L. Collins-Nakai,
S. G. Ellis,
R. J. Gibbons,
F. L. Grover,
P. A. Heidenreich,
B. K. Khandheria,
S. B. Knoebel,
H. L. Krumholz,
D. J. Malenka,
D. B. Mark,
C. R. McKay,
E. R. Passamani,
M. J. Radford,
R. N. Riner,
J. B. Schwartz,
R. E. Shaw,
R. J. Shemin,
D. B. Van Fossen,
E. D. Verrier,
M. W. Watkins,
D. R. Phoubandith, and
T. Furnelli,
“American College of Cardiology key data elements and definitions for measuring the clinical management and outcomes of patients with acute coronary syndromes. A report of the American College of Cardiology Task Force on Clinical Data Standards (Acute Coronary Syndromes Writing Committee),”
J. Am. Coll. Cardiol., 38 2114
–2130
(2001). 0735-1097 Google Scholar
B. D. MacNeill,
B. E. Bouma,
H. Yabushita,
I. K. Jang, and
G. J. Tearney,
“Intravascular optical coherence tomography: cellular imaging,”
J. Nucl. Cardiol., 12 460
–465
(2005). 1071-3581 Google Scholar
B. D. MacNeill,
I. K. Jang,
B. E. Bouma,
N. Iftimia,
M. Takano,
H. Yabushita,
M. Shishkov,
C. R. Kauffman,
S. L. Houser,
H. T. Aretz,
D. DeJoseph,
E. F. Halpern, and
G. J. Tearney,
“Focal and multi-focal plaque macrophage distributions in patients with acute and stable presentations of coronary artery disease,”
J. Am. Coll. Cardiol., 44 972
–979
(2004). 0735-1097 Google Scholar
Y. Uchida,
N. Fumitaka,
T. Tomaru,
T. Morita,
T. Oshima,
T. Sasaki,
S. Morizuki, and
J. Hirose,
“Prediction of acute coronary syndromes by percutaneous coronary angioscopy in patients with stable angina,”
Am. Heart J., 130 195
–203
(1995). 0002-8703 Google Scholar
M. Brezinski,
K. Saunders,
C. Jesser,
X. Li, and
J. Fujimoto,
“Index matching to improve optical coherence tomography imaging through blood,”
Circulation, 103 1999
–2003
(2001). 0009-7322 Google Scholar
J. W. Villard,
M. D. Feldman,
J. Kim,
T. E. Milner, and
G. L. Freeman,
“Use of a blood substitute to determine instantaneous murine right ventricular thickening with optical coherence tomography,”
Circulation, 105 1843
–1849
(2002). 0009-7322 Google Scholar
M. Wojtkowski,
V. Srinivasan,
J. G. Fujimoto,
T. Ko,
J. S. Schuman,
A. Kowalczyk, and
J. S. Duker,
“Three-dimensional retinal imaging with high-speed ultrahigh-resolution optical coherence tomography,”
Ophthalmology, 112 1734
–1746
(2005). 0161-6420 Google Scholar
M. Wojtkowski,
R. Leitgeb,
A. Kowalczyk, and
A. F. Fercher,
“Fourier domain OCT imaging of the human eye in vivo,”
Proc. SPIE, 4619 230
–236
(2002). 0277-786X Google Scholar
G. Hausler and
M. W. Lindner,
“Coherence Radar and Spectral Radar - new tools for dermatological diagnosis,”
J. Biomed. Opt., 3 21
–31
(1998). https://doi.org/10.1117/1.429899 1083-3668 Google Scholar
N. Nassif,
B. Cense,
B. H. Park,
S. H. Yun,
T. C. Chen,
B. E. Bouma,
G. J. Tearney, and
J. F. de Boer,
“In vivo human retinal imaging by ultrahigh-speed spectral domain optical coherence tomography,”
Opt. Lett., 29 480
–482
(2004). https://doi.org/10.1364/OL.29.000480 0146-9592 Google Scholar
J. F. de Boer,
B. Cense,
B. H. Park,
M. C. Pierce,
G. J. Tearney, and
B. E. Bouma,
“Improved signal-to-noise ratio in spectral-domain compared with time-domain optical coherence tomography,”
Opt. Lett., 28 2067
–2069
(2003). 0146-9592 Google Scholar
S. H. Yun,
G. J. Tearney,
J. F. de Boer,
N. Iftimia, and
B. E. Bouma,
“High-speed optical frequency domain imaging,”
Opt. Express, 11 2953
–2963
(2003). 1094-4087 Google Scholar
S. H. Yun,
G. J. Tearney,
B. E. Bouma,
B. H. Park, and
J. F. de Boer,
“High-speed spectral-domain optical coherence tomography at wavelength,”
Opt. Express, 26 3598
–3604
(2003). 1094-4087 Google Scholar
M. A. Choma,
K. Hsu, and
J. A. Izatt,
“Swept source optical coherence tomography using an all-fiber 1300-nm ring laser source,”
J. Biomed. Opt., 10 044009
(2005). https://doi.org/10.1117/1.1961474 1083-3668 Google Scholar
N. Iftima,
B. E. Bouma,
J. F. de Boer,
B. H. Park,
B. Cense, and
G. J. Tearney,
“Adaptive ranging for optical coherence tomography,”
Opt. Express, 12 4025
–4034
(2004). https://doi.org/10.1364/OPEX.12.004025 1094-4087 Google Scholar
M. Valgimigli,
C. A. van Mieghem,
A. T. Ong,
J. Aoki,
G. A. Granillo,
E. P. McFadden,
A. P. Kappetein,
P. J. de Feyter,
P. C. Smits,
E. Regar,
W. J. Van der Giessen,
G. Sianos,
P. de Jaegere,
R. T. Van Domburg, and
P. W. Serruys,
“Short-and long-term clinical outcome after drug-eluting stent implantation for the percutaneous treatment of left main coronary artery disease: insights from the Rapamycin-Eluting and Taxus Stent Evaluated At Rotterdam Cardiology Hospital registries (RESEARCH and T-SEARCH),”
Circulation, 111 1383
–1389
(2005). 0009-7322 Google Scholar
A. Chieffo,
G. Stankovic,
E. Bonizzoni,
E. Tsagalou,
I. Iakovou,
M. Montorfano,
F. Airoldi,
I. Michev,
M. G. Sangiorgi,
M. Carlino,
G. Vitrella, and
A. Colombo,
“Early and mid-term results of drug-eluting stent implantation in unprotected left main,”
Circulation, 111 791
–795
(2005). 0009-7322 Google Scholar
T. N. Demidova and
M. R. Hamblin,
“Macrophage-targeted photodynamic therapy,”
Intl. J. Immunopathol. Pharmacol., 17 117
–126
(2004) Google Scholar
D. J. Kereiakes,
A. M. Szyniszewski,
D. Wahr,
H. C. Herrmann,
D. I. Simon,
C. Rogers,
P. Kramer,
W. Shear,
A. C. Yeung,
K. A. Shunk,
T. M. Chou,
J. Popma,
P. Fitzgerald,
T. E. Carroll,
D. Forer, and
D. C. Adelman,
“Phase I drug and light dose-escalation trial of motexafin lutetium and far red light activation (phototherapy) in subjects with coronary artery disease undergoing percutaneous coronary intervention and stent deployment: procedural and long-term results,”
Circulation, 108 1310
–1315
(2003). 0009-7322 Google Scholar
|


