
|
|
1.IntroductionAtherosclerotic cardiovascular disease is the primary cause of mortality in the western world and is predicted to continue as such well into the twenty-first century.1, 2 However, the current diagnostic standard, x-ray angiography, along with other techniques that observe arterial stenosis, is unable to detect the vulnerable atherosclerotic plaques responsible for the majority of acute vascular incidents.3, 4, 5, 6, 7, 8 As a result, numerous emerging technologies such as intravascular ultrasound, intravascular magnetic resonance imaging, thermography, angioscopy, elastography, positron emission tomography, and electron-beam computed tomography, are focused on enhancing current diagnostic capabilities.9 Additional techniques, such as fluorescence, reflectance, light scattering, and near-infrared spectroscopies, along with optical coherence tomography, exemplify the rapidly advancing class of optical diagnostics.10 Spectroscopic techniques are uniquely able to study the distinct chemical changes that occur during atherogenesis, and can therefore potentially provide clinicians with critical data that is not available from other technologies. Of particular interest is Raman spectroscopy which, by interrogating the vibrations of molecular bonds, provides a direct method for quantifying the chemical composition of biological tissue.11 In addition, this technique is capable of providing detailed morphological information about atherosclerotic plaque.12, 13 While Raman spectroscopy has been recognized as a powerful biomedical optical tool for more than a decade, applications have generally been limited to in vivo studies of skin14, 15, 16 or studies of in vitro tissue, because such investigations can be performed without the use of optical fiber probes. Although fiber optics allow remote access, they generally reduce signal collection and introduce an intense spectral background, which obscures the tissue signal of interest. Previous developments in optical fiber probe technology17, 18 allowed preliminary investigations of various organs in humans19, 20 and animals;21 however, these initial studies required compromisingly long collection times to obtain spectra with acceptable signal-to-noise ratios (SNR). The recent development of a small diameter, high throughput Raman probe with excellent filtering capabilities provides the ability to study remote organs with real-time diagnostic capability.22 We demonstrate the first real-time in vivo collection of Raman spectra of atherosclerosis. Disease states not previously encountered in vitro have been observed and analyzed for the first time, indicating that this technique is potentially useful in the identification of vulnerable atherosclerotic plaques. 2.MethodsThis study utilized peripheral vascular surgery to demonstrate the feasibility of in vivo Raman spectroscopy for diagnosing human atherosclerotic disease, because these procedures allow for the excision of conformational biopsies. We collected spectra from six carotid endarterectomies and 14 femoral bypasses, one of which also included an endarterectomy. Biopsies from 23 locations, with multiple spectral evaluation sites, were obtained for histology. A total of 38 sites were histologically examined, four of which could not be evaluated due to problems with sample processing. Additional sites, without biopsy, have also been examined, resulting in a total of 74 acquired spectra. 2.1.InstrumentationThe clinical instrument (Fig. 1 ) and newly designed optical fiber Raman probe used for these procedures is described in detail by Motz, 22, 23 Briefly, excitation laser light (Process Instruments, Salt Lake City, Utah) is coupled to the central fiber of a -long optical fiber bundle, which contains a total of 16 fibers. The transmitted light is filtered at the distal end of the probe to reject interfering signals from the fiber. A ball lens is then used to collimate the excitation light while efficiently gathering Raman scattered light from the tissue for coupling into the collection fiber ring. The resulting spatial resolution is roughly in both the lateral and axial directions, depending on the sample’s optical properties. The collection fibers are coupled to the slit of a spectrograph (Kaiser Optical Systems, Ann Arbor, Michigan) at the proximal end for dispersion onto a charge-coupled device (CCD) detector (Spec-10:400BR, Princeton Instruments, Trenton, New Jersey). 2.2.Clinical ProceduresPrior to each procedure, the clinical instrument and Raman probe were aligned and a spectrum of Teflon was acquired with excitation for reference, providing a means of power calibration in the sterile operating field. The probe and Teflon standard were then submitted for cold-gas ethylene oxide sterilization. Just prior to the procedure, the sterilized probe was recoupled to the experimental system, and spectra of the Teflon standard were taken as the system was adjusted to ensure proper excitation power (target of , range of ). During femoral bypass procedures, the probe was inserted through the proximal anastomosis site of the saline-flushed artery, making gentle contact with the posterior arterial wall while the spectra were acquired. As is standard with the angioscopy performed during these procedures, all room and surgical lights were turned off for the measurements. Spectra were also collected from the intimal side of the artery, directly adjacent to the incision, with the probe held normal to the vessel. The spectrally examined sites near the incision were carefully marked with a suture, and a small biopsy was taken. During endarterectomies, a surgical incision was made along the length of the carotid artery for removal of the plaque. Raman spectra were collected from the intimal surface prior to excision, taking careful note of the examined sites. The plaque was then surgically removed. Suturing of these sites for precise registration was not possible due to dense calcifications and time constraints; therefore, easily identifiable regions were interrogated to facilitate postsurgical marking with India ink. Spectra were collected at intervals for a total of . This protocol allows analysis of data averaged for different time intervals; however, all spectra presented and used for diagnosis have been averaged for only . Upgrades to the system software prior to the final procedure allowed for real-time diagnosis during surgery.23 All protocols have been approved by the Massachusetts Institute of Technology (MIT) Committee on the Use of Humans as Experimental Subjects and the Institutional Review Board of the MetroWest Hospital. Informed consent was obtained from all subjects prior to procedures. 2.3.Data ProcessingFollowing each procedure, calibration data were collected for spectral corrections. Wavenumber calibration was established with a Raman spectrum of 4-acetamidophenol. Chromatic intensity variations were corrected by collecting the spectrum from a tungsten white light source diffusely scattered by a reflectance standard. The remaining probe background generated in the optical fibers was characterized by collecting the scattered excitation light from a roughened aluminum surface. This background was optimally subtracted from the data in an iterative loop by using a scaling factor related to the tissue’s optical properties.22, 23 Tissue fluorescence background was modeled with a sixth-order polynomial.22, 24 Finally, the data was fit via non-negativity constrained least-squares minimization with the morphological model developed by Buschman for diagnosing coronary atherosclerosis.12, 13 This model includes in situ Raman spectra of collagen, elastin, cholesterol crystals, necrotic core and foam cells (lipid core), calcifications, adventitial fat, smooth muscle cells, and -carotene crystals, thus yielding a spectroscopic analysis comparable to that provided by histopathology.25 However, to accurately model the in vivo data, several additions were necessary. These include spectra of probe components (epoxy and sapphire) and two additional molecules encountered in the clinical environment: water and oxy-hemoglobin. In accordance with the initial morphological model, fit coefficients for the original eight-model components were renormalized to a total contribution of 100%, while the additional four components were reported in arbitrary units from the initial fits, thus retaining their internal model calibration. 2.4.HistologyBiopsied tissue was fixed in formalin, stained with hematoxylin and eosin, and submitted for histological evaluation by a blinded pathologist. The tissue was categorized according to the SNoMed classification scheme and then combined into three categories: nonatherosclerotic, noncalcified plaque, and calcified plaque.26 The samples were also evaluated to assess their propensity for rupture. To do so, we devised an objective system for scoring plaque vulnerability that assigned relative weights to the severity of histologic features associated with plaque rupture.27 Each section was examined for the presence and depth of foam cells and inflammatory cells, thickness of the overlying fibrous cap, dimensions of the necrotic core, and the presence of thrombosis, rupture, and intraplaque hemorrhage. Each of these criteria was assigned a numerical score (Table 1 ), which was summed to assign a total plaque vulnerability score (VPS), which ranged from 0 to 38 for the examined samples. Plaque rupture and thrombosis, the end result of plaque rupture, were both assigned a score of 10, as those features alone indicate a vulnerable plaque. One other histologic feature of highly unstable plaque, acute intraplaque hemorrhage, was also assigned a score of 10. All other criteria were assigned scores ranging from 1 to 5, assuming that several of these features would have to coexist for a plaque to be prone to rupture. Thus, the threshold between stable and vulnerable plaque was set at 10. Table 1Vulnerable plaque scoring criteria: sum scores ⩾10 indicates a vulnerable plaque.
3.ResultsAmong the spectroscopically examined sites from which biopsies were obtained, we encountered a wide range of pathologies. Representative fit coefficients of the major components from the morphological model developed by Buschman 12, 13 for typical cases are presented and normalized to sum to 100%. The contribution from oxy-hemoglobin is reported in arbitrary units (a.u.), retaining its initial scaling from the least-squares fitting, which normalizes all 12 in vivo model components to 100% (Table 2 ). In vivo spectra have been accumulated in only and are presented as dotted lines [Figs. 2a, 2c, 3a, 4a, 4c ]. Fits with the morphological model are shown as solid lines with the residual (data minus fit) offset below on the same scale. Lack of structure in the residuals indicates that the model accounts for all significant spectral components. Fig. 2Typical Raman spectra, model fits, and residuals seen during (a) femoral bypass and (c) femoral endarterectomy along with corresponding histology (b: bypass; d: endarterectomy). (b) A image exhibiting only minor intimal thickening that corresponds to the spectral data, which is dominated by medial smooth muscle cells and adventitial fat. (d) A superficial calcification that is reflected in the calcium hydroxyapatite dominated spectrum.  Fig. 3(a) Raman spectrum and (b) and (c) corresponding histology of an atheromatous plaque observed during carotid endarterectomy. The spectrum is dominated by cholesterol and lipid core, consistent with (b) the magnified histology showing numerous cholesterol clefts and foam cells. The peak at in (a) is due to the calcification, seen in the image [(c) arrow], which is below the surface of the tissue.  Fig. 4Raman spectra of (a) ruptured and (c) thrombosed plaques seen during different carotid endarterectomy surgeries. Both spectra have strong contributions from hemoglobin, consistent with the histology. The rupture site [(b) arrow] examined in spectrum (a) is clearly evident at the shoulder of the plaque, along with many erythrocytes and foam cells. (d) A relatively small thrombus attached to the arterial wall where spectrum (c) was obtained. 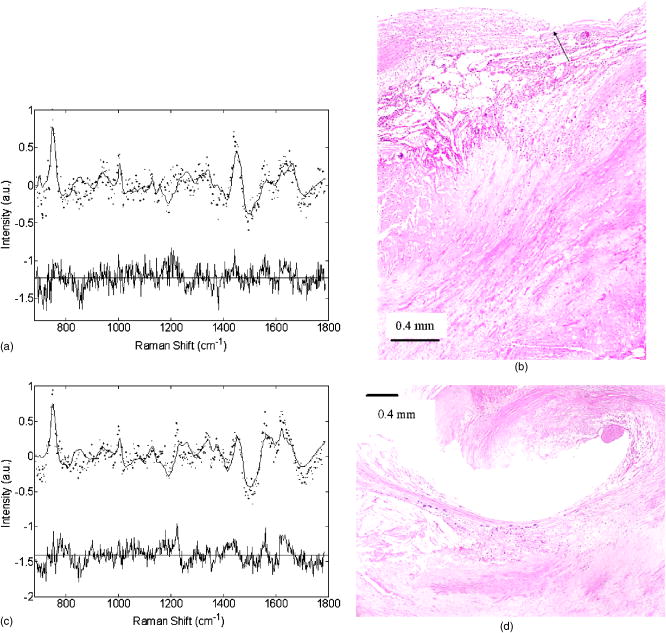 Table 2Mean and standard error of the major morphological model fit coefficients for the various tissue categories of two different diagnostic schemes (normal/noncalcified plaque/calcified plaque, and nonvulnerable/vulnerable plaque).
3.1.General Spectral Comparisons to HistologyTable 2 presents the mean and standard error of model fit coefficients for the various diagnostic categories studied (normal versus noncalcified plaque versus calcified plaque, or nonvulnerable versus vulnerable plaque), including all of the samples for which histology was obtained. Spectra obtained from anastomosis sites during femoral bypass surgery [Fig. 2a] were typified by intimal hyperplasia, characterized by moderate cellular proliferation and the deposition of structural proteins without significant accumulation of cholesterol and lipids [Fig. 2b]. Spectroscopic analysis of this sample demonstrates the predominance of medial smooth muscle cells, collagen, and fat from the supporting adventitial tissue (Table 3 ). Table 3Raman analysis of representative in vivo artery tissue.
Heavily calcified lesions were encountered during both femoral and carotid procedures. Lesions with large superficial calcifications [Fig. 2d], often seen during endarterectomy, show spectral fits dominated by calcium hydroxyapatite, smooth muscle cells, and structural proteins with, generally, minimal lipid contribution [Fig. 2c, and Tables 2, 3]. Spectral and histological evaluation of atheromatous plaques observed during both types of procedures revealed a significantly increased presence of cholesterol and foam cells/necrotic core [Table 2, and Figs. 3a and 3b]. In addition, these lesions often contained various amounts of calcification, which were detected at depths up to [Fig. 3c arrow, and Table 3]. The corresponding Raman analysis determines these mineralizations by a spectral peak at [Fig. 3a], contributing 16% to the fit in this case. 3.2.Thrombotic and Ruptured PlaquesIn general, the spectral fits to all of the examined sites showed no, or very little, contribution from hemoglobin, because the surgical field was thoroughly rinsed with saline prior to data acquisition. Of the 74 acquired spectra, only 14 samples had hemoglobin scores . Histology for 11 of these was available, five of which showed pathological evidence of hemorrhage, rupture, or thrombus. There were only four samples with hemoglobin scores , three of which showed the previous pathology. The surgeon noted that the operative field contained more blood than usual on the fourth case. For samples with hemoglobin scores and , two showed pathological evidence for the presence of blood, while five did not. There were also six samples that showed pathological evidence of acute or remote hemorrhage, but which had scores . Histological evaluation of ruptured plaque observed during a carotid endarterectomy procedure showed a moderately sized rupture site [Fig. 4b arrow] and evidence of acute intraplaque hemorrhage. The spectral fit [Fig. 4a and Table 3] had a significant contribution from hemoglobin, consistent with the presence of erythrocytes within the plaque. It should be noted that absorption from the hemoglobin also resulted in a markedly decreased SNR as compared to the spectra of other tissue types. This plaque also contained a significant number of foam cells, reflected in the 27% contribution of cholesterol. A plaque with acute mural thrombus seen during carotid endarterectomy [Figs. 4c and 4d] exhibited a very large spectral contribution from hemoglobin and again showed decreased SNR. 3.3.Vulnerable PlaquesThe potential for diagnosing vulnerable plaques with Raman spectroscopy has not been previously investigated, because this type of lesion was not encountered during in vitro studies. Within this in vivo study, however, several such plaques were observed. Using a detailed histological analysis that was designed for evaluating plaque vulnerability, we have found that 20 of the 34 samples evaluated had vulnerable plaque scores (VPS) . The remaining 14 samples bad a and are therefore considered to have an increased likelihood of rupturing. Logistic regression, using all eight of the morphological model components plus hemoglobin, was performed to determine the optimal parameters for diagnosis. It was determined that five components provided optimal separation between the two groups. These include hemoglobin, calcification, collagen, and a sum of the contribution from cholesterol and foam cells/necrotic core. Inclusion of the other components did not improve the separation. Leave-one-out cross validation was then performed, resulting in stable and vulnerable plaques being correctly identified, corresponding to a sensitivity and specificity of 79 and 85%, respectively. Although the significance of these values must be assessed cautiously due to the small number of samples, the results are very promising. Furthermore, the components that proved to be most useful in the diagnosis of vulnerable plaque are those expected from the known pathophysiology.25 4.DiscussionThis pilot study is the first investigation utilizing Raman spectroscopy to examine human atherosclerosis in vivo, and also the first to demonstrate the sensitivity of this technique to identify spectroscopic features associated with plaque vulnerability. We have seen excellent agreement between histological evaluation and the Raman analysis provided by our in vitro model with the addition of only a few spectral components. These additional components include water, hemoglobin, and contributions from materials used in the optical fiber probe construction. In particular, the addition of hemoglobin to the model yielded important information that was used in identifying the vulnerable plaques. The performance of our newly developed Raman probe22 was further validated by the high-quality spectra obtained in this study. Although spectra were collected at intervals for a total of , this was only done to ensure that valid data were obtained. All spectra presented and used for analysis have been integrated for only . The fit coefficients from 1- and data are highly correlated , indicating that collection times are sufficient for accurate diagnosis. Furthermore, there was little variation in the fit coefficients from second to second . The exception to this is the fit coefficients for cholesterol and lipid core, where occasional variations up to 11% were seen due to their high degree of spectral overlap. Nevertheless, spectral diagnoses were not affected, because these two coefficients are combined for analysis.12 Additionally, in cases where there was temporal variation, as the contribution of one component increased, the other decreased. In rare cases where there was more than 4% variation from second to second for any given component, it was generally obvious that the probe had slipped and moved to a new location. Given the fact that integration for is no longer necessary, this becomes less of an issue. In fact, our analysis shows that in most cases, sufficient SNR can be obtained in only (data not shown). An exception to this is for the hemorrhagic plaques that have decreased signal due to hemoglobin absorption. Importantly, we encountered tissue types in vivo that have not been observed during previous in vitro studies. We have also evaluated, for the first time, plaques that would be considered vulnerable for rupture. In the case of the thrombotic, ruptured, and hemorrhagic plaques, observation of the fit residuals using the initial model components indicated that we were not fully characterizing these spectra. This is not surprising, because it is the first time we had encountered these types of tissue. The addition of hemoglobin to the model largely resolved this issue; however, there is still room for improvement. We have investigated other likely candidates that could contribute to these spectra, including fibrin and fibrinogen; however, none have yielded further improvements. There were a few cases with discrepancies between the spectral and histological evaluation. Given the well-established literature regarding the use of Raman spectroscopy in the study of atherosclerosis, we attribute these disagreements to improper registration between the probed volume and the region examined by pathology. Especially in the case of carotid endarterectomy procedures, there were difficulties with marking the tissue due to the dense calcifications and time constraints of the surgery. In such cases, multiple sections were taken through the sample, and the average diagnosis throughout the tissue was used for spectral comparison. Alternate methods for marking tissue will be employed in future studies to improve registration. The in vivo sensitivity and specificity of 79 and 85% for Raman spectroscopic diagnosis of vulnerable plaques is a promising result given the limited dataset, and is similar to those of techniques currently used for screening many other diseases. These results are also similar to recent reports demonstrated by other spectroscopic methods. For example, Marcu have recently achieved 85 and 95% sensitivity and specificity, respectively, for distinguishing tissues rich in foam cells from those with high collagen content in a New Zealand rabbit model by using in vivo time-resolved fluorescence spectroscopy.28 Similarly, Moreno have achieved sensitivities and specificities ranging from 77 to 93% for distinguishing various features associated with plaque vulnerability when using near-infrared absorption spectroscopy to examine formalin-fixed human aorta.29 Given the high level of diagnostic accuracy generally provided by in vitro Raman spectroscopy studies, improvement beyond the statistics reported in this work can be expected. Additional in vitro research will be required to improve the spectral modeling of vulnerable plaques, and future in vivo studies with increased control of spectral-pathology registration will likely increase the diagnostic performance of this technique. This is also the first use of the VPS, our plaque vulnerability scoring system. Future studies will likely show a need to modify and improve the criteria and weighting factors, which were determined arbitrarily and validated in a study of culprit lesions in five patients who died of an acute vascular event, and five age-matched controls who had significant atherosclerosis but died of a nonvascular event (unpublished data). In future studies, it will also be useful to provide intermediate thresholds rather than a single level of separation between vulnerable and nonvulnerable plaques. Such an approach will allow plaques to be separated into a sliding scale of low, medium, and high risk groups for likelihood of rupture. Although this study provided real-time remote diagnosis in vivo, demonstrating several important advancements in Raman spectral diagnosis, important steps remain before this technology will be clinically viable. In addition to the modeling investigations mentioned before, further improvements in Raman probe technology are required. In the present study, a front-viewing probe was utilized in a surgical environment where the vessels were flushed with saline to remove blood, and the operating room lights were turned off during data acquisition. The development of side-viewing probes will allow percutaneous access to the vessels and eliminate the necessity to darken the room. The analysis employed in developing an algorithm for diagnosing vulnerable plaques revealed that hemoglobin content is an important means for identifying plaques exhibiting thrombus, rupture, and intraplaque hemorrhage. Thus, even in percutaneous settings, it will be advantageous to employ a saline flush to not only improve SNR by removing the intervening blood, but also to distinguish luminal blood from evidence of thrombus, rupture, or intraplaque hemorrhage. This is not a significant limitation, however, because other commonly used intravascular techniques require flushing before a measurement can be made. And the high SNR obtained in with the new Raman probe design render this a viable option. In addition to the work reported here, we are investigating an alternate approach, multimodal spectroscopy, which combines the strengths of Raman, fluorescence, diffuse reflectance, and light scattering spectroscopies. This approach utilizes wavelength-dependent transport properties of the various techniques to provide additional spatial information, thereby enhancing the ability to distinguish spectral features arising from different depths in the tissue. Thus, spectroscopic differentiation of lipid and protein signals that arise from superficial or deep regions of the tissue, information that is important for vulnerable plaque identification, may be obtainable. Clearly, a means of prospectively determining plaque vulnerability in vivo is needed to optimize the clinical management of patients. The range of applications for such a technology extends from urgent interventional and surgical procedures to long-term guidance of therapy.30 For example, it may be determined that lesions of certain compositions are effectively treated by administration of lipid-lowering statins, angiotensin converting enzyme (ACE) inhibitors, or pharmacological control of matrix metalloproteinases,31 while others require angioplasty with a specific type of stent, and still others will only be resolved with bypass surgery or some other intervention that has yet to be conceived. Such an approach would be similar to the staging of disease that is used in the evaluation of malignancy and, thus, the vast amount of information provided by Raman spectroscopy may offer the ability to guide such therapeutic interventions. AcknowledgmentsThis research was sponsored by the NIH (grant R01-HL-64675) and the National Center for Research Resources program (grant P41-RR-02594). Support was also generously contributed by the Pfizer Corporation and the Lord Foundation of MIT. We thank Charles Paniszyn and Linda Rossini for assistance in the clinical procedures, and also the entire surgical staff at the Leonard Morse campus of the MetroWest Medical Center for their uncompromising assistance in this research. ReferencesC. J. L. Murray and
A. D. Lopez, The Global Burden of Disease: A Comprehensive Assessment of Mortality and Disability From Diseases, Injuries, and Risk Factors in 1990 and Projected to 2020, Harvard University Press, Cambridge, MA
(1996). Google Scholar
S. Leeder,
S. Raymond,
H. Greenberg,
H. Liu, and
K. Esson, A Race Against Time: The Challenge of Cardiovascular Disease in Developing Economies, Earth Institute at Columbia University, New York
(2004). Google Scholar
S. Glagov,
A. B. Chandler, and
F. Cornhill, Clinical Diagnosis of Atherosclerosis: Quantitative Methods of Evaluation, Springer Verlag, New York
(1983). Google Scholar
S. Glagov,
C. K. Zarins,
D. P. Giddens, and
D. N. Ku,
“Hemodynamics and atherosclerosis: Insights and perspectives gained from studies of human arteries,”
Arch. Pathol. Lab Med., 11 1018
–1031
(1988). 0003-9985 Google Scholar
G. S. Mintz,
J. J. Popma,
A. D. Pichard,
K. M. Kent,
L. F. Satler,
Y. C. Chuang,
C. J. Ditrano, and
M. B. Leon,
“Patterns of calcification in coronary-artery disease—a statistical-analysis of intravascular ultrasound and coronary angiography in 1155 lesions,”
Circulation, 91
(7), 1959
–1965
(1995). 0009-7322 Google Scholar
E. J. Topol and
S. E. Nissen,
“Our preoccupation with coronary luminology. The dissociation between clinical and angiographic findings in ischemic heart disease,”
Circulation, 92
(8), 2333
–2314
(1995). 0009-7322 Google Scholar
E. M. Tuczu,
B. Berkalp,
A. C. DeFranco,
S. G. Ellis,
M. Goormastic,
P. L. Whitlow,
I. Franco,
R. E. Raymond, and
S. E. Nissen,
“The dilemma of diagnosing coronary classification: Angiography versus intravascular ultrasound,”
J. Am. Coll. Cardiol., 27 832
–838
(1996). 0735-1097 Google Scholar
S. Vallabhasjoula and
V. Fuster,
“Atherosclerosis: Imaging techniques and the evolving role of nuclear medicine,”
J. Nucl. Med., 28 1788
–1796
(1997). 0161-5505 Google Scholar
Z. A. Fayad and
V. Fuster,
“Clinical imaging of the high-risk or vulnerable atherosclerotic plaque,”
Circ. Res., 89
(4), 305
–316
(2001). 0009-7330 Google Scholar
T. Vo-Dinh, Biomedical Photonics Handbook, CRC Press, Boca Raton, FL
(2003). Google Scholar
E. B. Hanlon,
R. Manoharan,
T. W. Koo,
K. E. Shafer,
J. T. Motz,
M. Fitzmaurice,
J. R. Kramer,
I. Itzkan,
R. R. Dasari, and
M. S. Feld,
“Prospects for in vivo Raman spectroscopy,”
Phys. Med. Biol., 45
(2), R1
–R59
(2000). https://doi.org/10.1088/0031-9155/45/2/201 0031-9155 Google Scholar
H. P. Buschman,
J. T. Motz,
G. Deinum,
T. J. Römer,
M. Fitzmaurice,
J. R. Kramer,
A. van der Laarse,
A. V. Bruschke, and
M. S. Feld,
“Diagnosis of human coronary atherosclerosis by morphology-based Raman spectroscopy,”
Cardiovasc. Pathol., 10
(2), 59
–68
(2001). https://doi.org/10.1016/S1054-8807(01)00063-1 1054-8807 Google Scholar
H. P. J. Buschman,
G. Deinum,
J. T. Motz,
M. Fitzmaurice,
J. R. Kramer,
A. van der Laarse,
A. V. G. Bruschke, and
M. S. Feld,
“Raman microspectroscopy of human coronary atherosclerosis: Biochemical assessment of cellular and extracellular morphologic structures in situ,”
Cardiovasc. Pathol., 10
(2), 69
–82
(2001). https://doi.org/10.1016/S1054-8807(01)00064-3 1054-8807 Google Scholar
P. J. Caspers,
G. W. Lucassen,
H. A. Bruining, and
G. J. Puppels,
“Automated depth-scanning confocal Raman microspectrometer for rapid in vivo determination of water concentration profiles in human skin,”
J. Raman Spectrosc., 31 813
–818
(2000). https://doi.org/10.1002/1097-4555(200008/09)31:8/9<813::AID-JRS573>3.0.CO;2-7 0377-0486 Google Scholar
P. J. Caspers,
G. W. Lucassen,
R. Wolthuis,
H. A. Bruining, and
G. J. Puppels,
“In vitro and in vivo Raman spectroscopy of human skin,”
Biospectroscopy, 4 S31
–S39
(1998). https://doi.org/10.1002/(SICI)1520-6343(1998)4:5+<S31::AID-BSPY4>3.0.CO;2-M 1075-4261 Google Scholar
T. R. Hata,
T. A. Scholz,
I. V. Ermakov,
R. W. McClane,
F. Khachik,
W. Gellermann, and
L. K. Pershing,
“Non-invasive Raman spectroscopic detection of carotenoids in human skin,”
J. Invest. Dermatol., 115 441
–448
(2000). https://doi.org/10.1046/j.1523-1747.2000.00060.x 0022-202X Google Scholar
M. Shim,
B. Wilson,
E. Marple, and
M. Wach,
“Study of fiber-optic probes for in vivo medical Raman spectroscopy,”
Appl. Spectrosc., 53
(6), 619
–627
(1999). https://doi.org/10.1366/0003702991947225 0003-7028 Google Scholar
A. Mahadevan-Jansen,
W. F. Mitchell,
N. Ramanujam,
U. Utzinger, and
R. Richards-Kortum,
“Development of a fiber optic probe to measure NIR Raman spectra of cervical tissue in vivo,”
Photochem. Photobiol., 68
(3), 427
–431
(1998). https://doi.org/10.1562/0031-8655(1998)068<0427:DOAFOP>2.3.CO;2 0031-8655 Google Scholar
M. G. Shim,
L. M. W. K. Song,
N. E. Marcon, and
B. C. Wilson,
“In vivo near-infrared Raman spectroscopy: Demonstration of feasibility during clinical gastrointestinal endoscopy,”
Photochem. Photobiol., 72 146
–150
(2000). https://doi.org/10.1562/0031-8655(2000)072<0146:IVNIRS>2.0.CO;2 0031-8655 Google Scholar
U. Utzinger,
D. L. Heintzelman,
A. Mahadevan-Jansen,
A. Malpica,
M. Follen, and
R. Richards-Kortum,
“Near-infrared Raman spectroscopy for in vivo detection of cervical precancers,”
Appl. Spectrosc., 55
(8), 955
–959
(2001). https://doi.org/10.1366/0003702011953018 0003-7028 Google Scholar
H. P. Buschman,
E. T. Marple,
M. L. Wach,
B. Bennett,
T. C. B. Schut,
H. A. Bruining,
A. V. Bruschke,
A. van der Laarse, and
G. J. Puppels,
“In vivo determination of the molecular composition of artery wall by intravascular Raman spectroscopy,”
Anal. Chem., 72
(16), 3771
–3775
(2000). https://doi.org/10.1021/ac000298b 0003-2700 Google Scholar
J. T. Motz,
M. Hunter,
L. H. Galindo,
J. A. Gardecki,
J. R. Kramer,
R. R. Dasari, and
M. S. Feld,
“Optical fiber probe for biomedical Raman spectroscopy,”
Appl. Opt., 43
(3), 542
–554
(2004). https://doi.org/10.1038/nature02449 0003-6935 Google Scholar
J. T. Motz,
S. J. Gandhi,
O. R. Scepanovic,
A. S. Haka,
J. R. Kramer,
R. R. Dasari, and
M. S. Feld,
“Real-time Raman system for in vivo disease diagnosis,”
J. Biomed. Opt., 10
(3), 031113
(2005). https://doi.org/10.1117/1.1920247 1083-3668 Google Scholar
J. F. Brennan,
Y. Wang,
R. R. Dasari, and
M. S. Feld,
“Near-infrared Raman spectrometer systems for human tissue studies,”
Appl. Spectrosc., 51
(2), 201
–208
(1997). https://doi.org/10.1366/0003702971940134 0003-7028 Google Scholar
R. Virmani,
F. D. Kolodgie,
A. P. Burke,
A. Farb, and
S. M. Schwartz,
“Lessons from sudden coronary death: A comprehensive morphological classification scheme for atherosclerotic lesions,”
Arterioscler., Thromb., Vasc. Biol., 20
(5), 1262
–1275
(2000). 1079-5642 Google Scholar
R. Cote, Updated Version of the Systemized Nomenclature of Human and Veterinary Medicine (SNoMed): A Glossary, The College of American Pathologists, Northfield, IL
(1993). Google Scholar
R. Virmani,
A. P. Burke,
A. Farb, and
F. D. Kolodgie,
“Pathology of the unstable plaque,”
Prog. Cardiovasc. Dis., 44
(5), 349
–356
(2002). 0033-0620 Google Scholar
L. Marcu,
Q. Y. Fang,
J. A. Jo,
T. Papaioannou,
A. Dorafshar,
T. Reil,
J. H. Qiao,
J. D. Baker,
J. A. Freischlag, and
M. C. Fishbein,
“In vivo detection of macrophages in a rabbit atherosclerotic model by time-resolved laser-induced fluorescence spectroscopy,”
Atherosclerosis, 181
(2), 295
–303
(2005). 0021-9150 Google Scholar
P. R. Moreno,
R. A. Lodder,
K. R. Purushothaman,
W. E. Charash,
W. N. O’Connor, and
J. E. Muller,
“Detection of lipid pool, thin fibrous cap, and inflammatory cells in human aortic atherosclerotic plaques by near-infrared spectroscopy,”
Circulation, 105
(8), 923
–927
(2002). https://doi.org/10.1161/hc0802.104291 0009-7322 Google Scholar
E. Falk,
P. K. Shah, and
V. Fuster,
“Coronary plaque disruption,”
Circulation, 92
(3), 657
–671
(1995). 0009-7322 Google Scholar
P. Libby,
“Current concepts of the pathogenesis of the acute coronary syndromes,”
Circulation, 104
(3), 365
–372
(2001). 0009-7322 Google Scholar
|


