|
|
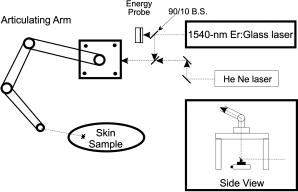
1.IntroductionThe Er:glass laser has now been in operation1 with both long pulses and -switched pulses for more than . Ocular hazards of this laser were reported early, and it was determined that damage to the eye occurred mainly in the cornea,2 where light from this wavelength is highly absorbed. Research on skin hazards has been reported only in the past few years because of the limited pulse energies of Er:glass lasers from both short and long pulses generated by these lasers, and they were not considered extremely dangerous. Currently, however, these lasers are being produced with pulse energies of hundreds of joules in the long-pulse mode (millisecond pulse duration), and many joules for pulses in the low nanosecond range. Medical devices3, 4 are being manufactured for dermatological uses such as removing benign tumors and skin resurfacing. Military applications include the handheld range finders for the U.S. Army and the low-altitude navigation and targeting systems for training purposes for the U.S. Air Force and Navy. The telecommunication industry in their fiber optics system makes use of this wavelength for pulse modulation and transmission. Currently, very few skin-damage threshold measurements have been reported in the literature for -wavelength exposures. Reported values vary to such a wide extent that additional measurements are required to support the American National Standards Institute5 standards revision. Experimental works to extend the database with consistent parameters for all safety standards, including ANSI Z136.1-2000, International Electrotechnical Commission (IEC) 60825-1, Food and Drug Administration (FDA), ICNRP, etc. are necessary. Furthermore, there is a great need for mathematical models that can make accurate predictions of damage levels based on threshold endpoints [estimated doses for 50% probability of laser-induced damage ( )] and reduce the required number of animal experiments. It is anticipated that such a model would provide reliable predictions for any type of laser for different pulse durations, wavelengths, and spot sizes. The ANSI Z136.1-2000 standard divides the electromagnetic spectrum into bands of wavelengths. Wavelengths from are considered the far IR, while the near IR is defined as the region ranging from . Maximum permissible exposures (MPEs) are defined for both the eye and the skin for the wavelength, and are dependent on the pulse duration. This wavelength is referred to as “eye safe” and has maintained that misnomer in the commercial arena from its beginning. “Eye safe” refers only to the retina and not the cornea or lens of the human eye in this context. The MPE in the ANSI standard is set to ensure that no injury to the retina, cornea, or skin occurs for exposures at or below the MPE. For example, the MPE for skin for a wavelength exposure with a pulse duration ranging from to is set at . Therefore, for exposures of skin and cornea above this MPE at , severe hazards can exist, negating the term “eye safe.” For a thorough understanding of laser hazard evaluation methods, see Marshall 6 The Yucatan mini-pig (Sus scrofa domestica) was used in this study as the model for determining the threshold dose at the minimum visible lesion (MVL) level for laser injury to skin at wavelength for a single pulse and a single pulse. The along with the fiducial limits at the 95% confidence level were determined for this exposure duration using the Probit7 analysis technique. We used the Yucatan mini-pig because it has been found to have a higher anatomical similarity to human skin than the commonly used Yorkshire mini-pig.8 Yucatan mini-pig skin is melanated and, on the flank, has a thickness similar to that of the human arm, which has a high probability of accidental exposure. The data obtained from this study on porcine skin damage will contribute to further understanding laser injury mechanisms. By using this model, the properties of human skin can be approximated more closely to gain a better understanding of the human/laser-tissue interaction for this wavelength. These results will add to the existing data on laser-skin effects on which safety standards are based and that affect employment of these lasers. 2.Materials and Methods2.1.Micosecond RegimeLaser exposures were accomplished with a laser system (Laser Sight Technologies Inc., Orlando, Florida) using an Er:glass rod, delivering light at a exposure duration and at various pulse energies. The laser produced a Gaussian beam profile, and it was used for the two smaller spot sizes (0.7 and , measured at irradiance) in this study. A -diam spot size (top-hat spatial profile) was produced by a second Er:glass laser (Megawatt Lasers, /pulse). Spot sizes were measured using an Electro Physics IR camera with a Spiricon LBA 500 laser beam analyzer and frame-grabber card. The pulse duration was measured by a model ET-3000 InGaAs Electro-Optics Technology, Inc., photodiode connected to a Tektronix model TDS 220 oscilloscope. Energy measurements were made with a calibrated Molectron model JD1000 energy meter and calibrated J25 and J50 energy probes, which were placed after a beamsplitter (BS) to collect 10% of the beam energy, and thus determine the actual energy delivered to the skin. An articulating arm in the laser beam delivery system (Laser Mechanisms, Inc.) was used to deliver the beam without having to move the subject. A metal “aiming ring” was attached to the end of the articulating arm, which maintained a constant distance between the arm’s aperture and the subject. This enabled the precise positioning and distance control necessary to deliver exposures of known spot size, more accurate beam delivery, and a higher number of exposures per subject, resulting in a reduction of the total number of subjects required. The laser system setup is depicted in Fig. 1 . 2.2.Nanosecond RegimeThe Megawatt laser used to produce microsecond pulses was modified by installing an optomechanical -switch (Taboada Research Instruments, Inc., San Antonio, Texas). The modified laser produced pulses in the range at various pulse energies up to /pulse. Pulse duration was measured in the same way as was done in the microsecond regime (InGaAs photodiode and oscilloscope). The beam diameter for these exposures was the same as for this laser in the microsecond regime and was measured using Zap-It paper. The optical system layout consisted of a BS followed by a -focal-length lens. A final turning mirror was used to aim the beam to the desired location. Energy measurements were made at the location of the BS using an Ophir Laserstar energy meter with Ophir model 30(150)-A-HE energy probes. A HeNe laser was used as marker beam to locate the exposure point (see Fig. 2 ). Due to the limited spatial range of the final turning mirror, the position of the subject needed adjusting for some of the exposure locations. A Panepinto Sling (Britz-Heidbrink, Inc.) was utilized to make the small spatial adjustments. The subject’s elevation could be changed as well as the lateral position of the subject. The distance of the subject from the laser was kept constant to ensure uniform spot size for each exposure. Eleven female Yucatan mini-pigs (Lonestar Laboratory Swine, Seguin, Texas, and S & S Farms, Ramona, California), weighing between 15 and , were involved in this study. At least three separate flanks were used at each spot size. Animals were between 3 and of age. The study progressed under the animal use protocol titled “Evaluation of Laser induced Corneal Lesions in the Dutch Belted Rabbit and Skin Lesions in the Yucatan Mini-Pig,” which was approved by the Brooks City-Base, Texas, Institutional Animal Care and Use Committee (IACUC). None of the animals were euthanized after exposure or biopsy, since they were part of an animal-sharing program. Pigs were fed standard commercially available diets and had unlimited access to water. However, solid food was withheld for prior to laser exposure and biopsy collection. The animals involved in this study were procured, maintained, and used in accordance with the Federal Animal Welfare Act and the “Guide for the Care and Use of Laboratory Animals” prepared by the Institute of Laboratory Animal Resources, National Research Council.9 Brooks City-Base, Texas, has been fully accredited by the Association for Assessment and Accreditation of Laboratory Animal Care, International (AAALAC) since 1967. The Yucatan mini-pig subjects were received from an attending veterinary technician via stretcher, sedated with an indwelling intravenous catheter placed in an ear vein, and intubated prior to arrival at the laboratory. The pigs were sedated by single syringe injection of tiletamine/zolazepam (4 to 6 mg/kg) intramuscular (IM) and xylazine (2.2 mg/kg) IM, and maintained on inhalation isoflurane anesthesia during all procedures. After sedation, hair on the flank was clipped using hand clippers and the underlying skin was cleansed with chlorhexadine solution and allowed to air dry. The cleansed skin was inspected by each of three evaluators to check for redness, irritation, or other confounding marks. All subjects were kept warm during the entirety of the procedures. Physiological parameters were monitored throughout all procedures. Buprenorphine (0.05 to 0.1 mg/kg) was administered intramuscularly for analgesia after biopsies were complete. The animals were returned to their runs on recovery to sternal recumbency from anesthesia. For each subject, the flank to be exposed was marked with two grids with a permanent-ink marker, making a total of 72 grid squares per flank. As previously mentioned, the distance between the articulating arm aperture and the skin was kept constant by the use of a metal ring attached to the end of the arm. The animal, positioned on a table, did not have to be moved during procedures. Energy was delivered with randomly varying levels to each square of one grid and this template of energies was repeated on the second grid. Postexposure, three punch biopsies were obtained from each subject immediately after the postexposure reading and two biopsies again after the reading. One of the three biopsy sites on each animal was chosen as a control (taken from a location superior to any exposure sites). All biopsy sites were closed with nonabsorbable 2-0 sutures and topically medicated with Trio-Mycin ointment for infection prophylaxis. Probit7 analysis was the statistical method used to determine the estimated dose for 50% probability of laser-induced damage for the in vivo skin model. Readings of injured sites were performed at 1 and at postexposure. All data points were entered into the Probit statistical analysis package and the were calculated along with their fiducial limits at the 95% confidence level, slopes, and probabilities. Three experienced readers examined the exposure sites and independently rated each site for visible damage. At least two out of three readers were required to identify an exposure as positive before a lesion was determined to be present. 3.Experimental ResultsThreshold measurements for three spot sizes using the pulse duration are reported here. Enough data points were taken to provide the using Probit analysis with sufficiently narrow fiducial limits at the 95% confidence level. For both the 1– and postexposure readings, the are listed in Table 1 along with their fiducial limits and slopes of the Probit curves ( , where probability and dose). For the -switched pulses of , the MVL threshold was determined for one spot size of because, for the smaller beam diameters, laser-induced breakdown and plasma shielding occurred and prevented all of the pulse energy from reaching the skin. Table 2 lists the -switched at 1- and postexposure readings along with their fiducial limits. Table 1MVL-ED50 for a 0.6-ms pulse duration of 1.54-μm laser pulses.
Table 2MVL-ED50 data for 1.54-μm laser pulses at a Q -switched pulse duration of 31ns .
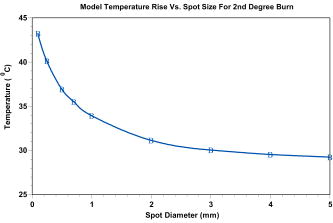
Most lesions initially appeared as a blotched red coloring near the center of the exposure square, where the laser beam penetrated the skin. These red spots appeared almost immediately and many disappeared before the reading. Exposure sites were observed after and most of the immediate lesions were no longer red splotches but very small discolorations in the skin. At the postexposure reading, more lesions could be clearly observed than were visible postexposure for the two smaller spot sizes. However, for the spot size, fewer lesions were observed at the reading and thereby producing a larger at than at the reading. For this spot size only, the threshold was lower and the fiducial limits had a reduced spread. Additional Probit runs were made for the -diam spot size when it was noticed that the probability of chi-square for the reading was a very low value of 0.0057 while the Pearson’s chi-square was a value of 208. For the 279 exposures read at , the radiant exposures ranged from and it was determined that several zeros (no visible lesions) were recorded for the high-energy exposures. A subset of data was run with all exposures of and above removed from the table, which gave the same threshold but with the chi-square increased to 0.48. This same subset of data was again revised to limit the maximum to for the top exposure, and the chi-square was again increased to 0.89 without changing the threshold of . Pearson’s chi-square was decreased from 208 to 108 for this run. The values determined for each of these sets did not vary by more than 10%, and the fiducial limits overlapped for all three conditions. These changes, when applied to the reading, did not significantly affect any parameters. Since the chi-square for the 1- and beam diameters were very close to 1.00 at the 1- and reading, they are reported as originally run with all the exposures. These results are plotted in Fig. 3 together with other referenced data. 4.Thermal ModelingOur mathematical model (Takata Thermal model) was developed10, 11 at Brooks Air Force Base (AFB), Texas, in the early 1970s. The model is currently being run on commodity personal computers running a Linux operating system, using legacy FORTRAN source codes. The Takata Thermal Model consists of three separate validated capabilities: one model for the retina, a second for the cornea, and a third model for skin. All three implement a finite-difference numerical solution of a time-dependent 2-D bioheat equation in cylindrical coordinates, following an early work by Mainster 12 on heat transfer in biological media. The result is a simulation of the temperature rise as a function of time at each point in the tissue. The models are coupled to a rate-processes damage integral [Eq. 1] to obtain an evaluation of potential damage to the tissue. The models were originally developed for the visible wavelength bands (for nonhuman primate eyes). They were later modified and validated for nonporcine skin11, 13 and nonhuman corneas through the implementation of boundary conditions appropriate for an air-tissue interface. They have since been revised and extended to include various IR wavelengths and temperature effects such as charring of tissues. Calculations using this model can be performed on all three tissue types for virtually any wavelength for which optical properties of the tissues are known. One of the most challenging issues in the use of these models for the near-IR region is the paucity of key parameters beyond (i.e., absorption and scattering coefficients). For this study, skin modeling capability was employed to estimate temperature effects along with the evaluation of temperature rise distributions and thresholds for tissue damage. Features of the model include a user-configurable multilayer tissue model. Thermomechanical as well as optical properties of the skin tissue layers are user inputs. Laser parameters are also user configurable and a geometric model of beam irradiance is employed along with linear absorption of the tissue to estimate energy deposition rates at various points within the computational grid. Boundary conditions include constant flux surface convection at the tissue-air interface. Thermal effects of variable blood flow with tissue depth are evaluated. The phase change of the water content of the tissue as well as increased absorption for charred tissues are evaluated through empirical relationships. The model does not incorporate tissue optical scattering effects. However, we estimate that for beam diameters of less than , this would be a significant effect for this short-pulse study at near-IR wavelengths. The Takata Thermal Model execution results in a time-temperature history at each point within the computational grid. Each point within the grid is evaluated for potential damage over the duration of the simulation through an Arrhenius damage integral with temperature dependent damage rate coefficients. The damage model12 we used is based on the work of Henriques14 in pig skin, and takes the form given by where is a preexponential normalization factor (in inverse seconds), is the activation energy for the reaction (cal/M), is the universal gas constant , is the locale absolute temperature (in kelvins), and is the time at final recovery of temperature after exposure. Henriques used rate coefficients for Eq. 1 such that complete necrosis of the skin was associated with , and determined that , and . The Takata Skin Model uses values that vary as a function of temperature,11 establishing multiple rates of damage. Values of and for temperature ranges of , and and for temperature ranges of . Below , the damage contribution is assumed to be zero.In the Takata (Skin Damage) Thermal Model, the damage integral is normalized against experimental data for first- through third-degree burns. For the purposes of this paper, the second-degree burn is represented by a damage integral value of and the third-degree burn by a value11 of . 5.Modeling ResultsCalculations from the Takata Thermal Model11 for skin are listed in Table 3 for minimal second-degree burns calculated for various pulse energies and spot sizes using only the long pulse . Laser exposure diameters were varied from and the laser pulse powers were varied to determine the power required to provide a minimal degree burn. Minimum temperature rises are plotted as a function of spot diameter in Fig. 4 for those values listed in Table 3 calculated for this pulse duration. The radiant exposure required to produce these temperature rises are listed in Table 3 and are plotted in Fig. 3 together with the data at listed in Table 1 and two other data points from the literature. In this figure, it can be seen how closely the Takata Skin Model computes the thresholds as measured in the laboratory for radiant exposure values with a spot diameter equal to or greater than . Table 3Takata Second-Degree Burn Model outputs for eight spot sizes using latest parameters for skin at a pulse duration of 0.6ms .
We performed the same calculations using the pulse duration for a spot diameter of using the value of power and the model predicted there would be no damage. The temperature rise calculated was only with the pulse energy and the damage level calculated to be zero. We increased the pulse power enough to give a second-degree burn for a long pulse and the required pulse energy was 5 times the threshold. At this pulse energy, the temperature rise was calculated to . This temperature rise compares well with the rise calculated for a pulse at the energy (see Table 3). 6.DiscussionIn our data presented here, three different spot sizes for a pulse duration of at with measurements are reported with a comparison to other reported measurements and to a mathematical thermal model. We also report on -switched, nanosecond pulses for a spot size of and make the same comparison with reported values. Laser-induced damage to porcine skin has been reported by Rico 15, 16 for the wavelength and a small spot size ( diameter) and they used two pig models (Yorkshire and the Yucatan mini-pigs) for their threshold measurements. They used a smaller spot size than the one used in this study because they were limited in the available pulse energies from their laser. They reported for the Yorkshire and for the Yucatan. We compare other data points with ours in Fig. 3 that indicates that there is a strong spot size dependency for exposure sites below in diameter. Rico’s threshold value was considerably larger than our values for the Yucatan mini-pig for spot sizes of 0.7 and ( for and for diameter). Similar measurements were reported by Lukashev 17, 18 but with larger spot sizes using white “Krupnaya belaya” pig skin. They report the damage threshold for a spot size of in diameter for pulse durations of at to be and a -diam beam for , giving at . Their threshold is also shown in Fig. 3 for a comparison with our spot size. For the three thresholds listed in Table 1 at the postexposure, two showed a lower threshold than at the reading. All three thresholds shown in Fig. 3 are at the reading and two of the three had a lower threshold than predicted by the Takata Model for a second-degree burn. Naturally, the third-degree burn thresholds shown in Fig. 3 would require a higher fluence than the second-degree burn and these data are included only to show relative levels. The other two data points (Rico and Lukashev) are included to indicate the range of values to be expected for large and small spot sizes. Our data agree with Lukashev’s data at the larger spot size, but not so well with Rico’s data at a smaller spot size. Since our threshold value for the spot size was so much larger than the model predictions and the fact that we were able to see flashes of light at the delivery site and sometimes hear a “pop,” we believe that breakdown was occurring at or near the surface of the skin and not all of the pulse energy was penetrating the skin. In analyzing our data, we discovered that there were several zeros or nonlesions at these very large laser pulse energies. In fact, the chi-square term in the Probit analysis was found to be 0.007, showing this distribution deviated highly from a log-normal distribution. We determined it appropriate to remove all data too far above threshold or data above a certain exposure level from the Probit analysis because of the likelihood of generation of plasma that shielded the skin from the laser energy, thereby giving a false negative reading. When we removed these data points above certain pulse energies, we raised the chi-square term to above 0.6, but the value did not change. We hypothesize that some of these pulse energies were much too large for the spot diameter being used and that this energy was probably creating plasma at the skin surface instead of propagating into the skin where it could contribute to the creation of a lesion. Thus, some of the pulse energy could have been absorbed before the pulse reached the surface of the skin and this would have required a higher energy pulse to cause a visible lesion. To date, we have found no other reason for such a large deviation between model thresholds and the values for spot diameters below . We note that the chi-square distribution calculated for the spot diameter was 1.00, and flashes of light normally associated with laser-induced breakdown (LIB) production were not observed at this spot diameter. We again hypothesize that the threshold reported by Rico, 16 also had LIBs and plasmas generated due to its very high threshold and conclude that more data points below in diameter should help to clarify this ambiguity. Our thermal model predicts a temperature rise due to energy deposition within the tissue throughout a volume as defined by the input parameters. In the Takata Skin Model, this prediction of temperature rise is based on power input where the model computes a time step increase throughout the energy deposition (laser pulse duration) and for as long afterward as necessary to return the temperature back to preexposure levels. We note that this spot-size dependency is greater for spot sizes less than in diameter as seen in Figs. 3 and 4. Above a spot diameter, the Takata Skin Model temperature rises have been correlated with damage levels as a validation of the thermal model, while below , no correlation is yet possible. For the Takata Skin Model, Fig. 3 shows the data of power and spot size in terms of the radiant exposure in joules per square centimeter necessary to produce the minimal observable second-degree burn injury on the area of the exposure. For spot sizes greater than in diameter, there is very little dependence on the area and the threshold irradiance remains essentially constant. In contrast to actual below , the Takata values show a slight dependence on laser spot size. The interdependence of time and temperature is critical with any rate-process model. Therefore this dependence on the time-temperature history and not on temperature rise alone must be worked out for laser spot input diameters less than . For the nanosecond pulses, the thresholds given in Table 2 are very nearly the same as for the pulses at the same spot diameters. It was not anticipated that they would be the same, but considering the results of Lukashev for the white pig, the results are not that different. They reported a threshold of for the pulse as compared to the for the millisecond pulses. Their spot size was only half the size of our diameter and this, as well as the differences in pigskins, may have contributed to the lower threshold. When we tried to use smaller spot sizes, there was breakdown at the skin surface and plasma shielding, giving a flash of light and a loud “pop” sound. Even at the beam diameter, with pulse energies more than twice the , some pulses produced breakdown. After two weeks, most of the superthreshold lesions were still visible on the skin. Figure 5 shows some of these lesions for different energy levels from barely visible to large brown spots. The large black spot near the center of the photo is the remains of the biopsy sample that shows the healing process. At this time histology studies are ongoing in a larger study and will not be reported in this work. When we computed the temperature change using the thermal model, the increase in temperature was only ; not nearly enough to give the thermal damage predicted by the rate equation used in the model. This appears to be reasonable when one considers that the energy delivered to the tissue is defined as power multiplied by time, and as the time becomes shorter, the power increases for like energies. The small temperature increase observed in the model was related to very high peak powers found in nanosecond pulses, as compared to longer pulse durations such as microsecond pulses. In the nanosecond time regime, it is possible that steam bubbles can be generated at the surface of the skin, and thereby reduce the energy penetrating the skin to cause damage. We recognize that our model does not predict a sufficient temperature rise to cause injury at the experimentally measure threshold. It is obvious that a pure heat transfer model may not be sufficient to accurately predict damage thresholds when an ionization (plasma formation), ablation, or microcavitation event occurs within the tissue as the threshold damage mechanism. Further work will be required to incorporate all physical mechanisms into a combined physical model. Thus, we believe that the damage observed was caused by acoustic or shock waves rather than thermal denaturation. It is interesting to note that we calculated the temperature rise for the same pigskin using pulses at and found similar results, only a few degrees temperature rise and zero damage for the pulse energies at that wavelength. Lukashev calculated a temperature rise of for nanosecond pulses and for millisecond pulses at their values, comparing favorably with our temperature calculations. They used an absorption coefficient of , while we used in our model.16 We can also compare the preceding thresholds with those measured for ablation using nanosecond laser pulses at other wavelengths. Hu 19 studied the ablation thresholds for different wavelengths from for pulses and reported that the thresholds varied from at at . These values were for the thresholds and the closest wavelength to our was . They reported using an absorption coefficient for white domestic pigskin of compared to our value of of for the Yucatan mini-pig. Using probability values of to compare with their thresholds, we calculated a value, which is 15 times smaller for the visible lesion , compared with the ablation threshold for a ablation depth. They focused the beam to a spot diameter of as compared to our -diam spot size. Thus, our threshold would have been much greater had we used such a small laser beam diameter. The MPE as set by ANSI for skin exposures is a constant value of for pulse durations from , and this value covers both of the pulse duration reported herein. For our larger spot sizes of diameter, we measured 7.4 and , which are both greater than the MPE. Theses values are comparable to values of 6.5 and reported by Lukashev for the millisecond and nanosecond pulse durations, respectively. 7.ConclusionsWe reported data that may be included in the databank for skin threshold measurements and these data are compared with the ANSI Z136.1-2000 standard for skin MPEs at and other reported skin measurements. We also compare these to thermal damage model calculations for second-degree burns to the skin for laser spot sizes from in diameter. We used the standard finite-difference thermal model of heat conduction (Takata) coupled with Henriques’s rate process model of thermal damage. With this model, we can determine the maximum temperature reached during and after the laser pulse for pulses longer than nanoseconds, temperature distribution throughout the tissue and the damage levels reached within tissue. The “American National Standard for Safe Use of Lasers” (ANSI-Z136.1, 2000) gives the skin MPE for the far-IR wavelengths as for pulse durations of . For spot sizes less than in diameter, our for the Yucatan mini-pig skin was 20 times the MPE and for the diameter, it was still 8 times the MPE. For spot sizes greater than , our data show that the threshold was still 7.4 times the MPE, and this compares favorably with the other reported data point for a spot of by Lukashev For the nanosecond pulses, our MVL threshold was 6 times the MPE and it was 15 times below the reported ablation thresholds (Hu) for near-IR wavelengths. Thus, we conclude that the MPE as set by ANSI is below all of our measurements and probably does not require revision unless new and different data are reported. ReferencesD. J. Lund,
M. B. Landers,
G. H. Bresnick,
J. O. Powell,
J. E. Chester, and
C. Carver,
“Ocular hazards of the -switched erbium laser,”
Invest. Ophthalmol., 9 463
–470
(1970). 0020-9988 Google Scholar
B. E. Stuck,
D. J. Lund, and
E. S. Beatrice,
“Ocular effects of holmium and erbium laser radiation,”
Health Phys., 40 835
–846
(1981). 0017-9078 Google Scholar
N. Fournier,
S. Dahan,
G. Barneon,
S. Diridollou,
J. M. Lagarde,
Y. Gall, and
S. Mordon,
“Nonablative remodeling: clinical, histologic, ultrasound imaging, and profilometric evaluation of a 1540 nm Er:glass laser,”
Dermatol. Surg., 27
(9), 799
–806
(2001). 1076-0512 Google Scholar
N. Fournier,
“Removing benign tumors of the skin with an Er:Glass 1540,”
http://www.futuremedical.net/tumors.pdf Google Scholar
(ANSI Z136.1), American National Safety Standard for Safe Use of Lasers, Google Scholar
W. J. Marshall,
R. C. Aldrich, and
S. A. Zimmerman,
“Laser hazard evaluation method for middle infrared laser systems,”
J. Laser Appl., 8
(4), 211
–216
(1996). 1042-346X Google Scholar
D. J. Finney, Probit Analysis, Cambridge Univ. Press, London
(1971). Google Scholar
T. A. Eggleston,
W. P. Roach,
M. A. Mitchell,
K. Smith,
D. Oler, and
T. E. Johnson,
“Comparison of two porcine (Sus scrofa domestica) skin models for in vivo near-infrared laser exposure,”
Compar. Med., 50
(4), 391
–397
(2000) Google Scholar
, Federal Animal Welfare Act and Guide for the Care and Use of Laboratory Animals, 1996 Google Scholar
A. N. Takata,
L. Goldfinch,
J. K. Hinds,
L. P. Kuan,
N. Thomopoulis, and
A. Weigandt,
“Thermal model of laser-induced eye damage,”
(1974) Google Scholar
A. N. Takata,
L. Zaneveld, and
W. Richter,
“Laser-induced thermal damage of skin,”
(1977) Google Scholar
M. A. Mainster,
T. J. White, and
R. G. Allen,
“Spectral dependence of retinal damage produced by intense light sources,”
J. Opt. Soc. Am., 60
(6), 848
–855
(1970). 0030-3941 Google Scholar
A. J. Welch,
L. A. Priebe,
L. D. Forster,
R. Gilbert,
C. Lee, and
P. Drake,
“Experimental validation of thermal retinal models of damage from laser radiation,”
(1978) Google Scholar
F. F. Henriques,
“Studies of thermal injury,”
Arch. Pathol. Lab Med., 43 489
(1947). 0003-9985 Google Scholar
P. J. Rico,
M. A. Mitchell,
T. E. Johnson, and
W. P. Roach,
“ determination and histological characterization of porcine dermal lesions produced by laser radiation pulses,”
Proc. SPIE, 3907 476
–483
(2000). 0277-786X Google Scholar
P. J. Rico,
T. E. Johnson,
M. A. Mitchell,
B. H. Saladino, and
W. P. Roach,
“Median effective dose determination and histologic characterization of porcine (Sus serofa domestica) dermal lesions induced by laser radiation pulses,”
Compar. Med., 50
(6), 633
–638
(2000) Google Scholar
A. V. Lukashev,
S. E. Solovyev,
D. I. Denker,
V. V. Engovatov, and
P. P. Pashinin,
“Investigation of laser damage on skin by Er-glass laser,”
(1995) Google Scholar
A. V. Lukashev,
B. I. Denker,
P. P. Pashinin, and
S. E. Solovyev,
“Laser damage of skin by Er-glass laser radiation. Impact to laser safety standards,”
Proc. SPIE, 2965 22
–32
(1996). 0277-786X Google Scholar
X. H. Hu,
O. Fang,
M. J. Cariveau,
X. Pan, and
G. W. Kalmus,
“Mechanism study of porcine skin ablation by nanosecond laser pulses at 1064, 532, 266, and ,”
IEEE J. Quantum Electron., 37
(3), 322
–328
(2001). 0018-9197 Google Scholar
|