|
|
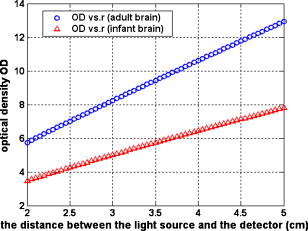
1.IntroductionDetecting tissue oxygenation by near-IR spectroscopy (NIRS) was first brought out by Jöbsis1 in 1977 and it is now an important branch in tissue optics. Near-IR light with a wavelength between 700 and can easily penetrate into human tissue by some centimeters.2 Because oxygenated hemoglobin and deoxygenated hemoglobin (Hb) are the main absorbers in human tissue and their absorption spectra are significantly different in the near-IR band,3 tissue oxygenation can be obtained by NIRS. In the past, most NIRS oximeters used a modified Lambert-Beer law to calculate the concentration changes of and Hb compared with their original values in human tissue,4 however these were insufficient to assess tissue oxygenation in many cases. Afterward, steady state spatially resolved spectroscopy (SRS) was brought out,5 so that regional tissue oxygen saturation could be obtained and then its oxygenation status can be assessed. Based on SRS, NIRS is more and more widely used to monitor tissue oxygenation recently. Our group developed an NIRS oximeter based on SRS algorithm,6 in which we used our previous research, to monitor blood transportation in many kinds of human tissues. Designing the oximeter sensor to achieve the optimal coupling with human tissue, and gaining the characteristic physiological parameters to assess tissue oxygenation functions were mainly discussed in Refs. 7, 8, 9, 10, 11. During cardiopulmonary bypass (CPB), venous blood is extracted from the vena cava into the artificial cardiopulmonary pump to be oxygenated and then transported into the aorta. During CPB, the heart beat stops and the cardiopulmonary functions are replaced by the artificial pump. Pathological changes such as cerebral hypoxia and ischemia may be induced by long-term CPB, so regional cerebral oxygen saturation must be monitored during the whole CPB to protect cerebral tissue against hypoxia. This problem was researched by some experts. For example, Daubeney monitored the of 18 young children (aged on average) using an INVOS 3100 oximeter (Somanetics Co. US) during CPB, and discussed the relationship between and nasal temperature.12 But they did not measure that of adults or older children, and the relationship between and perfusion rate was also not discussed. In this paper, we monitor the cerebral oxygenation, especially the of 15 patients (eight adults and seven children) during CPB using the NIRS oximeter developed by our group, which was calibrated by blood gas analysis. The relationships between and the physiological parameters such as the body temperature and the perfusion rate are mainly discussed, and the critical stages during CPB are also indicated, so that these parameters can be properly regulated according to the status of . 2.Algorithms, Instrumentation, and Calibration2.1.SRS Algorithm in Semi-Infinite Homogeneous TissueIf Hb and are the only absorbers in regional tissue, the following formula can be derived according to the definition of the absorption coefficient : where and are the concentrations of and Hb, and and are their extinction coefficients, respectively, which are constants related only to the wavelength. Using two wavelengths, regional tissue oxygen saturation can be obtained as follows:Thus, can be calculated if is obtained. Because human tissue is strongly scattering, if a narrow beam of near-IR light with constant intensity is vertically illuminated onto the surface of a semi-infinite homogeneous tissue, its average propagation trace in the tissue is curved so that the emitted light can be detected on the tissue surface at a certain distance to the incident light (Fig. 1 ). The interaction between the near-IR photons and human tissue is described by the diffusion equation,13 and Eq. 4 can be obtained by a series of deductions: Here OD is the optical density defined as , is the reduced scattering coefficient to the near-IR light, is the distance between the light source and the detector, and is a constant which is only related to the tissue refraction index . Because is generally larger than , there is in human tissue, and Eq. 5 can be derived from Eq. 4;Because tissue changes little with wavelength in the near-IR band,14 it can be considered that it is a constant, and Eq. 6 can be derived: Because Hb and are the main absorbers in the near-IR band,3 can be calculated when is obtained according to Eqs. 3, 6. 2.2.Sensor of Our NIRS OximeterThe SRS algorithm can be used to calculate cerebral , and a reflective sensor like that shown by Fig. 1 is often used. We calculated the OD of the following two strongly scattering semi-infinite homogeneous tissues by Eq. 4: (1) and and (2) and , corresponding to the optical characteristics of adult and infant cerebral gray matter at , respectively.15, 16 The refraction indices of these two tissues were both 1.4, and was continuously changed from . The curves of OD versus corresponding to the two tissues were calculated (Fig. 2 ). The linearity between OD and were both excellent and the correlation coefficients were and , respectively. If , even though their values were different from those just considered, the preceding linearity could be as excellent as Fig. 2 (here we do not individualize them). Thus, only two detectors are enough to calculate and then . Our oximeter sensor consists of a two-wavelength near-IR light source whose emitting wavelengths are 760 and , and three near-IR detectors. The distances between the light source and the three detectors are 20, 30, and , respectively. Figure 3 is a picture of the sensor. In our experiments, two of the three detectors were used when detecting cerebral . The cerebral cortex being detected is under the overlying tissues such as the scalp and the skull, whose optical characteristics are different from those of the cerebral cortex. So the distances between the light source and the two detectors being used should be properly chosen according to the thickness of the overlying tissues, which is often less than for young children and generally for adults. The propagation of a large number of photons in the human brain was simulated by a Monte Carlo algorithm17 in our previous research.18 The results indicated that for adults, the photons could penetrate through the overlying tissues into the cerebral cortex when , and the penetration depth could reach its maximum value when . For children, these were and , correspondingly. According to the preceding, the distances between the light source and the two detectors being used were chosen as 30 and for adults but 20 and for children. In addition to , the concentration changes of Hb and compared with their original values were also noninvasively monitored by our oximeter simultaneously using modified Lambert-Beer law, noted as and . Here we note as the concentration of total hemoglobin, which is . Thus can also be obtained by our NIRS oximeter. The sampling rate of our NIRS oximeter was /point. 2.3.Calibration of Our Oximeter2.3.1.Calibration protocolTo assess the accuracy of the oximeter, we made up a liquid tissue model and measured its oxygen saturation by the NIRS oximeter and a blood gas analyzer (Nova m7, Nova Co. US) simultaneously, and the results are noted as and , respectively. The tissue model consisted of of human whole blood as the absorber; intralipid 20% as the scatter; and buffer solution, which could keep the pH value of the model at about 7.35 to 7.45 and make it isotonic with blood. According to some previous reports, the absorption and scattering characteristics were near to those of human brain cortex in the near-IR band.19, 20 A brief diagram of the calibration is shown in Fig. 4 . The of the model could be increased by inflating pure oxygen, and was decreased by adding into it the solution of an inorganic reducer. When we added a certain amount of the reducer solution, the oxygen saturation decreased suddenly to a certain value and could be steady there for a maximum of about . Thus, the oxygen saturation could decrease in a stairlike fashion (Fig. 5 ). The steady time of each “platform” of the “stair” was enough for blood gas analysis. Otherwise, the reducer was completely soluble in the tissue model. 2.3.2.Assessing the influences of background substancesNote that Eq. 1 is strictly correct only when there is no absorber except and Hb. But there are absorptions by the background substances, such as water, in human tissue. The sum of the background absorptions is noted as and often unknown. Thus, the real should be as follows: To assess the influence by the background on the oximeter algorithm, we placed the sensor on the surface of the model. At each “platform” of the “stair”, was measured by our oximeter, and was obtained by blood gas analysis. The relationship between and is shown as a continuous line in Fig. 6a . Thus, there is excellent linearity between and . Ideally the result should be , as shown by the dashed line in Fig. 6a. Because the two lines are very close, the is very close to the corresponding . Thus, the algorithm is little influenced by the background absorptions. 2.3.3.Assessing the influences of overlying tissuesBecause the SRS algorithm is strictly correct only when the tissue is semi-infinite and homogeneous, but the human tissue being detected is generally multilayered, the influences of overlying tissues on the algorithm should also be assessed. Here we covered a flat piece of -thick pig fat on the surface of the model, and placed the sensor on the surface of the fat. The results indicate that the linearity between and in this case is also excellent . The calibration results with and without the overlying tissue are shown in Fig. 6b. Corresponding to the same , the difference between the with and without the overlying tissue is also slight. Especially when the range of is from 40 to 90%, this difference is less than 5%. Thus, the coupling between the sensor and the tissue being detected is proper, and the algorithm is little influenced by overlying tissues. 2.3.4.Calibration results of our oximeter by animal experimentsAccording to our previous researches, the cerebral of two piglets under hypoxia was monitored using the same type oximeter, and their jugular venous blood oxygen saturation was also detected by blood gas analyses. The results indicated that the correlation between and was good (for the first piglet, , , and ; for the second piglet, , , and ), and was21 very close to the corresponding . It is generally considered that is the weighted average of blood oxygen saturation in the venules, arterioles, and capillaries in regional cerebral tissue, and that in the venules is dominant.22 Because the venous blood from the cerebral venules perfuses first into the jugular venous and then into the superior vena cava, cerebral can be appropriately reflected by , and the results are reasonable. 3.Clinical Experiments3.1.SubjectsAll the clinical experiments were completed in the operating room of Anzhen Hospital, Beijing, China. The subjects were 15 patients (six male and nine female, from old) who underwent cardiac surgeries, all with CPB. Their basic conditions are given in Table 1 . All the experiments were consented by the surgeons and the patients. Table 1Basic conditions of all patients ( M=male , F=female ).
3.2.Main CPB ProceduresIn our research, CPB can be divided into the following three procedures:
3.3.Physiological Parameters Being MonitoredPulse oxygen saturation , body temperature, and heart rate of all the patients were detected in real time by a monitor (MP70, Philips Co.). Because the nasal cavity is near to the cerebral tissue, nasal temperature was considered as the body temperature. During CPB, the body temperature was regulated by the temperature of the arterial blood transported from the artificial pump into the aorta. Perfusion rate (in liters per minute) can be displayed on and regulated by the artificial pump; thus, the amount of the arterial blood transported into the aorta can be regulated. All the results of blood gas analyses during CPB indicated that the oxygen saturation of the arterial blood transported into the aorta was almost 100%. The absolute value of cerebral , as well as the values of , , and of all the patients was monitored by our NIRS oximeter during the whole surgery. The sensor was pasted on the forehead, lateral to the cerebral midline to avoid the sagittal sinus, and above the eyebrow at least to avoid the frontal sinus. The distances between the light source and two detectors were 30 and for patients older than (eight subjects), while they were 20 and for patients younger than (seven subjects). All the preceding parameters were generally recorded every . But during cooling, rewarming, or low-perfusion-rate stages when might obviously change, the parameters were recorded more frequently, for example, every . 3.4.Statistical MethodsThe difference of the mean values between two statuses was analyzed by a modified Student- test.23 Here is the significance level, which is generally chosen as . All the statistics for the experimental data were calculated by Matlab 6.5 (Mathworks Co.). 4.Results4.1.and Versus Body Temperature During the First CPB ProcedureDuring this procedure, the body temperature was decreased significantly and the perfusion rate was kept constant. The body temperature of 14 patients (except patient 5 because of the lack of data) were and [ , , in Fig. 7a ] at the beginning and end of this procedure, respectively, and the values were and [ , , in Fig. 7b] correspondingly. Thus, increased significantly when the body temperature was decreased. Fig. 7Statistical results before and after cooling of the 14 patients for (a) body temperature and (b) .  In addition to , the changes of cerebral of eight patients (patients 1, 2, 3, 4, 9, 10, 11, and 15) were also measured and analyzed during this procedure. Here cerebral at the beginning of this procedure was selected as its original value, so the monitored by the NIRS oximeter during cooling showed the change of during this procedure. Because both the cooling duration and extent for the patients were varied, here we only showed the changes of for one patient (patient 3) during cooling as an example (Fig. 8 ). Our statistical results indicated that compared with the beginning of cooling, cerebral of the eight patients at the end of cooling decreased for , and their body temperature was decreased by (Fig. 9 ). Thus, we can see that cerebral decreased along with cooling. 4.2.Versus Perfusion Rate During the Second CPB ProcedureFor the convenience of surgery, the perfusion rate of some patients may be decreased by the surgeons for a short period, the body temperature kept about constant at that time. Here patients 6 to 10 each underwent one of the low-perfusion-rate stages during this procedure. The and related physiological parameters are shown in Figs. 10a, 10b, 10c, 10d, 10e . Thus, decreased significantly when the perfusion rate was decreased. 4.3.Changes of During the Third CPB ProcedureThis was the rewarming procedure. During the early rewarming stage, decreased significantly in all the patients. During the late rewarming stage, the decrease trends of all stopped. Here, we specify 9 of the 15 patients (patients 4 to 6, 8 to 12, and 15). The body temperatures were at the beginning of rewarming; at the end of the early rewarming stage, which was also the beginning of the perfusion rate being increased; and at the end of rewarming [Fig. 11a ]. The values were , , and , correspondingly [Fig. 11b]. Thus the decreased significantly during the early rewarming stage ( , , ) along with the body temperature being increased, and increased significantly during the late rewarming stage ( , , ) along with the perfusion rate being increased, even though the body temperatures were increased simultaneously. 5.Discussions5.1.Necessity to Monitor Cerebral Oxygenation During CPBTo avoid functional and structural sequelae induced by cerebral hypoxia, cerebral oxygenation must be monitored during CPB, which can be properly reflected2 by and . But detecting by blood gas analysis is invasive and painful to patients, and unavailable to continuous measurement. Pulse oxygen saturation can be noninvasively monitored during cardiac surgery. But it can be detected only when the arteriole at the finger tip pulses. During CPB, the heart beat stops and the arterial pulsation is very weak, so cannot be obtained generally.18 Venous blood oxygen saturation at the entrance of the artificial pump can be monitored during CPB. But the correlation between it and is not good in many cases because the oxygen saturation of venous blood differs for different tissues, which will be specified in our future papers. Cerebral oxygenation, especially , can be monitored by NIRS, which does not rely on the arterial pulsation, during the whole CPB surgery. Thus, when the arterial pulsation is weak, especially during CPB, NIRS is almost the only available method to monitor cerebral oxygenation continuously and noninvasively. 5.2.Relationship Between and the Physiological Parameters Such as Body Temperature and Perfusion Rate During CPBTo avoid cerebral hypoxia during CPB, some physiological parameters such as body temperature and perfusion rate should be regulated according to the physiological status of patients. However, surgeons currently regulate these physiological parameters mainly according to their experience and by observing the physical phenomena of patients by eye. If can be a quantitative index to assess cerebral oxygenation, surgeons can use it as a guide to regulate the physiological parameters. Thus, the relationship between and body temperature as well as perfusion rate must be discussed. In fact, reflects the dynamic balance between cerebral oxygen supply and consumption. When the body temperature is decreased and the perfusion rate is kept constant, the cerebral oxygen metabolic rate and then the oxygen consumption obviously decreases, but the cerebral oxygen supply does not change obviously because the amount of the arterial blood transported from the artificial pump into the aorta is steady. Thus, the increases during the first CPB procedure (Fig. 7). On the contrary, decreases, as observed during the early rewarming stage (Fig. 11). When the perfusion rate is increased and the body temperature is kept constant, the amount of arterial blood transported into the aorta and thus the cerebral oxygen supply increases but the cerebral oxygen consumption does not change, so increases. On the contrary, decreases, as proved by Fig. 10. During the late rewarming stage of the third CPB procedure, the body temperature and the perfusion rate are increased simultaneously. Because of the increase trend of induced by the increase of perfusion rate, the decrease trend of by the increase of body temperature levels off. If the perfusion rate is increased greatly enough, may even increase, as proved by the nine patients in Fig. 11. According to the above, is negatively correlated with body temperature and positively with perfusion rate. And may be relatively low during the low perfusion rate stage and the early rewarming stage of CPB (see Fig. 10 and Fig. 11). Therefore these two stages are relatively critical. To avoid cerebral hypoxia, during these two stages should be greatly taken into account, and emergent treatments should be used such as decreasing the duration of the low perfusion rate stage, decreasing the body temperature to some extent when the perfusion rate is decreased, and increasing the perfusion rate as early as possible during rewarming. 5.3.Changes of Cerebral Total Hemoglobin Concentration During CoolingBesides , the changes of cerebral during cooling were also detected, which can be analyzed physiologically as follows. Here is the concentration of total hemoglobin in a unit volume of human brain. It is determined by the following two factors: the ratio of the whole blood volume in the cerebral tissue to the total volume of cerebral tissue [Fig. 12a ] and the ratio of the volume of the red blood cells to that of the preceding whole blood, termed hematocrit [HCT, Fig. 12b]. Fig. 12Physiological meaning of cerebral for (a) whole blood in cerebral tissue and (b) HCT of the whole blood.  There are currently few reports of the absolute value of cerebral , especially no such report for an adult. Even though the absolute value of cannot be measured by our NIRS oximeter, our group measured the absolute value of of healthy full-term infants using frequency-domain NIRS, and the result was24 about . In this paper, our results indicate that during the cooling procedure of CPB, cerebral decreased for ( , in Fig. 9). Thus, we can see that the decrease of during cooling is small. During CPB, the HCT of cerebral whole blood was measured using invasive jugular venous blood gas analysis. The results indicated that it was 35 to 40% before CPB. For all the patients at the beginning moment of CPB, to avoid the infarction of cerebral blood vessels, their blood was suddenly diluted and HCT suddenly decreased to 20 to 30%, mostly to about 25%. Then it was steadied at the preceding value during the whole CPB, including cooling. According to large numbers of clinical surgeries, an HCT of 20 to 30% is absolutely safe for patients during CPB. Because the HCT is steady during cooling, the preceding decrease of possibly reflects cerebral vasoconstriction. A few previous researchers indicated that cerebral blood vessels may shrink to a certain extent induced by cooling, so that the ratio of the whole blood volume in the cerebral tissue to the total volume of cerebral tissue [Fig. 12a] may decrease,25 but there is still no quantitative report that corresponds. From Fig. 9, we can see that the decrease of and then the preceding cerebral vasoconstriction induced by cooling are both small. This may be because the resistance of the cerebral blood vessels may be decreased by the blood dilution at the beginning moment of CPB, which may favor cerebral vasodilatation and then compensate the preceding cerebral vasoconstriction induced by cooling. During CPB besides , cerebral is also a relatively important physiological parameter. In this paper, we discuss only the changes of during cooling, and the corresponding results are also preliminary and many special topics require further researches. AcknowledgmentsWe thank Professor Britton Chance from University of Pennsylvania for his earnest help. This work was supported by the National Natural Science Foundation of China (Grant Nos. 69778024, 60578004). ReferencesF. F. Jöbsis,
“Noninvasive infrared monitoring of cerebral and myocardial oxygen sufficiency and circulatory parameters,”
Science, 198 1264
–1267
(1977). 0036-8075 Google Scholar
D. T. Delpy,
M. Cope,
P. van der Zee,
S. R. Arridge,
S. Wray, and
J. S. Wyatt,
“Estimation of optical pathlength through tissue from direct time of flight measurements,”
Phys. Med. Biol., 33 1433
–1442
(1988). https://doi.org/10.1088/0031-9155/33/12/008 0031-9155 Google Scholar
B. Chance,
M. Cope,
E. Gratton,
N. Ramanujam, and
B. Tromberg,
“Phase measurement of light absorption and scatter in human tissue,”
Rev. Sci. Instrum., 69
(10), 3457
–3481
(1998). https://doi.org/10.1063/1.1149123 0034-6748 Google Scholar
T. Shiga,
K. Tanabe,
Y. Nakase,
T. Shida, and
B. Chance,
“Development of a portable tissue oximeter using near infrared spectroscopy,”
Med. Biol. Eng. Comput., 33 622
–626
(1995). 0140-0118 Google Scholar
T. J. Farrell and
M. S. Patterson,
“A diffusion theory model of spatially resolved, steady-state diffuse reflectance for the noninvasive determination of tissue optical properties in vivo,”
Med. Phys., 19
(4), 879
–888
(1992). https://doi.org/10.1118/1.596777 0094-2405 Google Scholar
L. Huang,
F. H. Tian,
H. S. Ding,
G. Z. Wang, and
Y. C. Teng,
“The study of methods for measuring tissue oxygenation by using NIRS,”
Int. J. Infrared Millim. Waves, 22
(5), 379
–383
(2003). 0195-9271 Google Scholar
H. S. Ding,
G. Z. Wang,
W. Li,
R. Wang,
L. Huang,
Q. Xia, and
J. Wu,
“Non-invasive quantitative assessment of oxidative metabolism in quadriceps muscles by near infrared spectroscopy,”
Br. J. Sports Med., 35 441
–444
(2001). 0306-3674 Google Scholar
F. H. Tian,
H. S. Ding,
Z. G. Cai,
G. Z. Wang, and
F. Y. Zhao,
“Assessment of blood and oxygen delivery to flaps of rhesus using near infrared steady-state spectroscopy,”
Chin. Sci. Bull., 47
(21), 1797
–1802
(2002). 1001-6538 Google Scholar
L. Huang,
H. S. Ding,
X. L. Hou,
C. L. Zhou,
G. Z. Wang, and
F. H. Tian,
“Assessment of the hypoxic-ischemic encephalopathy in neonates using non-invasive near-infrared spectroscopy,”
Physiol. Meas, 25 749
–761
(2004). 0967-3334 Google Scholar
F. Wang,
H. S. Ding,
F. H. Tian,
J. Zhao,
Q. Xia, and
F. H. Tian,
“Influence of overlying tissue and probe geometry on the sensitivity of a near-infrared tissue oximeter,”
Physiol. Meas, 22 201
–208
(2001). 0967-3334 Google Scholar
Y. C. Teng,
H. S. Ding,
F. H. Tian, and
L. Huang,
“Measuring human tissue oxygenation with near infrared spectroscopy,”
847
–851
(2004). Google Scholar
P. E. F. Daubeney,
D. C. Smith,
S. N. Pilkington,
R. K. Lamb,
J. L. Monro,
V. T. Tsang,
S. A. Livesey, and
S. A. Webber,
“Cerebral oxygenation during pediatric cardiac surgery: identification of vulnerable periods using near infrared spectroscopy,”
Eur. J. Cardiothorac Surg., 13 370
–377
(1998). 1010-7940 Google Scholar
I. Akira,
“Diffusion of light in turbid material,”
Appl. Opt., 28
(12), 2210
–2215
(1989). 0003-6935 Google Scholar
S. J. Matcher,
P. Kirkpatrick,
K. Nahid,
M. Cope, and
D. T. Delpy,
“Absolute quantification methods in tissue near infrared spectroscopy,”
Proc. SPIE, 2389 486
–495
(1995). 0277-786X Google Scholar
E. Okada,
M. Firbank,
M. Schweiger,
S. R. Arridge,
M. Cope, and
D. T. Delpy,
“Theoretical and experimental investigation of near-infrared light-propagation in a model of the adult head,”
Appl. Opt., 36 21
–31
(1997). https://doi.org/10.1007/s002459900053 0003-6935 Google Scholar
Y. Fukui,
Y. Ajichi, and
E. Okada,
“Monte Carlo prediction of near infrared spectroscopy light propagation in realistic adult and neonatal head models,”
Appl. Opt., 42
(16), 2881
–2887
(2003). 0003-6935 Google Scholar
L. Wang,
S. L. Jacques, and
L. Zheng,
“MCML—Monte Carlo modeling of light transport in multi-layered tissues,”
Comput. Methods Programs Biomed., 47 131
–146
(1995). https://doi.org/10.1016/0169-2607(95)01640-F 0169-2607 Google Scholar
Y. C. Teng,
H. S. Ding,
L. Huang,
Q. C. Gong,
Z. S. Jia, and
Z. Q. Bai,
“Monitoring cerebral oxygen saturation of patients under cardiopulmonary bypass (CPB) using near infrared spectroscopy (NIRS),”
Med. Eng. Phys., Google Scholar
L. Huang,
“Study and application of absolute detection methods on tissue oxygenation by using near infrared spectroscopy,”
53
–60 Tsinghua University,
(2004). Google Scholar
H. J. van Staveren,
C. J. M. Moes,
J. van Harte,
S. A. Prahl, and
M. J. C. van Gemert,
“Light scattering in intralipid-10% in the wavelength range of ,”
Appl. Opt., 30
(31), 4507
–4514
(1991). 0003-6935 Google Scholar
H. S. Ding,
L. Huang,
C. C. Jen,
B. T. Hwang,
Z. G. Lee,
Y. C. Teng, and
M. Z. Zheng,
“Noninvasive measurement of the absolute values of tissue oxygenation saturation using NIRS and its application,”
Proc. SPIE, 5630 244
–252
(2004). 0277-786X Google Scholar
G. Mchedlishvili, Arterial Behavior and Blood Circulation in the Brain, 42
–95 Plenum Press, New York
(1986). Google Scholar
W. S. George and
G. C. William, Statistical Methods, 96 Iowa State University Press, Ames
(1980). Google Scholar
J. Zhao,
H. S. Ding,
X. L. Hou,
C. L. Zhou, and
B. Chance,
“In vivo determination of the optical properties of infant brain using frequency-domain near-infrared spectroscopy,”
J. Biomed. Opt., 10
(2), 024028
(2005). https://doi.org/10.1117/1.1891345 1083-3668 Google Scholar
A. J. McCleary,
S. Gower,
J. P. McGoldrick,
J. Berridge, and
M. J. Gough,
“Does hypothermia prevent cerebral ischemia during cardiopulmonary bypass?,”
Cardiovasc. Surg., 7
(4), 425
–431
(1999). 0967-2109 Google Scholar
|