
|
|
1.IntroductionFor diagnostic applications of light in medicine it is important to have correct quantitative models for the description of the light propagation in biological media. It is generally agreed that the transport equation is a valid model for describing the light propagation in turbid media such as biological tissue. The optical parameters involved in the transport equation are, besides the refractive index , the absorption and scattering coefficients and , respectively, and the phase func tion1 . In the past 2 decades considerable efforts have been made to measure the scattering and absorption coefficients of biological tissue, whereas the determination of the phase function has attracted less attention. In the literature, it was often assumed a priori that the Henyey-Greenstein function2 accurately describes the light scattering in tissue. However, recently it was shown that the correct form of the phase function is important for a variety of applications. For example, the spatially resolved reflectance at small distances from the incident beam depends strongly on the actual phase function. This means that the form of the phase function has an important influence on the determination of the optical properties of biological tissue with this method.3, 4 Goniometers are used to measure the phase function of scattering particles and scattering media. In the field of biomedical optics, several goniometric measurements have been described. 5, 6, 7, 8, 9, 10, 11, 12, 13, 14, 15, 16 These setups were one-axis goniometers, which means the phase function was measured solely in one plane. Usually it was assumed that the phase function is rotationally symmetric, so that the whole phase function can be calculated from the measurement in one plane. However, this is true only for tissue with randomly aligned scatterers. Instead, many tissues are structured and consist of fibrous or cylindrical scatterers, for which the assumption of a rotationally symmetric phase function is not valid.17, 18, 19, 20, 21 Note that for an arbitrarily scattering particle or for structured tissue the phase function depends not only on the scattering angle , but on the scattering direction and on the incident direction of the light. The scattering angle is defined as the angle between the incident direction and the scattering direction, and and are the elevation and azimuthal angles, respectively. For biomedical tissue, the full -dependent phase function, which requires an additional degree of freedom in the experimental setup, has not been measured to our best knowledge. Based on the geometrical symmetry of the scattering particle, several qualitative scattering patterns can be classified. For spherical particles, the phase function has a rotational symmetry about the unpolarized incident beam and is independent of the target orientation. Therefore, the phase function can be parametrized by a single variable, the scattering angle . In case of scattering particles with axial-rotational symmetry (rotational solids like biological fibers, red blood cells, dentin tubules, enamel prisms, etc.) the phase function can be parametrized by the scattering direction and the tilt angle between the incident beam and the rotational axis of the scattering particle. In the general case, when a sample has no symmetry (e.g., biological cells with internal structure), the phase function depends, in addition, on each orientation of the sample relative to the incident beam. In this paper, we describe the design of a two-axis goniometric setup for the measurement of the phase function of biological tissue. To evaluate the experimental setup, measurements on scatterers that have well-characterized phase functions were performed. For that purpose we introduce a new scattering probe, E-glass cylinders, whose phase function can be exactly calculated analytically and resembles that of the cylindrical scatterers in tissue. These probes are used to evaluate the measurements in the whole solid angle as well as the angular resolution of the experimental system. Finally, we turn to real biological samples and investigate the phase function of human dentin. 2.Materials and Measurements2.1.Experimental SetupSeveral goniometer setups are described in the literature. Those involving cameras as detection systems13, 22 have a limited solid angle of detection and a small dynamic range, but work with short acquisition times. To increase solid angle and dynamic range, mechanical scanning setups are used, at the price of increased acquisition times. 8, 9, 10, 11, 12, 13, 14, 15 These systems mechanically scan the detector around one axis. In this study, a two-axis goniometer was designed to measure the phase function with its full elevation and azimuthal angle dependence at high angular resolution combined with a high-dynamic-range detection system. The mechanical design (see Fig. 1 ) enables the detector fiber to scan the full surface of a sphere, while the sample is positioned in the sphere’s origin. The scanning unit was designed such that the sample and the detection fiber can be lowered into a tank for index-matching purposes. The tank walls were covered with black cloth to absorb scattered light and minimize stray light. Alignment of the probe and the laser to the goniometer arm is critical and can lead to asymmetric artifacts of the measured scattering pattern. Fig. 1Design of the goniometric system. The mechanical part has two axes of freedom to scan the detector fiber on the whole scattering sphere ( , ). The direction of the incident laser beam is , .  The mechanical movement was operated by two stepper motors (TECO, S0302) with a belt transmission for the axis (3072 steps/rev., ) and a cogwheel transmission for the axis (1600 steps/rev., ) in half-step mode. The radial distance between sample and fiber can be varied between 1 and , so that a fiber covers an opening angle between 3.4 and 0.34 deg. Due to the mechanical movement, the measuring speed is about 8 data points/s. The shortening of the circumference of the latitude toward the poles decreases the required number of data points with increasing latitude. Still, there are about 1 600 000 data points at the highest angular resolution, which takes about to acquire. The arm of the detection fiber is able to scan the full solid angle. But when the arm is close to the backward direction, it shields the incident beam. So there is a blind zone of about around the backward direction, at a radial distance, that cannot be measured. The light source was a five-color polarized helium-neon laser (Laser2000, LSTP-1010). For the detection a black-coated fiber was used to guide the light either onto a photodiode (Hamamatsu, S2386-18L) or a photomultiplier (Hamamatsu, H5700-02). The photodiode was used for a relative high scattered intensity, whereas the photomultiplier was applied when the scattered intensity was low. In this study, no polarizer was used in front of the detector fiber. To evaluate the photodiode currents, whose dynamic range spans more than 8 orders of magnitude (10 pA to 3 mA), a monolithic logarithmic amplifier (Texas Instruments, LOG101) was used. The transfer function of the logarithmic amplifier is The reference current was obtained from the incident beam using a beamsplitter and a second photodiode (see Fig. 1). The voltage output of the logarithmic amplifier was digitized by a digital multimeter (Yokogawa, 7552) and read via general purpose interface bus (GPIB) by a PC. The output voltage of the logarithmic amplifier covers 7.5 orders of magnitude of light intensity with an error of about .The photomultiplier was coupled via a preamplifier (Stanford Research Systems, SR440) to a single-photon counter (Stanford Research Systems, SR400). The dynamic range of the single-photon-counting system is about six orders of magnitude, while the sensitivity is considerably enhanced compared to the photodiode. Both detector systems were validated with neutral density filters and their combination provides 12 orders of magnitude dynamic range (240 dB or 40-bit resolution). Since single scatterers have small cross sections, most of the incident light passes the sample unscattered. Due to the geometrical overlap of laser beam and detection fiber, unscattered light will be detected up to scattering angles of . In theory, it should be possible to remove the incident beam via subtraction of a background measurement. In practice, due to mechanical tolerances, we found that this is not a reliable method. 2.2.Sample PreparationFor the measurements on the polystyrene spheres, a drop of a diluted emulsion of spheres having a diameter of was dried on a coverslip. The spheres remained attached to the surface even when a drop of water was added again later. Then, a second coverslip, fastened by a thin double-adhesive tape, capped the spheres for protection. For the goniometric experiment an area was chosen with the aid of a microscope, where the spheres were not aggregated and the surface density was so low that about three spheres remained within the laser spot. The index-matching tank was filled with distilled water. The cylinder phantoms are glass cylinders (E-glass, specimen EC 12 60tex, Institut für Polymerforschung, Dresden, Germany) of various radii with a refractive index of . Besides the advantage that the cylinders are easier to handle mechanically compared to polystyrene spheres, they also illustrate the importance of measuring the full scattering pattern as it is not rotationally symmetric. Dentin is a bonelike material forming the main mass of the tooth. It has a channel system, the tubules, which proceed from the dentin-enamel-junction (DEJ) to the dentin-pulp-junction in S-shaped curves. Figure 2 shows three microscopic images along the tubules’ route of a dentin slab having a thickness of . At the DEJ the tubules are relatively thin (radius: ) and far apart (mean distance ). About half way to the pulp, the tubules’ radius increases and their mean distance decreases . At the dentin-pulp-junction the tubules are relatively thick (radius: ) and close together . Fig. 2Schematic image of a tooth. The shape and arrangement of dentinal tubules are documented with three microscopic pictures on the right hand side. Experiments are carried out as depicted in the central region of the tooth between the pulp and DEJ.  Extracted human molars were embedded in cold-curing resin (SpeziFix20) and about slabs were cut using a diamond saw. The slabs were thinned to the desired thickness using silicon-carbide grinding papers of decreasing grit sizes . Finally, the surfaces were polished with diamond suspensions. The slabs were stored in a NaCl solution. Fried 9 pointed out the importance of index matching the samples in goniometric experiments because surface scattering can significantly contribute to the measured signal. In our setup, we found that using glycerine instead of water did not significantly affect the results for the measurements of dentin slabs . We conclude that the surface scattering is negligible for our samples due to the careful grinding and polishing. 3.ResultsThe goniometric setup was evaluated with samples, whose phase function is analytically known. First, we measured the phase function of polystyrene spheres having a diameter of . Second, we introduced a new scattering probe, E-glass cylinders. For cylinders, the scattering pattern is not rotationally symmetric and has a conelike shape. We present goniometer data from perpendicularly and obliquely illuminated single cylinders. Further, a “double-slit experiment” using two parallel cylinders was carried out. Profiles taken from the scattering pattern are scaled with respect to theoretical curves. These theoretical data are obtained from electromagnetic scattering solutions for light that is perpendicularly incident23 and obliquely incident24 onto one cylinder and that is perpendicularly incident onto two cylinders.25 3.1.Scattering by Polystyrene SpheresThe goniometer data of the scattering by polystyrene spheres are shown in Fig. 3 in a 3-D representation with a logarith mic colored intensity scale. The goniometer data are in complete for scattering angles in the , sector, where the detector arm blocks the incident laser. Due to the small cross section of a single polystyrene sphere, the detected intensity of the scattering pattern is about 8 to 12 orders of magnitude lower than the incident laser intensity. Fig. 3Scattering pattern from polystyrene spheres with a diameter of diluted in water using a HeNe laser. The display of the scattered light is logarithmically scaled. Only a part of all data are shown for better visualization. 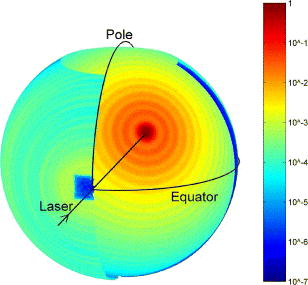 The scattering plane is defined by the unit vectors of the incident and scattered direction. The parallel and perpendicular component of the incident and scattered electric field is referenced to the scattering plane. At large distances , the scattered field can be calculated through the complex valued amplitude scattering matrix and the incident field: The phase function of linearly polarized light is proportional to the magnitude of the squared amplitude scattering matrix. In the goniometer setup, the incident beam is polarized in the equator plane. The incident beam is therefore parallel polarized with respect to the equator scattering plane. Since the amplitude scattering matrix of a sphere is diagonal, the electric fields along the equator profile are also polarized in the equator plane. The measured phase function is proportional to the parallel polarization (see Fig. 4 ).Fig. 4Scattering profiles along the pole and equator from Fig. 3. The profile along the pole corresponds to perpendicular polarization, while the profile along the equator is parallel polarized with respect to the incident beam. The curves for parallel polarized light were divided by 100 to improve their visibility.  In case of the profiles along the poles, the electric fields are still polarized in the equator plane. But now the scattering plane has changed, so that incident and scattered fields are perpendicularly polarized with respect to the pole scattering plane. The measured phase function, also shown in Fig. 4, is proportional to the perpendicular polarization . The scattering pattern is altered by several effects due to experimental conditions. There is 4% reflection of the unscattered beam at the second cuvette interface, which passes through the polystyrene spheres again. The scattered light of that backward beam changes the scattering pattern predominantly for greater than . For the quantitative comparison with theory we therefore omitted the backward region. Furthermore, the presence of the cuvette in the near field of the polystyrene spheres changes the scattering pattern in an analytically unknown way. Fresnel reflection at the cuvette interfaces also alters the intensity of the scattered light. Therefore, these experimental conditions are not ideally suited for accurate comparison with theory. Instead we use a glass cylinder, where these complications do not occur. 3.2.Scattering by a Perpendicularly Illuminated CylinderFigure 5 shows the 3-D scattering pattern of a cylinder in air illuminated perpendicularly to the cylinder axis. The reference planes for the definition of the beam polarization in the cylinder case are the incident plane, defined by the cylinder axis and the incident direction, and the scattering plane, defined by the cylinder axis and the scattered direction. The incident polarization is again in the equator plane, which is now defined as perpendicular polarized. In case of perpendicular illumination, the scattered light is confined only to the equator plane. The amplitude scattering matrix of this cylinder is also diagonal, so the electric fields are polarized in the equator plane. The phase function along the equator profile and the corresponding theoretical phase function are shown in Fig. 6 . The goniometer data agree accurately with the analytical cylinder theory.23 At a scattering angle of , the unscattered incident beam, which is more than 2 orders of magnitude stronger than the scattered intensity, is visible. The scattering profiles were used to determine the radius of the glass cylinders within a few nanometers, knowing the refractive indices of the cylinders and the surrounding medium. Experiments with cylinders in liquids were also carried out (data not shown). With these measurements, the refractive index of liquids could be determined with high accuracy. Fig. 5Scattering pattern of a cylinder with a radius of at perpendicular illumination. The display of the scattered light is logarithmically scaled. 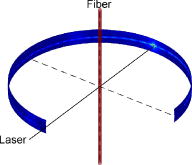 Fig. 6Quantitative comparison of the goniometric profile taken from the scattering pattern of the perpendicularly illuminated cylinder in Fig. 5 with the analytical data obtained from the scattering theory. At small angles of the experimental data, the unscattered incident beam, polarized parallel to the equator, is measured.  3.3.Scattering by an Obliquely Illuminated CylinderIf a cylinder is tilted with respect to the incident beam, the scattered light is confined to a cone, which arises from rotating the unscattered beam around the cylinder axis, as shown23 in Fig. 7 . Perpendicularly incident light, which was described in Sec. 3.2, is a special case, where the rotation of the incident beam around the cylinder axis gives the equator plane. Fig. 7Typical cone-shaped scattering pattern by a perfect infinite cylinder that is incident at with respect to the cylinder axis. The cone arises from rotation of the unscattered beam around the cylinder axis. 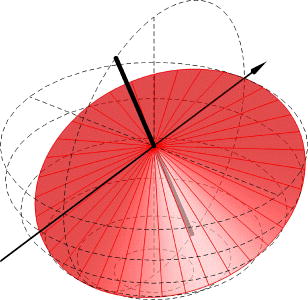 The scattering pattern of a tilted cylinder having a radius of is shown in Fig. 8 . The scattering profile along the scattering cone and the corresponding theoretical curve are shown in Fig. 9 . Again, the experimental measurements are accurately confirmed by the theory.24 As the incident light is perpendicularly polarized (in the equator plane) and there is no polarizer used in front of the detection fiber, the theoretical curve is proportional to . At about (see Fig. 8), the shadow of the fiber holder can be seen. This holder also causes the dent at in the scattering profile in Fig. 9 and was not used in the measurement shown in subsection 3.2. Fig. 8Measurement of the scattering pattern of a cylinder in air tilted at with respect to the cylinder axis. The radius of the cylinder is . The shadow of the fiber holder can be seen at . The display of the scattered light is logarithmically scaled.  Fig. 9Quantitative comparison of the goniometric profile taken from the scattering pattern of the tilted cylinder in Fig. 8 with cylinder theory.  3.4.Scattering by Two Parallel CylindersIn this subsection, we investigate the angular resolution of the goniometer. In the evaluation so far, only scattering patterns of single scatterers were discussed. Now the effect of a second scatterer is investigated. In principle, this is the well-known double-slit experiment, except that instead of slits, two parallel glass cylinders are used. The cylinders are held perpendicular to the incident beam, so that their scattered light overlaps in the equator plane and interference effects can be observed. If independent scattering is assumed, the measured phase function could be described by the multiplication of the single cylinder phase function with the double-slit interference term: where is the distance between the cylinders, and the wavelength in the medium. Instead we use the more rigorous electromagnetic solution of scattering by two perpendicularly illuminated cylinders, here called double-cylinder theory, published by Yousif and Kohler.25Figure 10 shows the goniometer data together with the double-cylinder theory at a separation of the cylinders of . The radius of both cylinders is . The goniometric data show the unscattered light at small scattering angles . As in the previous experiments, the goniometrical measurements are in good agreement with the theoretical data. Fig. 10Quantitative comparison of the goniometric profile with double-cylinder theory at a cylinder separation. The radii of both cylinders are .  For larger cylinder separations, the interference term gives rise to so rapid oscillations that the angular resolution of the goniometer was not high enough to follow them. In fact, this was the case with the polystyrene spheres (see Fig. 3). There, the large separation between the three spheres caused interference oscillations so rapidly that the goniometer could not resolve them and only the average scattering pattern of a single polystyrene sphere was measured. 3.5.Measurements on DentinDepending on the location where the dentin slabs were cut from the whole tooth, the tubules have different orientation within the slab. If the slab section is cut vertically through the tooth center, the tubules lie within the slab, otherwise they intersect with the slab’s surface. Figure 11 shows the scattering pattern of a sample with the tubules lying within the slab. The geometry of the tubules in this sample is similar to the microscope images in Fig. 2. Thus, the scattering pattern is similar to the perpendicularly illuminated cylinder in Fig. 5. Note that the scattering data in Fig. 11 (and Fig. 12 ) are presented in an equal-area projection for better quantitative comparison. Fig. 11Scattering pattern of a dentin sample with tubules perpendicularly illuminated. The data are displayed in an equal-area projection using a logarithmic scale. The thickness of the slab is .  Fig. 12Scattering pattern of a dentin sample with tubules tilted within the slab. The data are displayed in an equal-area projection using a logarithmic scale. The thickness of the slab is .  The scattering pattern of tubules intersecting the slab is shown in Fig. 12. The typical cone-shaped pattern of a tilted cylinder is clearly visible. At the position and is a brighter area, which arises from the reflection of the incident laser beam at the slab surface. The scattering pattern of the dentin slab shown in Fig. 2 was investigated. The slab was placed perpendicular to the laser in the tank filled with water. About 15 measurements were carried out along a line from the DEJ to the pulp in the central region of the tooth, similar to the sites of the microscope images in Fig. 2. Scattering profiles were extracted from the goniometric data. The profiles are along the pole or the equator (see Fig. 13 ). The typical oscillations obtained with Mie theory in the profiles cannot expected to be observed, because the shape of a single tubule is not perfectly cylindric and the ensemble of tubules in the measured region have a distribution of radii. Both scattering profiles are symmetric with respect to the unscattered beam. The intensity of the pole profile is about two orders of magnitude lower than that of the equator profile. There is a pronounced first-order interference peak at about in the profile along the scattering cone due to the quasi-periodic tubules arrangement. The peak position shifts in accordance with the tubules spacing (data not shown), which itself decreases from the DEJ to the pulp. The slab geometry of the tooth samples mask all scattering data in the plane perpendicular to the incident beam. Due to bending of the samples, the masking of the profiles occurs at a scattering angle of for the profiles along the scattering cone instead at . Fig. 13Profiles extracted parallel and perpendicular to the scattering plane from the dentin scattering pattern (see Fig. 11). The interpolated profiles used for the anisotropy factor calculation are also shown.  The form of the phase function is often characterized by their first Legendre moments , where is the anisotropy factor. We calculated the first three moments ( , , and ) of the 2-D scattering pattern [Eqs. 3, 5, 6] and compared them with the moments of the 1-D profiles [Eq. 4]. Before the moments can be calculated, the single tubule phase function must be reconstructed from the measured data.In Fig. 13, 15 profiles and their average are shown. Their shape is described by the multiplication of the single phase function and the interference function, similar to the double cylinder case [see Eq. 2]. The tubule positions have only a periodic order at short distances. Therefore the amplitudes of the oscillation of the interference function diminishes quickly and vanishes after the second minimum. To reconstruct the single tubuli phase function we use two models to fit the averaged profile in the angular region . Since the interference function oscillates around unity for more than one period, the fitted function is a reasonable solution to recover the single phase function without the interference effects. The first model function is the infinite cylinder, where we fixed the refractive indices of the tubule in dentin background and fitted the radius and a scaling factor. The second model is the Fraunhofer diffraction formula of a slit [Eq. 7], which is a valid approximation for small-angle scattering of optically soft particles. The slit radius and the scaling constant were fitted The fit results for the cylinder radius and the slit radius agree with real tubule dimensions. Both models result in almost identical curves in the small-angle region.In the regions around 90 and , the light is blocked, so that the measured data cannot be used. There, the reconstruction is carried out by a linear interpolation between beginning and end. The factor is not much affected because its integral contribution is small. The moments of the full scattering pattern were calculated from Fig. 11. Equation 3 was used to calculate from the full scattering pattern, whereas Eq. 4 was used for the profiles (analogously for the higher moments). Thus, the calculation from the profiles falsely assumes a rotationally symmetric scattering pattern. Table 1 shows the results for the three first moments of the three investigated phase functions. Table 1The three first moments of the phase functions for the full 2-D pattern, along (parallel profile) and perpendicular to the scattering cone (perpendicular profile) shown in Fig. 13.
Surprisingly small differences of the moments are found, although the shape of the phase functions are quite different. However, if the reduced scattering coefficient , which is the important quantity if the light propagation at large distances is considered, is calculated from the obtained factors, we find large differences. For, example, derived for the perpendicular profile is 80% larger than that derived for the parallel profile, whereas the reduced scattering coefficient calculated with the full 2-D pattern lies between these values. Thus, it is important to measure the phase function in the whole solid angle, if tissue is investigated that has an anisotropic light propagation. 4.Discussion and ConclusionsWe built a two-axis goniometric setup with which the phase function in (almost) the whole solid angle can be measured. With the goniometric setup it is possible to measure the scattered light in an intensity range of 12 orders of magnitude using a combination of two detectors. A photodiode is used for relatively high intensities, and for low intensities a photomultiplier is applied. The experimental setup was evaluated with measurements on scattering probes whose phase functions can be analytically calculated. Besides measurements on polystyrene spheres, we applied a new probe to test the scattering measurements. E-glass cylinders were used, because we found that their diameters are almost equal over distances of more than several centimeters. We compared the experimental phase functions with the analytical solutions of the scattering by an infinitely long cylinder. Three different measurements were performed. A single cylinder was illuminated perpendicularly and obliquely, and two cylinders were illuminated perpendicularly. Excellent agreement was found for all experiments. With the latter measurement the angular resolution of the setup could be checked due to the rapid oscillation caused by interference. The advantages of the E-glass cylinders compared to the polystyrene spheres are that they can be easily handled and that they are stable, whereas polystyrene spheres emersed in liquid tend to settle during the measurements. In addition, the anisotropic scattering pattern of the cylinder is especially suitable for studying the performance of a two-axis goniometer. Finally, their scattering behavior resembles that of biological tissue consisting of cylindrical scatterers (for example, dentin, enamel, muscle, tendon, or bone). The phase function of dentin slabs was measured using the goniometric setup. It was shown that the phase function has no rotational symmetry due to scattering by the cylindrical tubules. Thus, it is necessary to measure the phase function in the whole solid angle. We calculated the anisotropy factor of the phase function obtained from the data along and perpendicular to the scattering cone, and from the scattering data of the whole solid angle, and showed that the derived reduced scattering coefficients have a difference of up to 80%. Also, the full phase function is needed for the calculation of the light propagation in tissue that have anisotropic optical properties. Recently, we showed that this knowledge enables us to understand the measurements of the angularly resolved transmittance from relative thick dentin slabs18 and of the spatially resolved reflectance from semi-infinite anisotropic biological media.19 AcknowledgmentWe thank Rosemarie Plonka of the Institut für Polymerforschung Dresden, Hohe Straße 6, D-01069 Dresden, Germany, for providing the E-glass fibers. This work was partly supported by the Deutsche Forschungsgemeinschaft (DFG). ReferencesA. Ishimaru, Wave Propagation and Scattering in Random Media, Single Scattering and Transport Theory, Academic Press, New York
(1978). Google Scholar
L. G. Henyey and
J. L. Greenstein,
“Diffuse radiation in galaxy,”
Astrophys. J., 93 70
–83
(1941). https://doi.org/10.1086/144246 0004-637X Google Scholar
F. Bevilacqua and
C. Depeursinge,
“Monte Carlo study of diffuse reflectance at source-detector separations close to one transport mean free path,”
J. Opt. Soc. Am. A, 16 2935
–2945
(1999). 0740-3232 Google Scholar
A. Kienle,
F. K. Forster, and
H. Hibst,
“Influence of the phase function on determination of the optical properties of biological tissue by spatially resolved reflectance,”
Opt. Lett., 26 1571
–1573
(2001). 0146-9592 Google Scholar
S. T. Flock,
B. C. Wilson, and
M. S. Patterson,
“Total attenuation coefficients and scattering phase functions of tissues and phantom materials at ,”
Med. Phys., 14 835
–841
(1987). https://doi.org/10.1118/1.596010 0094-2405 Google Scholar
S. L. Jacques,
C. A. Alter, and
S. A. Prahl,
“Angular dependence of hene laser light scattering by human dermis,”
Lasers Life Sci., 1 309
–333
(1987). 0886-0467 Google Scholar
P. van der Zee,
M. Essenpreis, and
D. T. Delpy,
“Optical properties of brain tissue,”
Proc. SPIE, 1888 454
–465
(1993). https://doi.org/10.1117/12.154665 0277-786X Google Scholar
J. R. Zijp and
J. J. ten Bosch,
“Theoretical model for the scattering of light by dentin and comparison with measurements,”
Appl. Opt., 32 411
–415
(1993). 0003-6935 Google Scholar
D. Fried,
R. E. Glena,
J. D. B. Featherstone, and
W. Seka,
“Nature of light scattering in dental enamel and dentin at visible and near-infrared wavelengths,”
Appl. Opt., 34 1278
–1285
(1995). 0003-6935 Google Scholar
M. Hammer,
D. Schweitzer,
B. Michel,
E. Thamm, and
A. Kolb,
“Single scattering by red blood cells,”
Appl. Opt., 37 7410
–7418
(1998). 0003-6935 Google Scholar
J. R. Mourant,
J. P. Freyer,
A. H. Hielscher,
A. A. Eick,
D. Shen, and
T. M. Johnson,
“Mechanisms of light scattering from biological cells relevant to noninvasive optical-tissue diagnostics,”
Appl. Opt., 37 3586
–3592
(1998). 0003-6935 Google Scholar
R. Drezek,
A. Dunn, and
R. Richards-Kortum,
“Light scattering from cells: finite-difference time-domain simulations and goniometric measurements,”
Appl. Opt., 38 3651
–3661
(1999). 0003-6935 Google Scholar
C. Braun and
U. K. Krieger,
“Two-dimensional angular light-scattering in aqueous NaCl single aerosol particles during deliquescence and efflorescence,”
Opt. Express, 8
(6), 314
–321
(2001). 1094-4087 Google Scholar
A. Wax,
C. Yang,
V. Backman,
M. Kalashnikov,
R. Dasari, and
M. S. Feld,
“Determination of particle size by using the angular distribution of backscattered light as measured with low-coherence interferometry,”
J. Opt. Soc. Am. A, 19
(4), 737
–744
(2002). 0740-3232 Google Scholar
J. R. Mourant,
T. M. Johnson,
S. Carpenter,
A. Guerra,
T. Aida, and
J. P. Freyer,
“Polarized angular dependent spectroscopy of epithelial cells and cell nuclei to determine the size scale of scattering structure,”
J. Biomed. Opt., 7 378
–387
(2002). https://doi.org/10.1117/1.1483317 1083-3668 Google Scholar
J. D. Wilson,
C. E. Bigelow,
D. J. Calkins, and
T. H. Foster,
“Light scattering from intact cells reports oxidative-stress-induced mitochondrial swelling,”
Biophys. J., 88 2929
–2938
(2005). https://doi.org/10.1529/biophysj.104.054528 0006-3495 Google Scholar
S. Nickell,
M. Hermann,
M. Essenpreis,
T. J. Farrell,
U. Krämer, and
M. S. Patterson,
“Anisotropy of light propagation in human skin,”
Phys. Med. Biol., 45 2873
–2886
(2000). https://doi.org/10.1088/0031-9155/45/10/310 0031-9155 Google Scholar
A. Kienle,
F. K. Forster,
R. Diebolder, and
H. Hibst,
“Light propagation in dentin: influence of light propagation on anisotropy,”
Phys. Med. Biol., 48 N7
–N14
(2003). https://doi.org/10.1088/0031-9155/48/2/401 0031-9155 Google Scholar
A. Kienle,
F. K. Forster, and
R. Hibst,
“Anisotropy of light propagation in biological tissue,”
Opt. Lett., 29 2617
–2619
(2004). https://doi.org/10.1364/OL.29.002617 0146-9592 Google Scholar
A. Sviridov,
V. Chernomordik,
M. Hassan,
A. Russo,
A. Eidsath,
A. H. Smith, and
P. Gandjbakhche,
“Intensity profiles of linearly polarized light backscattered from skin and tissue-like phantoms,”
J. Biomed. Opt., 10 014012
(2005). https://doi.org/10.1117/1.1854677 1083-3668 Google Scholar
J. Heiskala,
I. Nissilä,
T. Neuvonen,
S. Järvenpää, and
E. Somersalo,
“Modeling anisotropic light propagation in a realistic model of the human head,”
Appl. Opt., 44 2049
–2057
(2005). https://doi.org/10.1364/AO.44.002049 0003-6935 Google Scholar
Y. L. Kim,
Y. Liu,
R. K. Wali,
H. K. Roy,
M. J. Goldberg,
A. K. Kromin,
K. Chen, and
V. Backman,
“Simultaneous measurement of angular and spectral properties of light scattering for characterization of tissue microarchitecture and its alteration in early precancer,”
IEEE J. Sel. Top. Quantum Electron., 9
(2), 243
–256
(2003). https://doi.org/10.1109/JSTQE.2003.814183 1077-260X Google Scholar
C. F. Bohren and
D. R. Huffman, Absorption and Scattering of Light by Small Particles, Wiley, New York
(1983). Google Scholar
H. A. Yousif and
E. Boutros,
“A fortran code for the scattering of em plane waves by an infinitely long cylinder at oblique incidence,”
Comput. Phys. Commun., 69 406
–414
(1992). 0010-4655 Google Scholar
H. A. Yousif and
S. Kohler,
“The fortran code for the scattering of em plane waves by two cylinders at normal incidence,”
Comput. Phys. Commun., 59 371
–386
(1990). 0010-4655 Google Scholar
|


