
|
|
1.IntroductionNonmelanoma skin cancers, which include basal cell and squamous cell carcinomas, are more common than all other human cancers. Statistically, every fourth Caucasian will develop at least one lesion during his or her lifetime. Most nonmelanoma skin cancers are curable by surgery if detected and treated early. However, in many cases, the contrast of the lesions is poor, which complicates tumor localization and precise excision. Clinical methods of cancer delineation involve sampling and examine only 1 to 2% of the surgical margin. For example, the “bread loaf” method uses vertical sectioning of the excised tissue and is prone to sampling errors. Mohs micrographic surgery1 is the only clinical technique that examines 100% of the margins and allows complete control of excision margins during the operation. It usually requires several stages. At the first stage of the treatment, all the visible cancer is removed, and the tissue is processed for en face frozen hematoxylin-eosin (H&E). Histological sections are inspected for the presence of tumor cells by the surgeon, who is also certified to read the histological sections. If there are still cancer cells remaining at the margins, another piece of skin is excised and examined. This procedure is repeated as many times as necessary. Mohs surgery has a success rate of 95%,2, 3 but it is used in the minority of cases, as it requires a pathology lab adjacent to the operating room and a technician to prepare the sections. It has been shown recently that real-time, noninvasive fluorescence polarization imaging may provide a means to intraoperative discrimination of tumor from the surrounding healthy tissue,4 thus improving the outcome of cancer treatments. Fluorescence polarization is a powerful technique, that is widely used in biochemical research.5 Dependence of fluorescence polarization on the average angular displacement of the fluorophore molecule, occurring between absorption and subsequent emission of a photon, has been used for quantifying protein rotation rates, investigating denaturation, and measuring internal viscosity of the membranes. However, the use of this technique has been limited so far to the analysis of the solutions with low scattering. Its use for demarcating tumor margins in thick (up to ) turbid skin specimens is novel. We have chosen antibiotics from the tetracycline family as the exogenous fluorophores for our tumor imaging studies. Since 1957, when Rall 6 had noted fluorescence in breast tumors following tetracycline therapy, multiple clinical trials have been conducted that utilized this phenomenon as an aid to diagnostics 7, 8, 9, 10 and therapy9, 11, 12 of the different tumor types. In this paper, we present the first report on the use of tetracycline fluorescence polarization for the localization of nonmelanoma skin cancers. The objective of the study was to evaluate the potential of two tetracycline derivatives, i.e., tetracycline (TCN) and demeclocycline (DMN), for the intraoperative demarcation of nonmelanoma skin cancer using the technique of fluorescence–polarization imaging, with histopathology as a gold standard. In particular, endogenous , exogenous , and mixed fluorescence polarization images of thick skin excisions were obtained before and after staining with TCN or DMN. Different types of basal cell carcinoma (BCC) and squamous cell carcinoma (SCC) skin excisions and concentrations of the antibiotics were examined. Qualitative and quantitative criteria for comparison of the images and histopathology were implemented. Using the developed criteria and fluorescence polarization imaging, cancer-affected areas in 79 lesions were mapped and compared to the corresponding frozen H&E sections processed during Mohs surgery. 2.Materials and Methods2.1.Tissue SamplesFreshly excised thick skin specimens with nonmelanoma skin cancers were obtained immediately after the Mohs micrographic surgeries performed at the Dermatologic Surgery Unit of Massachusetts General Hospital. An example digital photograph of one of the specimens is shown in Fig. 1a . Low contrast of the lesion with respect to the surrounding tissue does not allow visual demarcation of the tumor boundaries. All the experiments were conducted according to a protocol approved by the institutional review board of Massachusetts General Hospital. In total, 79 specimens with 86 tumors, including 73 BCCs and 13 SCCs were examined. The lateral size of the samples varied from 4 to , and the thickness from 0.5 to . The lateral size of the tumors was in the range from 0.35 to . Fig. 1Photograph of a sample with nonmelanoma skin cancer (nodular BCC). The lines along the left side of the sample are surgeons’ markers that enable orientation of the excision with respect to the in situ wound. (b) Close view of the imager: 1—CCD camera; 2—CCD lens; 3—illuminator with variable angle of incidence; 4—bandpass filter and linearly polarizing filter (polarizer); 5—linearly polarizing filter (analyzer); 6—skin sample with BCC.  2.2.ChemicalsDemeclocycline hydrochloride was purchased from Sigma Aldrich (Steinheim, Switzerland). Tetracycline hydrochloride was purchased from IVAX Pharmaceuticals, Inc. (Miami, Florida). Dulbecco’s phosphate buffered solution (DPBS, pH 7.4) was purchased from Mediatech, Inc. (Herndon, Virginia). 2.3.Tissue Staining and HandlingThe tissue was stained for approximately with 1 to or 0.25 to DPBS solution of TCN or DMN, respectively. To remove excess of the TCN or DMN, the specimens were briefly rinsed in DPBS. The tissue was imaged again after staining. For imaging, each sample was placed in a Petri dish on a piece of gauze soaked in DPBS and covered with a cover slip. 2.4.Fluorescence Polarization ImagingThe fluorescence polarization imaging system is presented in Fig. 1b. Imaging was performed using the equipment and in a manner similar to that described previously.13 In short, TCN and DMN fluorescence was excited by linearly polarized monochromatic light centered at with a full width at half maximum of . Co-polarized and cross-polarized fluorescence emission images, denoted as and , respectively, were captured by a 12-bit charge coupled device (CCD) camera in the wavelength range from 450 to . Two sets of images of the specimens, i.e., prior ( ; ) and following ( ; ) staining, were registered. The system provided13 a field of view of , lateral resolution of , and axial resolution of approximately 70 to . The maximal integration time on the CCD array was , and the maximal incident power density on the sample was . All experiments were performed at room temperature. 2.5.Data ProcessingEndogenous and mixed fluorescence polarization images (FPIs) were determined from the experimental co-polarized and cross-polarized fluorescence intensity images, acquired prior to and after tissue staining, using the definition of fluorescence polarization: where is the fluorescence polarization image, and are the co-polarized and cross-polarized fluorescence emission images, respectively, and , en, ee.The two experimental sets of images are: ( , )—co-polarized and cross-polarized components of endogenous fluorescence emission that were acquired prior to tissue staining, and ( , )—co-polarized and cross-polarized components of the mixed (endogenous and exogenous) fluorescence emission that were acquired after tissue staining. Net exogenous fluorescence emission cannot be measured directly. However, it can be calculated as the difference of the mixed and endogenous fluorescence emission: where , , and are the net exogenous, mixed, and endogenous fluorescence emission images, respectively. The images of the fluorescence emission intensities were calculated using the formula: , where , en.Substituting Eq. 2 into Eq. 1, we obtain the formula for calculating net exogenous fluorescence polarization: The average values of endogenous, exogenous, and mixed fluorescence polarization of cancerous and normal areas in each sample were calculated and compared. The average values of fluorescence polarization (AVFP) for cancerous and normal parts of each sample were obtained by averaging the pixel values over the entire cancer or normal areas, respectively. The contrast of a lesion with respect to the surrounding normal skin, CLN, in the mixed and exogenous FPIs, were evaluated as the difference of the average FPI value in the tumor and in the healthy skin of the respective image multiplied by 100.2.6.Comparison to HistopathologyPreparation of the horizontal histological frozen H&E section during Mohs surgery is described in detail elsewhere.14 As was discussed by Yaroslavsky, 15 the features of the last frozen section generated during surgery should closely resemble those of the FPI acquired from the remaining piece of tissue that we used for the experiments. Therefore, the accuracy of the fluorescence polarization imaging method was evaluated by comparison with frozen histopathology, processed during Mohs micrographic surgeries. H&E histological images and FPIs were evaluated and the tumor margins were outlined independently by two investigators capable of reading histopathology. The Mohs surgeon, who outlined the tumor in histology, did not have access to the FPIs. The investigator, who outlined the tumor in the FPIs, had no access to the histological slides. In practice, due to the preparation technique of the frozen section, it may be stretched or shrunk in comparison with the remaining thick piece of skin. To reduce the influence of these artifacts on the comparison of the results, we scanned each histopathological slide with the resolution of , identified four to ten pairs of common features in histology and in the corresponding FPIs, and overlaid FPIs with histopathological images by applying affine, projective, or polynomial transformations.16 These transformations are widely used for correcting artifacts of magnetic resonance imaging.17, 18 The accuracy of the transformations was checked by applying the algorithm for correcting the distorted image of the known object. We have introduced the following criteria for the comparison of FPIs to corresponding histopathology. Similarity in visual appearance or the shape of tumor-affected areas in the FPIs and histology served as the first criterion. To quantify the accuracy of the fluorescence polarization technique, the surface areas occupied by the tumor in the FPI and histological slides were processed and compared. The ratio of the cancerous areas in the FPI and histology was selected as the second criterion. We considered the agreement acceptable if the tumor area in the FPI was equal or up to 15% greater than that in histology , i.e., would correspond to complete tumor removal by image-guided surgery. The contrast of the lesion with respect to the surrounding healthy tissue in the mixed FPI was selected as the third criterion. values greater than 0.5 were considered acceptable. This threshold was chosen to guarantee that the difference of the cancerous and normal AVFP is significantly (at least 10 times) greater than the noise level. 3.Results3.1.Choice of the Imaging ModeFor each investigated sample, we have obtained both fluorescence emission and fluorescence polarization images. Out of 32 tumors stained in TCN and 54 tumors stained in DMN, fluorescence emission images could be used for tumor detection and delineation in only 4 and 11 cases, respectively. Thus, fluorescence emission does not provide an accurate tool for the detection and delineation of nonmelanoma skin tumors. Example fluorescence emission and polarization images of nodular BCC stained in aqueous solution of TCN are compared to corresponding H&E histopathology in Fig. 2 . In the fluorescence emission image [Fig. 2a], the tumor cannot be identified. In contrast, in the FPI, the cancerous area is bright, as compared to normal skin. The shape, size, and location of the tumor in the FPI correlate well with histopathology [Fig. 2c]. Fig. 2Nodular BCC. Scale (a) Fluorescence emission image, acquired after staining in aqueous solution of TCN, is presented. (b) Fluorescence polarization image, acquired after staining in aqueous solution of TCN, is presented. (c) Histological frozen H&E section. Tumor margins, as determined by Mohs surgeon, are outlined with black line.  3.2.Endogenous and Exogenous Fluorescence Polarization Observed from Nonmelanoma Skin CancerThe endogenous, mixed, and exogenous FPIs of micronodular BCC are shown in Figs. 3a, 3b, 3c , respectively. The sample was stained in aqueous solution of TCN. Bright parts correspond to the collagen fibers present in the dermis. The DMN FPI in Fig. 3b is not corrected for the endogenous fluorescence polarization. However, the tumor that displays a significantly higher level of fluorescence polarization, compared to normal skin, is much brighter than the surrounding tissue. In addition, the tumor appears as a structureless and comparatively homogeneous formation, whereas hair follicles and sebaceous glands closely resemble the appearance of the respective structures in histology. The combination of higher values of fluorescence polarization in the tumor and its characteristic morphological appearance makes discrimination of cancerous areas in the FPI possible. As a result, the tumor appears bright and can be clearly demarcated in both mixed and net exogenous FPIs. The contrast of the mixed FPI is 4.00, and the contrast of the net exogenous FPI is 3.84. The size, shape, and position of cancerous area are the same in both images and correlate well with each other and with histology, presented in Fig. 3d. The ratio in this sample is 1.02. Histograms shown in Fig. 3e demonstrate that exogenous fluorescence polarization of TCN was more than 5 times higher in tumor compared to healthy skin, whereas endogenous fluorescence polarization was higher in normal tissue. This representative case demonstrates that endogenous fluorescence polarization is much lower than exogenous and that cancerous areas in the sample can be accurately demarcated in the mixed FPI. There are no significant differences in the contrast, shape, and size of the tumors in the net exogenous and mixed FPIs. Fig. 3Nodular BCC. Scale . (a) shows endogenous fluorescence polarization image prior to tissue staining. In (b), mixed exogenous and endogenous FPI, acquired after staining in aqueous solution of TCN, is presented. (c) Demonstrates the pure exogeneous FPI of TCN that was obtained using the images shown in (a) and (b). (d) Histological frozen H&E section. Tumor margins, as determined by Mohs surgeon, are outlined with black line. (e) Average fluorescence polarization measured in normal and cancerous areas of the nodular BCC from (a), (b), and (c). Bars are standard errors. 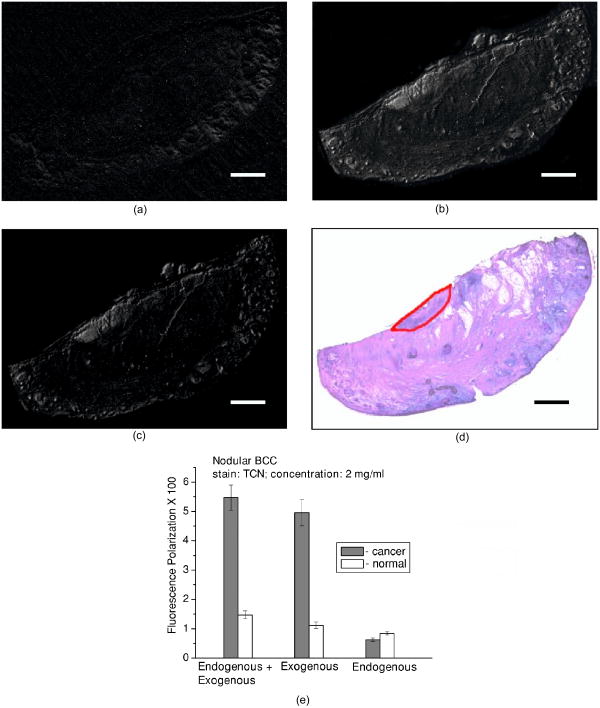 3.3.Exogenous Fluorescence Polarization Examination of Nonmelanoma Skin CancersThe potential of the fluorescence polarization imaging technique was evaluated by comparing the imaging results to histopathology of the respective tumors. To mimic the clinical conditions, in the following figures, we present and compare to histology only the mixed FPIs that were not deconvolved using previously acquired endogenous FPIs. The mixed FPIs are dominated by the signal from the exogenous tetracyclines; therefore, in the remainder of this paper, these images are referred to as exogenous FPIs. All FPIs were diagnosed independently of the histologic images. In Figs. 2, 3, 4, 5 , the images of the most common types of nonmelanoma skin cancers are presented side by side with corresponding histopathology. Fig. 4Infiltrative BCC. Scale . Comparison of (a) fluorescence polarization image (stain: aqueous solution of DMN) with (b) the last frozen histological H&E section of the same specimen. Tumor margins, as determined by Mohs surgeon, are outlined with black line. In (c), average values of fluorescence polarization in cancerous and normal tissues determined from FPI presented in (a) are shown. Bars are standard errors.  Fig. 5Invasive SCC. Scale . Comparison of (a) fluorescence polarization image (stain: aqueous solution of DMN) with (b) the last frozen histological H&E section of the same specimen. Tumor margins, as determined by Mohs surgeon, are outlined with black line. In (c), average values of fluorescence polarization in cancerous and normal tissues determined from FPI presented in (a) are shown. Bars are standard errors.  In Figs. 2b and 3b, the FPIs of the most frequently occurring type of nonmelanoma skin cancer, nodular BCCs, are shown. This prototype of BCC consists of nodular solid aggregates of tumor in the dermis, usually arising from the epidermis. Clinically, it may have a very subtle contrast with imprecise margins. The tumors presented in Figs. 2 and 3 were stained with and aqueous solutions of DMN and TCN, respectively. In both cases [Figs. 2b and 3b], the tumors have excellent contrast with respect to the surrounding tissue. The location, size, and shape of the tumors in the FPIs correlate well with corresponding histopathology. In Fig. 4, infiltrative BCC stained with aqueous solution of DMN is shown. Of all types of BCC, this kind of tumor is the most aggressive with the highest recurrence rate. Structurally, it is composed of the thin cords of tumor cells surrounded by normal skin tissues, such as collagen. As a result, it has a very weak contrast with respect to the surrounding healthy skin, both visually and in histology [see Fig. 4b]. In the FPI that is presented in Fig. 6a , the tumor is very bright, with an average value of fluorescence polarization of , whereas the AVFP of normal tissue was , which corresponds to a of 2.03 [see Fig. 4c]. Comparison of the FPI and histology indicates excellent correlation. The ratio of to in this sample is 1.05. Fig. 6Effect of DMN concentration on the contrast of cancer with respect to healthy tissue. Bars are standard errors. (b) Effect of TCN concentration on the contrast of cancer with respect to healthy tissue. Bars are standard errors.  In Fig. 5, we present an example image of invasive SCC. SCCs often exhibit an unpredictable growth pattern and a generally higher potential for metastasis as compared to BCCs. Unlike BCC, which originates from the basal cell layer, SCC originates from keratinocytes and therefore has a different morphological appearance and staining pattern. Comparison of the FPI and histology, presented in Fig. 5a and 5b, respectively, shows good correlation . The histograms given in Fig. 5c demonstrate that the values for AVFP for the SCC tumor are much higher than in the adjacent healthy skin, with the . In total, we have imaged 79 specimens with 86 tumors. Out of 86 tumors, 13 were invasive SCCs and 73 were BCCs, including nodular, micronodular, infiltrative, and superficial subtypes. This is a fair sampling, as SCCs account for approximately 20% of all nonmelanoma skin cancers. Forty-nine specimens with 54 tumors were stained using DMN. In 51 cases, the location, shape, and size of the tumors were identified correctly. One superficial BCC tumor stained in DMN solution was missed. In two cases, we have identified two false positive tumor nests in two different samples (an invasive SCC and a superficial BCC, both stained in DMN solution). Thirty specimens with 32 tumors were stained using TCN. In 28 cases, the location, shape, and size of the tumors were identified within the criteria specified in Sec. 2.6. In two cases, the location of the tumor lobules (both were nodular BCCs) were determined correctly, but the ratios of the surface areas occupied by the tumor in the FPI and histological slides, , was greater than 1.15. In one case of nodular BCC, the tumor was missed, and in one case of nodular BCC, a false positive tumor nodule was found in the FPI. 3.4.Effect of Stain Concentration on Fluorescence Polarization ImagingWe have evaluated several concentrations of the fluorophores for tissue staining. Concentrations of (7 samples), (8 samples), (14 samples), and (18 samples) were tested for DMN. The results, presented in Fig. 6a, show that the average values of DMN fluorescence polarization in the tumors are higher than in the surrounding healthy skin for all the investigated concentrations of the fluorophore. The averaged over the samples contrast of the lesions with respect to normal skin, , was found to be equal to 2.03, 2.31, 1.40, and 1.94 for the DMN concentrations of , , , and , respectively. The data were statistically analyzed using Student’s t-test for the paired populations. The differences between cancerous and normal tissues were significant for all the concentrations of the stain . For the TCN, we have used the concentrations of and only. The employed excitation wavelength centered at is in the vicinity of the absorption maximum of DMN, whereas the absorption band of TCN is shifted considerably toward the shorter wavelengths. Excitation of TCN fluorescence using wavelengths shorter than was found to be inefficient due to the lower throughput of the system in the UV and considerably higher attenuation in skin below . Comparison of the results obtained using different concentrations of TCN is presented in Fig. 6b. As in the case of DMN, the average fluorescence polarization of TCN was found to be significantly higher in cancerous as compared to normal skin for both concentrations of the fluorophore. The averaged over the samples contrast of the lesions with respect to normal surrounding tissue, , was found to be equal to 2.70 and 2.36 for the TCN concentrations of and , respectively. Statistical analysis of the data using Student’s t-test for the paired populations has shown that the differences between normal and cancerous tissues were significant for both concentrations of the stain . 4.DiscussionThis in vitro clinical study was conducted to establish the feasibility of using fluorescence polarization imaging of the antibiotics of the tetracycline family, i.e., TCN and DMN, for routine intraoperative detection and demarcation of nonmelanoma skin cancers. Our results indicate that the success rates of TCN and DMN fluorescence emission imaging are 13% and 20%, respectively, whereas fluorescence polarization imaging is successful in 88% and 94% of cases, respectively. Therefore, imaging of tetracycline fluorescence polarization is a significantly more accurate technique for nonmelanoma skin cancer detection as compared to imaging of the fluorescence emission. In addition, it enables “optical sectioning” of the thick tissues, thus allowing imaging of the superficial tissue layers only. In the multiply scattering media, such as skin, fluorescence at different depths can be monitored using polarized light. After the incident light excites fluorescence, the emitted light is elastically scattered on its way to the detector. Therefore, optical sectioning is achieved as in the case of elastic scattering, because multiple scattering randomizes the polarization state of the emitted fluorescence signal, whereas single scattering events do not alter the fluorescence polarization state significantly. In the visible spectral range, the section thickness may vary13 between and . Although the FPI optical section is much thicker than the histological frozen section, which is only thick, the resemblance of the two is remarkable (see Figs. 2, 3, 4, 5) due to the similarities in the distribution of the respective stains and the rejection of the fluorescence coming from the deep tissue layers. In this paper, we report on the experimentally observed reproducibly higher values of TCN fluorescence polarization registered from cancerous as compared to normal skin [see Fig. 6a and 6b]. There exist several possible reasons that may cause this phenomenon. In general, fluorescence polarization depends on the displacement of the fluorophore during the lifetime of the excited state.5 The diffusion coefficient of the fluorophore molecules may be affected by the change of the fluorescence lifetime, viscosity of the surrounding medium, binding of the fluorophore molecules, and temperature. Thus, if the fluorophore lifetime decreases in a cancerous environment, or the viscosity of the tumor is higher than that of the surrounding skin, or the fluorophore binds to large cell organelles that exhibit higher concentration in cancer cells, fluorescence polarization registered from cancerous tissue will be higher than that of normal. Tetracyclines have a high affinity to mitochondria,19 which are abundant in cancer cells. Binding of the antibiotic to a comparatively large organelle, such as mitochondria, constrains the mobility of the fluorophore and may result in higher values of exogenous fluorescence polarization in carcinoma cells. At the same time, changes in biochemical and optical properties of cancerous skin can also contribute to higher values of fluorescence polarization in the tumors. Further thorough investigation of the origins causing this experimentally observed phenomenon is required. Images and histograms presented in Fig. 3 show that the endogenous fluorescence polarization, excited at the wavelength of , is not negligible. In skin there exist several fluorophores, including collagen and porphyrins, that can be excited at this wavelength. Figure 3a shows that the brightest pixels in the FPI of this skin sample correspond to skin appendages, such as sebaceous glands that contain porphyrins. However, even though skin exhibits a considerable level of fluorescence polarization in all of the cases, it was at least 5 times lower than the net exogenous fluorescence polarization. Figure 3b and 3c demonstrate that the position, shape, and size of the tumor in the net exogenous fluorescence polarization images coincide with those in the mixed images. These results imply that acquiring the endogenous FPIs prior to tissue staining and consecutive deconvolution of the mixed FPIs is not required. Figures 2, 3, 4, 5 show that the contrast of the tumors is excellent. Although several healthy structures, for example, hair follicles and sebaceous glands, exhibit high levels of fluorescence polarization, their appearance is different from that of cancer. Morphological features of the fluorescence polarization images closely resemble the features of the frozen H&E sections, which are routinely processed during Mohs micrographic surgeries. Therefore, Mohs surgeons should be able to interpret them in the same way that they read histology. The use of tetracyclines, which are established and safe antibiotics, should further simplify translation of the suggested method into clinical practice. The developed fluorescence polarization technique can be used to image the in situ wound produced during the surgery, or the remaining excised tissue itself, as it was done in the present study. In general, these two approaches are equivalent and both can be implemented in clinical practice. If the approach of imaging the excised tissue in vitro is adopted, the procedure of cancer delineation can be performed exactly as described earlier. Alternatively, for both in vivo and ex vivo imaging, the antibiotic may be introduced systemically. Injection of TCN into the tumor site prior to surgery may be considered. Tetracyclines are known to accumulate in the tumors; therefore, measurable concentration levels appear to be attainable. There is a substantial body of literature that reports strong fluorescence signal registered in vivo from the tumors of the cancer patients who were taking TCN orally.6, 7, 10 In the present study, we have used the power density of incident on the sample. Optimization of the system throughput at shorter wavelengths should easily allow the detection of concentrations lower than . At the same time, there is at least a tenfold safety margin of the irradiance incident on the skin surface. A comparative in vivo versus in vitro human clinical trial is under way to estimate the optimal technique for delineating cancers reliably and accurately in a clinical setting. The results of the study show that DMN fluorescence polarization enabled accurate identification of the position, shape, and size of the tumors in 94% of cases. TCN fluorescence polarization imaging was successful in 88% of cases. In 6% of samples stained using TCN, the location of the lesions was determined correctly, but the size was overestimated as compared to histology. One of the possible reasons for the discrepancies between imaging and histology might be the irregular growth pattern of cancer, as we used the H&E slides processed during the surgeries for comparison with the images acquired from the remaining pieces of tissue. The outcome of this trial is considerably better than the results yielded by other techniques, including confocal microscopy,20 endogenous fluorescence spectroscopy,21 and exogenous fluorescence imaging of protoporphyrin IX fluorescence,22, 23, 24 which were attempted for the same purpose. The only optical technique that provides comparable results, i.e., yields 91% success rate, is multispectral dye-enhanced reflectance imaging.13 This technique relies on the absorption-based contrast of the phenothiazine dyes that preferentially stain cancerous tissue for tumor delineation. As compared to fluorescence polarization imaging of tetracylcines, it requires longer rinsing times to remove the excessive stain from the tissue and longer acquisition times to scan several wavelengths, which may be disadvantageous in the clinical setting. The two main challenges that complicate intraoperative detection and delineation of the nonmelanoma skin cancers are the lack of visual contrast of the lesion with respect to healthy skin [see Fig. 1a], and the necessity to inspect large surgical fields in real time. TCN fluorescence polarization imaging is a novel and effective approach that allows for the solving of these problems. Our trials have shown that the resolution (lateral , axial to ) provided by the described technique is acceptable. However, in the cases when higher resolution that is comparable to that of histology is required, the developed technique can be combined with confocal microscopy, as suggested by Yaroslavsky 15 This combined technique enables rapid examination of the large surfaces, as well as high resolution imaging of the cellular detail. Currently, except for the visual assessment of where to excise, cancers are removed without intraoperative margin control in the majority of cases. Introduction of exogenous fluorescence polarization method into the clinical practice has a potential to enable accurate cancer removal combined with maximal tissue preservation. In conclusion, we have developed and tested a novel technique, i.e., fluorescence polarization imaging of tetracyclines, that may be used in clinical practice for the intraoperative detection and delineation of epithelial tumors, such as nonmelanoma skin cancers. The suggested imaging technique and equipment are time-efficient, accurate, simple in implementation, and inexpensive. The use of safe and readily available contrast agents, such as TCN and DMN, warrants quick translation of the developed method to clinical practice. Due to the simplicity of the developed technique and because of the striking similarities in the appearance of the FPIs and histology, the images can be acquired and interpreted by surgeons and pathologists without any assistance. The ability of this methodology to spatially map the tumor-affected areas should be particularly useful for the intraoperative assessment of the cancer margins. We believe that further technical and clinical advances of this technique could potentially provide an in situ optical pathology tool for clinical diagnosis and image-guided treatment of epithelial cancers. ReferencesF. E. Mohs,
“Chemosurgery—a microscopically controlled method of cancer excision,”
Arch. Surg. (Chicago), 42 279
–295
(1941). 0004-0010 Google Scholar
S. J. Salasche and
R. A. Amonette,
“Morpheaform basal cell epitheliomas, a study of subclinical extension in a series of 51 cases,”
J. Dermatol. Surg. Oncol., 7 387
–394
(1981). 0148-0812 Google Scholar
D. J. Wolf and
J. A. Zitelli,
“Surgical margins for basal cell carcinoma,”
Arch. Dermatol., 123 340
–344
(1987). 0003-987X Google Scholar
A. N. Yaroslavsky,
V. Neel, and
R. R. Anderson,
“Fluoresence polarization imaging for delineating nonmelanoma skin cancers,”
Opt. Lett., 29 2010
–2012
(2004). https://doi.org/10.1364/OL.29.002010 0146-9592 Google Scholar
J. R. Lakowic, Principles of Fluorescence Spectroscopy, Plenum Press, New York (1983). Google Scholar
D. P. Rall,
T. L. Loo,
M. Lane, and
M. G. Keuex,
“Appearance and persistence of fluorescent material in tumor tissue after tetracycline administration,”
J. Natl. Cancer Inst. (1940-1978), 19 79
(1957). 0027-8874 Google Scholar
J. R. McLeary,
“The use of systemic tetracyclines and ultraviolet in cancer detection,”
Am. J. Surg., 96 415
(1958). 0002-9610 Google Scholar
B. L. Holman,
W. D. Kaplan,
M. K. Dewanjee,
C. P. Fliegel,
M. A. Davis,
A. T. Skarin,
D. S. Rosenthal, and
J. Chaffey,
“Tumor detection and localization with -tetracycline,”
Radiology, 112 147
–153
(1974). 0033-8419 Google Scholar
R. C. Davis,
P. Wood, and
M. L. Mendelsohn,
“Localization and therapeutic potential of tritiated tetracycline in rodent tumors,”
Cancer Res., 37 4539
–4545
(1977). 0008-5472 Google Scholar
N. Olmedo-Garcia and
F. Lopez-Prats,
“Tetracycline fluorescence for the preoperative localization of osteoid osteoma of the triquetrum,”
Acta Orthop. Belg., 68 306
–309
(2002). 0001-6462 Google Scholar
C. Van den Bogert,
B. H. Dontje, and
A. M. Kroon,
“Doxycycline in combination chemotherapy of a rat leukemia,”
Cancer Res., 48 6689
–6690
(1988). 0008-5472 Google Scholar
W. C. M. Duivenvoorden,
P. Vukmirovic,
S. Lhotak,
E. Seidlitz,
H. W. Hirte,
R. G. Tozer, and
G. Singh,
“Doxycycline decreases tumor burden in a bone metastasis model of human breast cancer,”
Cancer Res., 62 1588
–1591
(2002). 0008-5472 Google Scholar
A. N. Yaroslavsky,
V. Neel, and
R. R. Anderson,
“Demarcation of nonmelanoma skin cancer margins using multi-spectral polarized-light imaging,”
J. Invest. Dermatol., 121 259
–266
(2003). https://doi.org/10.1046/j.1523-1747.2003.12372.x 0022-202X Google Scholar
K. G. Gross,
H. K. Steinman, and
R. P. Rapini, Mohs Surgery: Fundamentals and Techniques, Mosby, Inc.(1999). Google Scholar
A. N. Yaroslavsky,
J. Barbosa,
V. Neel,
C. DiMarzio, and
R. R. Anderson,
“Combining multi-spectral polarized-light imaging and confocal microscopy for localization of nonmelanoma skin cancer,”
J. Biomed. Opt., 10 014011
(2005). https://doi.org/10.1117/1.1854173 1083-3668 Google Scholar
A. Jain, Fundamentals of Digital Image Processing, Prentice-Hall, NJ (1986). Google Scholar
T. Netsch and
A. van Muiswinkel,
“Quantitative evaluation of image-based distortion correction in diffusion tensor imaging,”
IEEE Trans. Med. Imaging, 23
(7), 789
–798
(2004). 0278-0062 Google Scholar
G. K. Rohde,
A. S. Barnett,
P. J. Basser,
S. Marenco, and
C. Pierpaoli,
“Comprehensive approach for correction of motion and distortion in diffusion-weighted MRI,”
Magn. Reson. Imaging, 51 103
–114
(2004). 0730-725X Google Scholar
Z. Shan,
I. Stavrovskaya,
M. Drozda,
“Minocycline inhibits cytochrome c release and delays progression of amyotic lateral sclerosis in mice,”
Nature (London), 417 74
–78
(2002). 0028-0836 Google Scholar
M. Rajadhyaksha,
G. Menaker,
P. J. Dwyer,
T. J. Flotte, and
S. González,
“Confocal examination of nonmelanoma cancers in skin excisions to potentially guide Mohs micrographic surgery without frozen histopathology,”
J. Invest. Dermatol., 117 1137
–1143
(2001). https://doi.org/10.1046/j.0022-202x.2001.01524.x 0022-202X Google Scholar
L. Brancaleon,
A. J. Durkin,
J. H. Tu,
G. Menaker,
J. D. Fallon, and
N. Kollias,
“In vivo fluorescence spectroscopy of nonmelanoma skin cancer,”
Photochem. Photobiol., 73 178
–183
(2001). https://doi.org/10.1562/0031-8655(2001)073<0178:IVFSON>2.0.CO;2 0031-8655 Google Scholar
J. Hewett,
V. Nadeau,
J. Ferguson,
H. Moselyey,
S. Ibbotson,
J. W. Allen,
W. Sibbett, and
M. Padgett,
“The application of a compact multispectral imaging system with integrated excitation source to in vivo monitoring of fluorescence during topical photodynamic therapy of superficial skin cancers,”
Photochem. Photobiol., 73 278
–282
(2001). https://doi.org/10.1562/0031-8655(2001)073<0278:TAOACM>2.0.CO;2 0031-8655 Google Scholar
A. M. Wennberg,
F. Gudmundson,
B. Stenquist,
A. Ternesten,
L. Mölne,
A. Rosén, and
O. Larkö,
“In vivo detection of basal cell carcinoma using imaging spectroscopy,”
Acta Derm Venereol, 79 54
–61
(1999). 0001-5555 Google Scholar
S. Andersson-Engels,
G. Canti,
R. Cubeddu,
“Preliminary evaluation of two fluorescence imaging methods for the detection and the delineation of basal cell carcinomas of the skin,”
Lasers Surg. Med., 26 76
–82
(2000). https://doi.org/10.1002/(SICI)1096-9101(2000)26:1<76::AID-LSM11>3.0.CO;2-4 0196-8092 Google Scholar
|


