
|
|
1.IntroductionQuantum dots (QDs) are a promising alternative to organic immunofluorescent probes for cancer detection. 1, 2, 3, 4, 5, 6, 7, 8, 9 Several characteristics distinguish QDs from commonly used fluorophores, such as broad absorption spectra, size- and composition-tunable, narrow fluorescence emission, and very high levels of brightness and photostability. 10, 11, 12, 13, 14, 15, 16 For in vivo detection, clinical values of QDs as immunofluorescent probes require them to have high sensitivity and high specificity for cancer cells.2 In one previous study, QDs were linked to immunoglobulin G (IgG) and streptavidin to label the breast cancer marker Her2 on the surface of fixed and live cancer cells, which showed that QD probes can be very effective in cellular imaging and offer substantial advantages over organic dyes.17 In another study, QDs were first used as stable fluorescent tracers for nonspecific uptake studies and lymph node mapping in living animals.1 In an important improvement, PEG-coated QDs were functionalized with antibodies to prostate-specific membrane antigen and were intravenously injected in mice for tumor targeting and imaging.2 Most recently, self-illuminating quantum dot conjugates as new probes were first used in in vivo imaging.6 However, there is no reported study of using immunofluorescent QD bioconjugates for in vivo hepatic cancer detection. In this study, we aim to examine the sensitivity and specificity of the QD probes to hepatoma in mice and achieve attractive biomedical detection. We synthesized specific immunofluorescent probes by linking QDs to alpha-fetoprotein (AFP) antibody for specific recognization of AFP—an important marker for hepatocarcinoma cell line HCCLM6 (Ref. 18). In vivo, we achieved active tumor targeting and sensitive spectroscopic hepatoma imaging with an integrated fluorescence imaging system. We also investigated the inhomogeneous distribution of the QD probes in tumor by using a site-by-site measurement method to test their ability for distribution studies of cancer cells in tumor. These results demonstrate the potential of QD probes as attractive immunofluorescent probes for cancer detection. 2.Materials and Methods2.1.MaterialsCore-shell QDs ( -capped , Ref. 15) were synthesized by College of Chemistry & Molecular Sciences, Wuhan University. Human hepatocellular carcinoma cell lines18 (HCCLM6) were provided by Liver Cancer Institute of Fudan University. EDC (1-(3-Dimethyl-aminopropyl)-3-ethylcarbodiimide hydrochloride, ) and NHS ( -hydroxysuccinimide, ) were purchased from Acros-Organics. Mouse anti-human monoclonal AFP antibody and RPMI-1640 culture medium were purchased from Sigma. 2.2.QDs Bioconjugation and Animal PreparationsWe used a solution of high-quality oil-soluble core-shell QD590 to synthesize water-soluble QDs according to a developed procedure.15 These activated dots modified with thioglycolic acid were dissolved in phosphate-buffered saline (PBS) ( , pH 7.4) containing EDC and NHS. Then, the QDs were reacted with mouse anti-human monoclonal AFP antibodies at room temperature in a shaking incubator for 2 to . The final QD bioconjugates were purified by centrifugation at for , and the suspension was dialyzed for 8 to . The QDs-Anti-AFP thus afforded were stored in refrigerator at . Using protocols approved by the Institutional Animal Care and Use Committee of Wuhan University, 6 prepared HCCLM6 cells were injected into a 6- to 8-week-old nude mouse subcutaneously. Tumor growth was monitored daily until it reached the acceptable size (0.5 to in diameter). Then, the synthesized QDs-Anti-AFP probes were injected into the tail vein at for active targeting (four times). The time interval between each injection was about . The mice were placed under anesthesia by injection of 3% Nembutal at a dosage of for in vivo studies. Some other mice bearing tumors of similar sizes (0.5 to in diameter) were prepared under the same protocols for histological examination. The same dose of QDs and QDs-Anti-AFP were injected into different mice for passive and active targeting. After a 24-h probe circulation, the mice were killed and tumors and major organs were removed and frozen. Tissue collections were cryosectioned into sections ( thick), fixed with acetone at , and examined with a confocal fluorescence microscope (Leica TCS-SP2-AOBS-MP, D-68165, Mannheim, Germany). 2.3.Fluorescence Detection and ImagingThe fluorescence imaging system is shown in Fig. 1A . The pulsed laser was provided by a Ti:sapphire laser (Mira 900, Coherent). Samples were excited at the wavelength of using an optical frequency-doubling system. The beam was focused on samples with a lens. The fluorescence over the entire emission range was collected by a liquid-nitrogen-cooled CCD-array spectrometer (ACTON, Spectrapro 2500I) along with imaging acquisition and analysis software. The following samples were prepared for fluorescence detection: (1) QDs and QDs-Anti-AFP and (2) QDs-tagged tumor tissue and normal tissue in a nude mouse [Fig. 1A]. Fig. 1(A) Simple optical layout of fluorescence imaging system: A1, optical frequency double system; A2, lens; A3, liquid-nitrogen cooled CCD-array spectrophotometer. (B) and (C) Spectroscopic imaging of (B) QDs-tagged tumor tissue and (C) normal tissue. (D) and (E) Emission spectrum of (D) QDs-tagged tumor tissue and (E) normal tissue. All the images and the spectrums were captured from a nude mouse with the same exposure time. 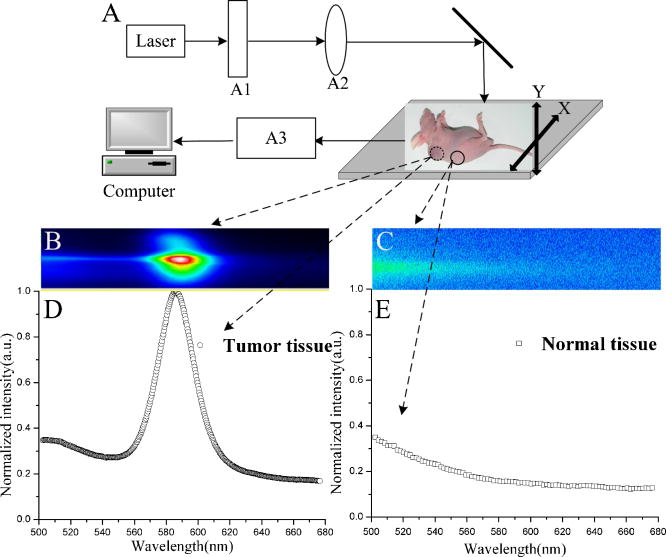 2.4.Site-by-Site Measurement for Distribution AnalysisWe selected 2500 sampling sites covering a square area from the periphery to the central area in the tumor of a nude mouse, and each side of the square consists of 50 equidistant sites. An axis translation stage was designed to shift the QD-labeled mouse automatically [Fig. 1A]. When the fluorescence emission of one site was collected, the stage was shifted along one axis to focus the laser on the next site. After 2500 continuous collections, all the recorded emission peak intensities were processed by software to form a contour map (Fig. 2 ) to indicate the fluorescence intensity distribution of the detected area. Fig. 2Fluorescence intensity contour map of a detected cancerous area in the QDs-tagged tumor. Although all the sampling sites are in the tumor, their fluorescence intensities are different: cold colors represent lower fluorescence intensity in the area, while warm colors represent higher intensity. The detected cancerous area is from the periphery (corresponding to the lower left corner in the map) to the central area (corresponding to the upper right corner in the map) of the tumor. Thus, the map exhibits the inhomogeneous distribution of the fluorescence intensities in the detected area of the tumor.  3.Results and Discussion3.1.Spectral CharacteristicThe QDs and the QDs-Anti-AFP probes have the same narrow and symmetric emission spectrums (Fig. 3 ). The corresponding emission peaks are at and half-maximum values are only . The QDs-Anti-AFP probes used in this study exhibit the same excellent spectral property as the original QDs. Note that the exposure times of QDs and QDs-Anti-AFP were different for spectral matching. 3.2.In vivo Cancer DetectionTo investigate the specific binding of QDs-Anti-AFP to hepatoma in vivo, we used QDs-Anti-AFP to target AFP for active targeting.2, 19 AFP is the main component of mammalian fetal serum, which is synthesized by visceral endoderm of yolk sac and by fetal liver cells. The alteration of AFP blood level is an important marker for hepatocellular carcinoma, so that the accumulation and retention of AFP at the site of tumor is the basis of immunofluorescence detection and targeted therapy for hepatic cancer.20 The fluorescence spectral feature of QDs-tagged tumor tissue almost fits that of the original QDs, and the quantitative spectral comparison [Figs. 1D, 1E] demonstrate that QD emission in tumor can be clearly distinguished from tissue autofluorescence. The spectroscopic imaging of the tumor tissue [Fig. 1B] exhibits strong QD fluorescence at and relatively weak tissue autofluorescence. In contrast, the spectroscopic imaging of the normal tissue [Fig. 1C] shows only autofluorescence background. These results indicate that the QDs-Anti-AFP probes have specific and attractive binding to hepatoma in vivo. Note that the QD probes in nude mice were excited with femtosecond laser pulses in our study, so that the sampling sites for spectroscopic imaging are only a part of the tumor, not the whole mouse. The use of a macroillumination system1, 2, 21 should be an adapted alternative for whole animal studies. In addition, the control study results with the same dose of nontargeted QDs and QDs-Anti-AFP are shown in Fig. 4 ( injected plus a 24-h latent period of probe circulation). Little QD accumulation was found in tumors due to passive tumor targeting, while QDs-Anti-AFP were detected by their clear characteristic fluorescence. Note that nonspecific liver and spleen uptake was apparent in organ uptake studies (image not shown), which is similar to that of QD-PSMA biconjucgates.2 Fig. 4Histological examination of QD passive and active targeting ability. The same dose of QDs and QDs-Anti-AFP ( and 24-h circulation) were injected in different mice bearing hepatoma of similar sizes (0.5 to in diameter). The images were obtained from thin tissue sections on a fluorescence microscope. Little QD accumulation was found in tumors due to passive tumor targeting, while QDs-Anti-AFP were detected by their clear characteristic fluorescence. 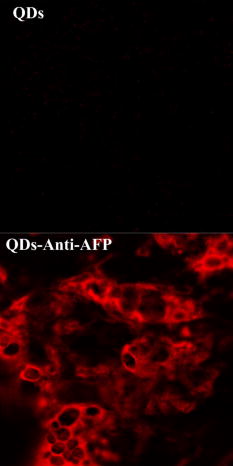 3.3.Distribution AnalysisIt has been shown that the QD probes can be targeted to tumor cells through both passive and active mechanisms (effected by cell membrane alignment along adhesive surfaces19), but passive targeting (due to permeation and retention of QDs at tumor sites 1, 2, 22, 23) is much less efficient than active targeting (Fig. 4) (due to QD-antibody binding to tumor-specific antigens2). Thus, the necrotic cancer cells lacking specific antigen are almost deprived of the ability to bind to the QD probes, and the distribution of QD probes in tumor is mainly attributed to the density of cancer cells with specific antigens for active targeting. Consequently, a fluorescence intensity contour map (Fig. 2) was plotted by using the site-by-site measurement method already discussed for distribution analysis. Different colors in the map show the inhomogeneous distribution of cancer cells (with probes) in the detected area of the tumor. Since cold colors represent a lower fluorescence intensity in the area, and lower intensity corresponds to fewer QD probes among the sampling sites, it is clear that the cancer cells per field in the central area were less than the periphery area of the tumor. Although some singular points (such as the orange and red areas in the lower right-hand corner and the upper middle region of the map) do not match the whole tendency of color changes because of the complexity of tumor’s structure, the fluorescence intensity contour map exhibit that the number of cancer cells (with probes) per field is lower inside than those outside. Note that the result does not provide an absolute intensity comparison among these sites because several factors (such as complexity of tumor’s structure and optical density of sampling sites) are difficult to normalize or calibrate. Instead, it is just a qualitative fluorescence intensity comparison, demonstrating the distribution of the cancer cells with QD probes in the tumor. Similarly, histological examinations have shown that the density of the vascular distribution in tumor is also inhomogeneous. It accumulates in the periphery and is scarce or absent in the central area, so that the process of nutrient competition causes more necrotic cells inside than outside in the tumor.24 Further, the distribution result is consistent with the universal dynamics theory of tumor growth.25 Unfortunately, the maximum shifting distance of the automatic axis translation stage in our study is only , not enough for whole tumor studies. However, this problem could be solved with improved experimental conditions. Notwithstanding this limitation, these results demonstrate the QD probes are specific and sensitive enough for distribution analysis of a tumor in vivo. 4.ConclusionsUsing QD bioconjugates as immunofluorescent probes for cancer detection is challenging. The indirect immunofluorescence method we adopt is based on the combination of AFP antibody and core-shell QD590. The synthesized QDs-Anti-AFP probes serve as secondary antibodies to combine with specific AFP (as primary antibody). The method we adopted is more convenient and practical than traditional streptavidin-biotin technique.26 The optical examinations aim to archive specific and sensitive fluorescence detection with the complex QD probes. In in vivo conditions, the QDs-Anti-AFP in a tumor exhibit the characteristic QD fluorescence, and enable active tumor targeting and spectroscopic hepatoma imaging. In contrast, the same doses of nontargeted QDs were found to have little accumulation in tumors due to passive targeting following the same length of circulation. Further, by using the site-by-site measurement method, the probes show the practicality of the investigation of cancer cell distribution in vivo in a tumor. In addition, a remaining issue is the toxicity and metabolism of QD bioconjugates in vivo, which have been discussed by other groups. 2, 27, 28, 29, 30 We expect that the bright, specific, and sensitive QD-based bioconjugates will be ideal immunofluorescent probes for multiplexed cancer detection and diagnosis. AcknowledgmentsThis work was supported by the Institutional Animal Care and Use Committee of Wuhan University. We acknowledge Junbo Han, Hongmei Gong, and Huijun Zhou for technical help, and Xianlin Zhang, and Xiaofang Wang for stimulating discussions. We are also grateful to the Liver Cancer Institute of Fudan University for providing HCCLM6 cells. ReferencesS. Kim,
Y. T. Lim,
E. G. Soltesz,
A. M. De Grand,
J. Lee,
A. Nakayama,
J. A. Parker,
T. Mihaljevic,
R. G. Laurence,
D. M. Dor,
L. H. Cohn,
M. G. Bawendi, and
J. V. Frangioni,
“Near-infrared fluorescent type II quantum dots for sentinel lymph node mapping,”
Nat. Biotechnol., 22 93
–97
(2004). https://doi.org/10.1038/nbt920 1087-0156 Google Scholar
X. Gao,
Y. Cui,
R. M. Levenson,
L. W. Chung, and
S. Nie,
“In vivo cancer targeting and imaging with semiconductor quantum dots,”
Nat. Biotechnol., 22 969
–976
(2004). https://doi.org/10.1038/nbt994 1087-0156 Google Scholar
I. L. Medintz,
H. T. Uyeda,
E. R. Goldman, and
H. Mattoussi,
“Quantum dot bioconjugates for imaging, labelling and sensing,”
Nat. Mater., 4 435
–446
(2005). https://doi.org/10.1038/nmat1390 1476-1122 Google Scholar
X. Michalet,
F. F. Pinaud,
L. A. Bentolila,
J. M. Tsay,
S. Doose,
J. J. Li,
G. Sundaresan,
A. M. Wu,
S. S. Gambhir, and
S. Weiss,
“Quantum dots for live cells, in vivo imaging, and diagnostics,”
Science, 307 538
–544
(2005). https://doi.org/10.1126/science.1104274 0036-8075 Google Scholar
J. K. Jaiswal and
S. M. Simon,
“Potentials and pitfalls of fluorescent quantum dots for biological imaging,”
Trends Cell Biol., 14 497
–504
(2004). 0962-8924 Google Scholar
C. X. Min-Kyung So,
A. M. Loening,
S. S. Gambhir,
J. Rao,
“Self-illuminating quantum dot conjugates for in vivo imaging,”
Nat. Biotechnol. Biol., 24 339
–343
(2006). Google Scholar
N. Y. Morgan,
S. English,
W. Chen,
V. Chernomordik,
A. Russo,
P. D. Smith, and
A. Gandjbakhche,
“Real time in vivo non-invasive optical imaging using near-infrared fluorescent quantum dots,”
Acad. Radiol., 12 313
–323
(2005). 1076-6332 Google Scholar
T. P. Thomas,
M. T. Myaing,
J. Y. Ye,
K. Candido,
A. Kotlyar,
J. Beals,
P. Cao,
B. Keszler,
A. K. Patri,
T. B. Norris, J. R. Baker Jr.,
“Detection and analysis of tumor fluorescence using a two-photon optical fiber probe,”
Biophys. J., 86 3959
–3965
(2004). 0006-3495 Google Scholar
J. K. Jaiswal,
H. Mattoussi,
J. M. Mauro, and
S. M. Simon,
“Long-term multiple color imaging of live cells using quantum dot bioconjugates,”
Nat. Biotechnol., 21 47
–51
(2003). https://doi.org/10.1038/nbt767 1087-0156 Google Scholar
W. C. Chan and
S. Nie,
“Quantum dot bioconjugates for ultrasensitive nonisotopic detection,”
Science, 281 2016
–2018
(1998). https://doi.org/10.1126/science.281.5385.2016 0036-8075 Google Scholar
M. Bruchez Jr., M. Moronne,
P. Gin,
S. Weiss, and
A. P. Alivisatos,
“Semiconductor nanocrystals as fluorescent biological labels,”
Science, 281 2013
–2016
(1998). https://doi.org/10.1126/science.281.5385.2013 0036-8075 Google Scholar
C. M. Niemeyer,
“Nanoparticles, proteins, and nucleic acids: biotechnology meets materials science,”
Angew. Chem., Int. Ed., 40 4128
–4158
(2001). https://doi.org/10.1002/1521-3773(20011119)40:22<4128::AID-ANIE4128>3.3.CO;2-J 1433-7851 Google Scholar
X. Gao,
W. C. Chan, and
S. Nie,
“Quantum-dot nanocrystals for ultrasensitive biological labeling and multicolor optical encoding,”
J. Biomed. Opt., 7 532
–537
(2002). https://doi.org/10.1117/1.1506706 1083-3668 Google Scholar
A. P. Alivisatos,
“Semiconductor clusters, nanocrystals, and quantum dots,”
Science, 271 933
–937
(1996). https://doi.org/10.1126/science.271.5251.933 0036-8075 Google Scholar
H. Y. Xie and
D. W. Pang,
“Preparation of II–VI quantum dots and their application in biodetection,”
Chinese J. Anal. Chem., 32 1099
–1103
(2004). Google Scholar
J. L. Swift,
R. Heuff, and
D. T. Cramb,
“A two-photon excitation fluorescence cross-correlation assay for a model ligand-receptor binding system using quantum dots,”
Biophys. J., 90 1396
–1410
(2006). 0006-3495 Google Scholar
X. Wu,
H. Liu,
J. Liu,
K. N. Haley,
J. A. Treadway,
J. P. Larson,
N. Ge,
F. Peale, and
M. P. Bruchez,
“Immunofluorescent labeling of cancer marker Her2 and other cellular targets with semiconductor quantum dots,”
Nat. Biotechnol., 21 41
–46
(2003). https://doi.org/10.1038/nbt764 1087-0156 Google Scholar
Y. Li,
B. Tian,
J. Yang,
L. Zhao,
X. Wu,
S-L. Ye,
Y.-K. Liu, and
Z.-Y. Tang,
“Stepwise metastatic human hepatocellular carcinoma cell model system with multiple metastatic potentials established through consecutive in vivo selection and studies on metastatic characteristics,”
J. Cancer Res. Clin. Oncol., 130 460
–468
(2004). 0171-5216 Google Scholar
A. Pierres,
P. Eymeric,
E. Baloche,
D. Touchard,
A.-M. Benoliel, and
P. Bongrand,
“Cell membrane alignment along adhesive surfaces: contribution of active and passive cell processes,”
Biophys. J., 84 2058
–2070
(2003). 0006-3495 Google Scholar
G. I. Abelev and
T. L. Eraiser,
“Cellular aspect of a-fetoprotein reexpression in tumors,”
Semin Cancer Biol., 9 95
–107
(1999). 1044-579X Google Scholar
M. K. So,
C. Xu,
A. M. Loening,
S. S. Gambhir, and
J. Rao,
“Self-illuminating quantum dot conjugates for in vivo imaging,”
Nat. Biotechnol., 24 339
–343
(2006). https://doi.org/10.1038/nbt1188 1087-0156 Google Scholar
R. Duncan,
“The dawning era of polymer therapeutics,”
Nat. Rev. Drug Discovery, 2 347
–360
(2003). 1474-1776 Google Scholar
R. K. Jain,
“Delivery of molecular medicine to solid tumors: lessons from in vivo imaging of gene expression and function,”
J. Controlled Release, 74 7
–25
(2001). 0168-3659 Google Scholar
M. Scalerandi,
A. Romano,
G. P. Pescarmona,
P. P. Delsanto, and
C. A. Condat,
“Nutrient competition as a determinant for cancer growth,”
Phys. Rev. E, 59 2206
(1999). https://doi.org/10.1103/PhysRevE.59.2206 1063-651X Google Scholar
A. Bru,
S. Albertos,
J. Luis Subiza,
J. L. Garcia-Asenjo, and
I. Bru,
“The universal dynamics of tumor growth,”
Biophys. J., 85 2948
–2961
(2003). 0006-3495 Google Scholar
G. E. Jaiswal,
J. K. H. Mattoussi,
“Use of quantum dots for live cell imaging,”
Nat. Methods, 1 73
–78
(2004). 1548-7091 Google Scholar
L. Braydich-Stolle,
S. Hussain,
J. Schlager, and
M. C. Hofmann,
“In vitro cytotoxicity of nanoparticles in mammalian germ-line stem cells,”
Toxicol. Sci., 13 13
(2005). 1096-6080 Google Scholar
A. M. Derfus,
W. C. W. Chan, and
S. N. Bhatia,
“Probing the cytotoxicity of semiconductor quantum dots,”
Nano Lett., 4 11
–18
(2004). https://doi.org/10.1021/nl0347334 1530-6984 Google Scholar
J. Lovric,
H. S. Bazzi,
Y. Cuie,
G. R. Fortin,
F. M. Winnik, and
D. Maysinger,
“Differences in subcellular distribution and toxicity of green and red emitting quantum dots,”
J. Mol. Med., 83 377
–385
(2005). 0946-2716 Google Scholar
D. M. Warshaw,
G. G. Kennedy,
S. S. Work,
E. B. Krementsova,
S. Beck, and
K. M. Trybus,
“Differential labeling of myosin V heads with quantum dots allows direct visualization of hand-over-hand processivity,”
Biophys. J., 88 L30
–32
(2005). https://doi.org/10.1529/biophysj.105.061903 0006-3495 Google Scholar
|


