
|
|
1.IntroductionOptical computed tomography (optical-CT) is the optical analog to x-ray CT and has been under development for some years for the purpose of achieving high-resolution three-dimensional (3-D) dosimetry in radiation therapy.1, 2, 3 These systems were first-generation devices (i.e., a scanning laser with point detector photodiode) that were slow but had high inherent accuracy by virtue of effective minimization of the detection of scattered light.4 In optical-CT, 3-D images of the distribution of optical attenuation throughout a sample are reconstructed from “projection images” of light transmitted through the sample. Second-generation systems5, 6, 7 achieved an order of magnitude increase in speed using CCD area detectors but exhibited a potential for image degradation for samples a with a significant light-scattering component.4 More recently, optical-CT techniques have been applied in attempts to image structure and function in biological samples.8, 9 Sharpe 8 achieved exquisite 3-D optical-CT images of the distribution of light-absorbing LacZ reporter stain in 11.5-day-old mouse embryos. Oldham 10, 11, 12 acquired 3-D images of the whole microvasculature network in unsectioned xenograft tumors with a combination of high spatial resolution and high contrast. The feasibility of optical emission computed tomography (optical-ECT), the optical analog of single photon emission computed tomography (SPECT), has been demonstrated for imaging the 3-D distribution of gene expression through fluorescent reporter proteins in mouse embryos.9 In optical-ECT, 3-D images of the distribution of emitting light sources (e.g., fluorochromes) are reconstructed from emission images of light emitted from the sample. Optical-ECT imaging of gene expression was also demonstrated in Oldham, 12 where images were reconstructed of the 3-D distribution of viable cells in unsectioned HCT116 human colon xenograft tumors, which had been transfected with constitutive red-fluorescent-protein (RFP). Coregistered images of the macroscopic microvasculature network were acquired, in the same tumors, from both optical-CT imaging of a light-absorbing stain and optical-ECT imaging of a fluoroscein (FITC)-lectin conjugate. In all these works investigating the potential of optical-CT and optical-ECT for biomedical imaging, imaging was performed on a stereoscopic microscope, with in-house customization to enable tomographic imaging through sample rotation in the field of view of the microscope. Samples were imaged ex vivo, to enable effective optical clearing, which is an essential prerequesite for high-quality optical-CT/optical-ECT imaging. Imaging accurate in vivo functional information is entirely feasible, however, because optical stains and fluorescent markers can be applied/generated in vivo such that representative staining is achieved for subsequent imaging by optical-CT/optical-ECT. The principal attractiveness of optical-CT and optical-ECT were demonstrated, in that high-resolution (10 to , depending on sample size) and high-contrast coregistered 3-D images of a wide variety of optical probes for structure and function can be acquired for relatively large intact samples. Other methods of imaging small biomedical samples are micro-CT,13 micro-MRI,14 and micro-PET.15 Each of these has its own advantages with unique sources of image contrast. However, the compatibility of optical ECT with fluorescent reporter proteins yields significant opportunities for imaging gene expression at high resolution in a manner unavailable to these techniques. The lack of requirement for sectioning offers advantages over confocal microscopy,16 conventional microscopy, histological sectioning techniques, and optical-CT,17 both in terms of convenience but more importantly in preserving the 3-D nature of information. While intriguing results have been achieved with previous optical-CT microscopy systems, there are inherent limitations in attempting tomographic imaging of larger samples on a microscope with conventional optics. Principal limitations stem from the limited depth of field from microscope optics, which are designed to image flat samples, but limitations also arise from the difficulty in engineering and controlling precise rotational motion of macroscopic samples in the microscopic geometry. In this work, we introduce an in-house benchtop second-generation system, capable of both optical-CT and optical-ECT imaging, with improved imaging performance when compared to the microscope-based system introduced in Ref. 12. The system can acquire coregistered 3-D images of tissue structure (e.g., microvasculature) and function (e.g., gene expression) with high spatial resolution and high contrast. Several advantages accrue from the release of the restrictions of the microscopic optical chain. Image formation is achieved by telecentric optics with increased depth of field, enabling the feasibility to image larger samples. (A trade-off exists here, in that as the depth of field increases, the lateral spatial resolution decreases.7) Furthermore, greater stability and control of the movement of the sample can be achieved on a benchtop system, which can lead to higher-quality reconstructions. Apart from developments in instrumentation and technique, this paper extends the application of optical-CT and optical-ECT to new areas. The first 3-D optical-CT images of the entire perfused microvascular networks of whole unsectioned anatomical organs are presented. Rat heart and lungs were imaged after in vivo staining of the microvasculature with light-absorbing stain. Coregistered optical-CT and optical-ECT images of mouse heart, lungs, and kidneys were imaged after in vivo staining with a fluorescent marker. These techniques have considerable potential for imaging a range of other structural and functional aspects of organs labeled with “smart” optical markers, including fluorescent reporter genes. Recent advances include labeling the HIF-1 response of hypoxic tissues,18 tracking of particular cell populations within whole organs,19 and examining key responses to cell stress, such as those mediated by NFKappa B.20 2.Methods2.1.Optical-CT and Optical-ECT Imaging SystemsThe experimental benchtop configurations for optical-CT and optical-ECT, including simplified light paths, are illustrated in Fig. 1 . In both cases, multiple two-dimensional (2-D) projection/emission images of the sample are acquired in a step-and-image manner by a CCD camera, as the sample rotates about a vertical axis centered in the glass scintillation vial. The glass vial contains an optically cleared sample (described later) set in a firm agarose gel matrix that ensures the vial and sample rotate as a single unit. The vial itself is contained within an aquarium constructed from antireflection-coated glass and containing an index-matched transparent fluid. The purpose of the matched fluid is to reduce the refraction and reflection of light incident onto the vial. Index matching was achieved by increasing the concentration of a glycerol solution until minimal refraction was observed. In practice, a 50% glycerol solution (refractive index 1.47) is adequate provided the sample is restricted to central 1/3 of the diameter of the vial. Incident illumination for both optical-CT and optical-ECT modes was provided by a FiberLite MH100 metal halide illuminator (Dolan Jenner Industries, Inc., Lawrence, Massachussets), which has an extended spectral range that includes a UV component for certain excitation applications. In optical-CT “transmission” mode, a backlight (Dolan Jenner Industries, Inc.) was connected to the light source using a liquid optical fiber, to provide uniform diffuse background illumination of the sample [Fig. 1a]. Optical-CT imaging was performed with white light in the present examples. In optical-ECT “emission” mode, the sample was illuminated with short-wavelength excitation light orthogonal to the imaging axis [Fig. 1b]. The projection and emission images were captured using a CV-M50 10-bit monochrome CCD camera (JAI Corporation, San Jose, California) mounted on an optical rail. Coordination of motion and data acquisition was achieved using an integrated National Instruments PXI chassis, containing a 1042 controller card (National Instruments, Austin, Texas), a MID7604 motor driver (National Instruments), and a UNIBLITZ VMM-D1 shutter driver (Vincent Associates, Rochester, New York) controlling a VS25S2T1 shutter (Vincent Associates). The shutter (not shown in Fig. 1) reduced photo-bleaching in the sample by exposing the sample only during image acquisition. Precise synchronization of the step-and-image acquisition sequence was achieved using LABVIEW code that instigated an incremental rotation whenever an image was written to disk by the camera. Fig. 1Simplified light paths through the in-house benchtop experimental setups for (a) optical-CT (transmission mode) and (b) optical-ECT (emission mode). The aquarium was made from antireflection-coated glass and is of dimension . The telecentric lens system ensured image formation from light traveling parallel to the optic axis. Incorporation of quality narrow-bandwidth filters improves image quality by reducing contaminating light.  There are design benefits of the optical-bench system of Fig. 1 compared to the microscope systems incorporating conventional optics. 8, 9, 10, 12 Principally, high depth of field image forming optics were incorporated, such that features at all depths in the sample remain sharp and distinct and in focus. This was achieved using a telecentric lens system (TEC-M55 computer with a converter, Edmund Optics, Barrington, New Jersey) which forms an image dominated by light that traverses parallel to the optic axis through the sample. The telecentric specifications of the TEC-M55 are a focal length of , a working distance of 5.25 to , a field of view of 6.4 to , and a primary magnification of to . Telecentric lenses have two advantages for the purpose of parallel ray computed tomograhy: they provide a near constant perspective across the field of view, and the image magnification is constant with sample depth. In optical-ECT, telecentric optical collimation is analogous to the physical collimation and elimination of scatter of gamma rays in SPECT. The telecentric collimation improves the approximation of real image-forming light paths to the ideal parallel-ray transmission paths assumed in the filtered back-projection reconstruction algorithms, and hence yields improvements in image quality, especially for large samples. Further benefits in the bench system include the ability to image larger samples (up to ) and a reduced motion point spread function because of the increased stability of engineering a vertical axis of rotation compared to a horizontal axis. 2.1.1.Image acquisitionAlthough the hardware of the bench system is different, the procedures and process of data acquisition for both optical-CT and optical-ECT are similar to those of the microscope system described in Ref. 12. Projections were acquired in a “step-and-image” manner at small angular increments (e.g., ) through a complete 360-deg revolution. This number of projections has been found to yield good image quality in practice, although more projections are required to meet the strict Nyquist sampling criteria. The central axis of rotation of the vial was aligned to be coincident with the central column of pixels in the camera image frame, to ensure consistent projection (or emission) data for reconstruction. The exposure time was constant between projections and set as high as possible without incurring overexposure of the detector. The combined optical-CT and optical-ECT scanner in Fig. 1 represents a second-generation, fast scanning system when compared with first-generation optical-CT devices.1, 2, 3 The time for a typical acquisition of 360 projections was about , a factor three times faster than the microscope system. Typical acquisition times for first-generation systems are much longer, often taking many hours to complete. The increase in speed of the second-generation systems arises because an entire 2-D projection image of the sample is acquired in a single acquisition of the CCD camera. The downside is that projection images are susceptible to detection of contaminant scattered light, which has the potential to introduce scatter artifacts.4, 21, 22 This limitation is greatly minimized by effective optical clearing (discussed later) to minimize the scatter component. In optical-ECT, acquisition proceeds in the same step-and-image procedure outlined earlier, with the addition of narrow-bandwidth optical filters to select both the excitation and emitting wavelengths. High-quality filters enhance the accuracy of image data by reducing the autofluorescent component. The fluorescein (FITC) filter sets selected excitation and emission wavelengths of 494 and , respectively. The DSRed2 filter sets selected excitation and emission wavelengths corresponding to RFP (558 and , respectively). On completion of the scan, 3-D reconstructions of the sample were created using a commercial tomographic reconstruction software, COBRA (Exxim Computing Corp., Pleasantown, California). Input parameters were adjusted to reflect the geometries of the image acquisition, as illustrated in Fig. 1. For all acquisitions, the projection or emission images were of dimensions pixels. The field of view corresponding to this image varied with the sample size, as the lens had a zooming facility. The dimensions of the 3-D reconstructed volume were , indicating a slight downsizing of the output. A typical field of view would be , indicating potential for reconstruction at the level for the present inexpensive 10-bit analog camera. 2.1.2.Characterization of imaging performanceThree characteristics of the microscope optical-CT and optical-ECT system were evaluated in Oldham, 12 the geometrical accuracy of reconstruction, the accuracy of reconstructed attenuation coefficients, and the spatial resolution as given by the modulation transfer function (MTF). In an attempt to investigate the improved performance of the bench system, a similar evaluation was performed using the same phantoms where possible. The geometrical accuracy of reconstruction was evaluated by optical-CT scanning a needle phantom [Fig. 2A ] and then comparing locations of the needles in the optical-CT image with an x-ray CT image, the latter representing the gold-standard positions. The needle phantom consists of a scintillation vial partially filled with agarose gel (0.75% by weight) and containing a spiral arrangement of thin wires that had been set into the gel in a vertical orientation. The comparison of needle positions was performed in the DOSEQA software (Stonybrook University, www.doseqa.org), which enabled rigid body translation and rotation registration between the two 3-D data sets. Fig. 2Verification of geometrical accuracy of reconstruction in optical-CT using a spiral needle phantom. (A) Photograph of the needle phantom. (B) Overlay fusion image of the axial slice, corresponding to the plane of the dashed line, of a needle phantom scanned by both x-ray-CT (needles appear as dark circles) and optical-CT (needles appear as light specks). (C) The corresponding fusion image acquired on the prior microscope system, indicating poor quality. 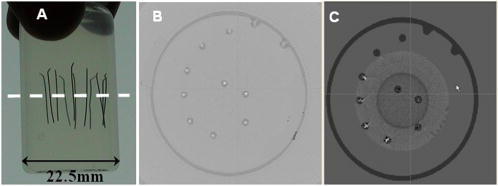 Finger phantoms [Fig. 3A ] were used to compare the accuracy of optical-CT reconstructed attenuation coefficients with those determined by a spectrophotometer (Genesys Spectronic 20, Thermo Electron Corp., Waltham, Massachusetts). The finger phantoms were constructed from 0.75% agarose gel (by weight) and incorporated three or four agarose fingers of variable optical attenuation. The method of construction is described in Ref. 12. The true attenuation of the fingers was taken as that measured by pouring the remainder finger gel into optical cuvettes and measuring transmission in the spectrophotometer. A green filter was incorporated for optical-CT imaging, and the transmission wavelength for the spectrometer was set at . Fig. 3Verification of the accuracy of reconstructed attenuation coefficients using finger phantoms. (A) Photographic view of a finger phantom containing three fingers of varying attenuation. (B) Plot of attenuation coefficients of the fingers determined from the optical-CT and spectrophotometer. (C) MTF curves determined from an optical-CT scan of a single human hair orientated vertically in the gel, representing impulse response function.  The MTF of the system was determined from an optical-CT scan of the same phantom used in Ref. 12, a single human hair set vertically in a gelatin gel centrally in a scintillation vial. The diameter of the hair was measured as 0.07 mm by calipers. The MTF was calculated by taking the fast Fourier transform (FFT) of a radon transform of a reconstructed axial slice through the hair. A correction was made for the thickness of the hair. We note that the off-axis MTF will be different at different radial distances. 2.2.Sample PreparationPrevious work in our laboratory explored 3-D optical-CT and optical-ECT imaging of xenograft tumors containing delicate fluorescing reporter proteins.12 In the present work, similar techniques were used to prepare whole rodent organs for imaging, with some differences. All samples were whole (i.e., unsectioned) at the time of imaging, were optically cleared to enable visible light penetration, and were set in 0.75% agarose gel in scintillation vials. Significant care is required to adequately prepare tissue samples for optical-CT and optical-ECT imaging. Sample preparation is considered as consisting of two major sequential steps, staining and clearing. There are different approaches to achieve either step. In this work, the first “staining” step was achieved by administering a contrast or labeling agent to the live animal (e.g., by tail vein or carotid artery cannulation) such that the stain is deposited by natural circulation of the blood. All procedures were performed under IACUC-approved protocols in our institution. The in vivo application and deposition of the stain is an important requisite for the stain to accurately reflect in vivo conditions. Two stains have been evaluated: a passive light-absorbing stain based on an isotonic ink solution and an active FITC-lectin conjugate, where the lectin actively binds to endothelial cells and the FITC protein can be stimulated to emit fluorescent light. The agents were allowed to circulate for about 4 to 5 min prior to sacrificing the animal. The tissue of interest was then removed for the second preparation step of optical clearing. The principles underlying optical clearing are described elsewhere23 and involve sample fixation and reperfusion with graded solutions of first methanol and then BABBs (a 1:2 solution of benzyl alcohol and benzyl benzoate). The reperfusion greatly reduces light scattering in the tissue by homogenizing the refractive index by replacing cellular water content with a higher-refractive-index solution. The use of methanol-BABBs is a departure from Ref. 12, where ethanol and methyl-salicylate were used. The reason is that the latter has been found to be more effective at preserving the delicate reporter proteins, but their absence in the present work enabled the use of methanol-BABBs, which has a slightly improved clearing effect. Further specifics of the staining and clearing steps as they apply to individual samples are described in the next sections. 2.2.1.Vasculature and relative perfusion in rat heart and left lungOptical-CT contrast of the vasculature of the heart and lungs was achieved by a slow in vivo tail vein injection of a passive staining isotonic solution of India ink. The ink stain had been previously spun down in a centrifuge to remove the larger particulates. The stain was allowed to circulate naturally for over before the animal was sacrificed. Tail vein circulation efficiently returns the stain to the heart and then on to the lungs. The carbon-based ink particles circulate in the blood stream and stain microvasculature where particles are trapped in the vascular lining. Microvasculature thus appears as a high-contrast network of dark vessels in the cleared tumor samples and are suitable for optical-CT. 2.2.2.Vascular and relative perfusion in right mouse lung and kidneyA combined optical-CT and optical-ECT contrast bolus was delivered through a tail vein injection to a nude mouse. The bolus contained a 1:1 ratio of passive isotonic India ink light-absorbing stain (for optical-CT) and an active FITC-lectin marker (for optical-ECT). The dual staining approach opens the potential for multimodal optical-CT/optical-ECT imaging on the same tissue sample, and thus represents a powerful combinatorial technique. Lectin actively binds to endothelial cells of the microvasculature, fixing the fluorescent FITC probe to the vasculature of interest. Five to ten min post-application, the mouse was sacrificed, and the tissue of interest was removed for sample clearing and imaging. 3.Results and Discussion3.1.Imaging Performance of the In-House Benchtop Optical-CT SystemThe geometrical accuracy of the benchtop optical-CT system is illustrated in Fig. 2B, which is a fusion image of a spiral needle phantom imaged by both optical-CT and x-ray CT. The registration and comparison of needle positions in both data sets was done in 3-D, although just the central slice comparison is shown here. The corresponding image from the same experiment performed on the microscope system is shown in Fig. 2C (reproduced from Ref. 12). Several striking improvements are immediately apparent from comparison of these figures. First, the quality of the needles reconstructed from optical-CT acquired on the bench is superior to that from the microscope system. Needles appear better defined as circular points, have less pronounced “star” artifacts, and have even value from the inner needles to the outer margin of the phantom. In comparison, needle images on the microscope system appear distorted (e.g., have streak artifacts), with the severity of distortion increasing with radial distance from the central axis. This observation is attributed to the limited depth of field of the microscope optics. During acquisition, as the sample rotates, the same needle appears to come in and out of focus as its depth changes, and the range of depths increases with radial distance from this axis. The result is blurring and inconsistencies of needles in different projections, leading to artifacts in the reconstructed image. A second observation from Figs. 2B, 2C is that the bench system is able to reconstruct all the needles in the phantom, even out to the edges. In practice, this opens the potential of the technique to larger samples. The agreement of needle positions between both modalities (x-ray and optical-CT) indicates accurate geometrical reconstruction in optical-CT on the bench to within experimental error of . A photograph of the finger phantom used to determine the accuracy of reconstructed attenuation coefficients is shown in Fig. 3A. The corresponding plot of attenuation coefficients determined by optical-CT and independently by spectrophotometer is shown in Fig. 3B. A linear correlation is observed, indicating that the technique can accurately image the relative amounts of stain in different regions of the sample, and may enable quantitative metrics to be developed. Repeat experiments have verified that the noise in Fig. 3C (i.e., departure from straight-line fit) reflects the experimental challenges of creating small fingers of uniform known optical attenuation and similar refractive index as the host gel. The MTF of the bench system deduced from an axial optical-CT scan of the gelatin scintillation vial phantom containing a single human hair, aligned on the central axis of rotation, is shown in Fig. 3C. Corrections were made for the thickness of the hair and the background attenuation signal of the gel. Three MTF curves are shown: two correspond to different zoom settings on the quasi-telecentric lens on the present benchtop system, and one corresponds to the MTF of the previous microscope system (reproduced from Ref. 12). The curves illustrate that the highest resolution is achieved in high zoom mode, where detail at the scale can be imaged. While this resolution is insufficient to image individual cells, it is sufficient to image subtle microvasculature and other biological and structural features on this order of scale. The curves also show that the bench system has approximately double the spatial resolution of the previous microscope system. This surprising result is attributed to a reduced motion point-spread function. 3.2.Optical-CT of Rat Heart and Left LungSingle optical-CT projection images of the rat heart and lung stained with absorbing stain are shown in Fig. 4A, 4B . In these images, the dark stain (light absorbing) is apparent lining the walls of the vasculature of the heart where the carbon-based stain particles get trapped in the vascular lining. Even though a relatively low-spec analog camera was used , a high level of detail is observed in these projection images. This detail is achieved only with an effective optical-clearing procedure. Orthogonal views through the corresponding 3-D reconstructed optical-CT data of the rat heart are shown in Fig. 5 . Figure 5A, 5B, 5C are orthogonal views through the reconstructed heart along the planes indicated by dotted lines in Fig. 5A. Pixel values in these reconstructed images reflect the optical attenuation coefficients in the heart. Light regions correspond to high attenuation, and hence presence of light-absorbing stain. Exquisite visualization of the major and minor arteries and microvasculature of the heart is observed. The major anatomical components of the heart are clearly visible, including the atrium, the right and left ventricles, the mitral valves, the ascending aorta, and pulmonary veins. A surface rendering of the same data illustrating the coronary arteries is shown in Fig. 5D. While interpretation of major features is unambiguous in these images, comparison with standard histological sectioning was performed to evaluate correlations in more subtle features. Figure 6A shows an axial optical-CT slice through the heart. A corresponding eosin-stained histological section is showed in Fig. 6B, revealing viable cytoplasmic material in pink (color online only). Hematoxylin staining was omitted, as the dark purple coloration would mask any ink signature. Ink visualization was not readily identified on the eosin sections because of ink loss during section preparation. Follow-up histological sections of the three labeled regions in Fig. 6B were therefore prepared with a less intensive processing procedure. slices were sectioned from samples embedded in paraffin wax using a microtome. The sections were heated to melt the paraffin and gently washed twice in xylene before mounting on a glass slide for photomicroscopy. Control sections were prepared identically on rat heart samples that had no ink staining. magnification images are shown in Fig. 6 for the three representative regions [1 to 3 in Fig. 6B]. Contrasting these images with the control image, ink staining is clearly visualized in all three regions. Regions 1 and 3 appear to show a greater degree of ink staining than region 2, and this qualitatively correlates with the optical-CT slice, which also shows less attenuation in region 2. Strong ink staining was also observed lining the walls of the coronary artery, as indicated in the upper-right subfigure. The histological confirmation of effective vasculature staining of a wide range of vessel diameters (both large and small vessels) bodes well for the potential for the development of quantitative vascular metrics for optical-CT, although this effort is outside the scope of the present work. Fig. 4Transmission and emission images through various optically cleared rodent organs. (A,B) Transmission images of a rat heart and left lung, respectively, stained with passive absorbing stain. (C,D) Transmission and emission images, respectively, of left lung of mouse after double-staining with both active and passive agents. (E) Emission image of mouse kidney stained with an FITC-lectin conjugate vascular marker.  Fig. 5Optical-CT images of a rat heart. The vasculature of the rat heart was stained by an in vivo tail vein injection of light attenuating isotonic black ink. 3-D orthogonal views of the ink-stained rat heart, corresponding to the planes indicated with dotted lines, are shown in (A), (B), and (C). A 3-D rendering of the rat heart, with opacity windowed to illustrate the coronary arteries, is shown in (D). Exquisite detail of the coronary arteries, vasculature, and myocardial perfusion is visible. Abbreviations are: LA—left atrium, RA—right atrium, AA—ascending aorta, LV—left ventricle, RV—right ventricle, CA—coronary arteries, AV—aortic valve, and PV—pulmonary veins.  Fig. 6Histological sections of the rat heart in Fig. 5 to determine the distribution of vasculature staining in heart tissue (scale ). The optical-CT slice is shown in (A). (B) is a corresponding eosin-stained section showing viable cytoplasm in pink and indicating three regions followed up with a no-stain (i.e., no hematoxylin or eosin), minimal wash processing technique to preserve the ink stain. Regions 1 and 3 exhibit higher perfusion (ink staining) in the optical-CT image, and this is qualitatively confirmed in the corresponding histological sections. Strong staining is also observed lining the coronary artery wall. All section images were acquired at magnification (color online only).  Orthogonal views through the optical-CT reconstructed data of the rat lung stained with absorbing stain is shown in Fig. 7A, 7D . Light regions correspond to regions of high light absorption, and thus higher stain uptake. The amount of stain deposited in different regions is directly related to the blood perfusion of those regions, and so these images reflect a 3-D perfusion map of the lung. The major air passages of the bronchi are clearly visible as dark tracks through the lung, representing a lack of attenuating stain. Substantial high-resolution variation in intensity of perfusion is visible throughout the lung generally consistent with known inhomogeneities of lung perfusion.24 In particular, the upper regions of the lung are observed to have less perfusion in general than the lower outer regions. A detailed comparison with histological sectioning (selected views are shown in Fig. 8 ) confirms that vascular density and staining is higher in regions indicated in the optical-CT images. Comparison with the control image reveals clear evidence of ink penetration throughout the microvasculature, which is observed in repeated circular or elliptical patterns reflecting cut-planes through the alveoli and bronchioles. Although the sections show that a relatively small volume of space contains stain, a high proportion of tissue volume (i.e., vasculature) contains the stain. This is because the lung is essentially a vasculature network around air-spaces. The optical-CT images are not of sufficient resolution to image on the alveolar scale, and the “volume-averaged” effect is that there is significant stain in each reconstructed voxel. The amount varies spatially throughout the lung. The histological sections confirm regions of low perfusion and high perfusion (regions 1 and 2, respectively), as indicated in the optical-CT scan. Strong staining is also observed lining larger vessels and bronchioles. As with the heart images, the fact that efficient stain penetration is observed into the smaller vessels around the alveolar cavities bodes well for the development of quantitative metrics for optical-CT. Fig. 7(A) to (C) Orthogonal views through the optical-CT 3-D reconstruction of a rat lung, showing regions of high perfusion (light). The vasculature of the rat lungs was stained by a tail vein injection of light attenuating isotonic black ink. (D) 3-D rendering of the same lung lobe with opacity and contrast adjusted to show bronchi passages.  Fig. 8Histological sections of the healthy rat lung shown in Fig. 7 (scale ). Labeled regions 1 and 2 correspond to regions of low and higher perfusion, respectively, as indicated on the optical-CT slice (upper left image). This result is confirmed by histology, which shows high vascular density and staining in these areas. Histological preparation was the same as that for Fig. 6. Strong ink staining is observed lining major vessels, in capillaries lining bronchioles, and also in smaller capillaries surrounding alveoli cavities.  3.3.Optical-CT and Optical-ECT of Mouse Lung and KidneyOrthogonal views through the 3-D reconstructed optical-CT and optical-ECT data of a right mouse lung, which had been doubly stained for vasculature using both the passive (absorbing stain) and active FITC-lectin endothelial marker, is shown in Fig. 9 . In both data sets, lighter regions indicate high uptake of the labeling marker (absorbing stain for optical-CT and FITC-lectin for optical-ECT). The two data sets were acquired sequentially without moving the sample between acquisitions, such that a high degree of coregistration is observed between the two data sets. The basic outline of the anatomy is consistent between the data sets, and the three lobes of the right lung are clearly visible, as well as other prominent lung features. Some commonality of bright enhancement is observed in both sets lining the edges of the bronchial airways and is interpreted as larger vessels lining the main airways. There are also interesting apparent discrepancies. Regions of enhanced contrast in each data set are labeled with green marker (color online only). The optical-ECT data shows higher staining in the outer lower peripheral lung [Fig. 9D] and also in the major feeding vessels. Further experimentation is required to interpret the inhomogeneity of both fluorescent and absorbing signals represented in these images. Lectin binds specifically to glycoalyx of the endothelium. Bright regions in the optical-ECT data may correspond to increased vascular expression of glycoalyx. While the image quality in the upper regions of Figs. 9A, 9D appears quite good, blurring and loss of image quality is observed in the lower part of the image. This degradation is probably caused by the limited depth of field of the quasi-telecentric lens used in the present prototype system. The prototype lens is quasi-telecentric (i.e., fully telecentric under certain conditions), and this approximation may have deteriorated in the periphery of this sample. Fig. 9(A) to (C) 3-D orthogonal views through an optical-CT of a right mouse lung showing vasculature stained by absorbing stain. (D) to (F) Independent optical-ECT images showing vasculature stained by the FITC-lectin conjugate. Although general agreement in structure is observed, the arrows indicate apparent differences that may be in part attributed to variations in vessel expression of glycoalyx, the lectin binding site. 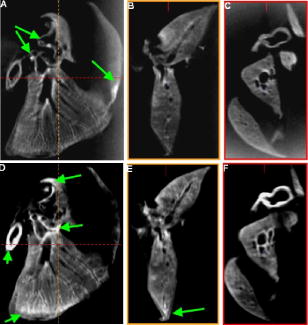 Figure 10 shows 3-D optical-ECT data of a mouse kidney stained with FITC-lectin and acquired with the FITC excitation and emission filter sets. Bright areas correspond to high FITC emission and hence reveal endothelial binding of the FITC-lectin conjugate. Clear visualization of the basic structure of the kidney is observed, and inhomogenous perfusion is indicated by the variation in signal in different regions of the kidney. The brightest portions are in the cortex, which contains primarily a mixture of glomeruli and tubular epithelium. This is the most highly perfused region of the kidney. The central portions of the organ are primarily collecting ducts, which are not as highly perfused. 4.ConclusionsIn our prior work, optical-CT and optical-ECT techniques were implemented on conventional dissecting microscopes and applied to imaging small embryos and xenograft tumors, all of which were in maximum dimension. The present work implements these techniques on an in-house benchtop system with improved optics and mechanical stability, which enables application to much larger samples (up to ). Two methods of optically labeling/staining tissue were investigated: passive intravascular and active intravascular. In both methods, the label/stain was administered by tail vein injection and subsequent natural circulation around the body. Optical imaging was enabled by application of an optical clearing procedure, which rendered even large samples of tissue almost completely transparent while preserving both absorbing and fluorescing optical contrast in the original condition. For the first time, optical-CT and optical-ECT data are acquired of fully formed mature whole rodent organs. The major arteries, microvasculature, and relative perfusion distribution of a mature rat heart is shown in detail, as revealed by optical-CT after in vivo staining with a light-absorbing stain. Similarly, optical-CT images of a rat lung revealed exquisite detail of the bronchi and relative perfusion distribution throughout the lung. Histological sections confirmed regions of dense vasculature visualized in optical-CT/optical-ECT images. Coregistered optical-ECT and optical-CT images of the right mouse lung, doubly stained with both passive and active markers, revealed fine detail of the lung vasculature. While 3-D perfusion imaging can also be obtained by alternative techniques (e.g., micro-CT and micro-MRI), optical-CT and optical-ECT, in conjunction with the optical clearing techniques, have the potential for higher spatial resolution and contrast and compatibility with fluorescent optical probes, They may thus yield complementary data with a relatively inexpensive technology. In summary, the potential of the optical-CT and optical-ECT techniques to image the 3-D absorbing and fluorescent distributions of optical probes in whole organs is demonstrated. The image quality presented here, while a substantial improvement over the earlier microscope-based systems, still represents preliminary work. Significant improvements can be expected with more sophisticated lenses and motion control and detector technologies. A wide range of tissue structures and functionality are expected to be amenable to imaging with these techniques, limited primarily by the sophistication of the optical labeling technologies. This is an area of rapid development, as indicated by the recent emergence of quantum dots, fluorophors, and fluorescent reporter proteins. Clinical potential may exist in the future through, for example, smart optical labeling of disease in vivo followed by biopsy and 3-D histology by optical-CT/optical-ECT. ReferencesJ. C. Gore,
M. Ranade,
M. J. Maryanski, and
R. J. Schulz,
“Radiation dose distributions in three dimensions from tomographic optical density scanning of polymer gels: I. Development of an optical scanner,”
Phys. Med. Biol., 41 2695
–2704
(1996). https://doi.org/10.1088/0031-9155/41/12/009 0031-9155 Google Scholar
R. G. Kelly,
K. J. Jordan, and
J. J. Battista,
“Optical CT reconstruction of 3-D dose distributions using the ferrous-benzoic-xylenol (FBX) gel dosimeter,”
Med. Phys., 25 1741
–1750
(1998). https://doi.org/10.1118/1.598356 0094-2405 Google Scholar
M. Oldham,
J. H. Siewerdsen,
A. Shetty, and
D. A. Jaffray,
“High resolution gel-dosimetry by optical-CT and MR scanning,”
Med. Phys., 28 1436
–1445
(2001). https://doi.org/10.1118/1.1380430 0094-2405 Google Scholar
M. Oldham,
“Optical-CT scanning of polymer gels,”
J. Phys.: Conf. Ser., 3 122
–135
(2004). https://doi.org/10.1088/1742-6596/3/1/011 1742-6588 Google Scholar
J. G. Wolodzko,
C. Marsden, and
A. Appleby,
“CCD imaging for optical tomography of gel radiation dosimeters,”
Med. Phys., 26 2508
–2513
(1999). https://doi.org/10.1118/1.598772 0094-2405 Google Scholar
S. J. Doran,
K. K. Koerkamp,
M. A. Bero,
P. Jenneson,
E. J. Morton, and
W. B. Gilboy,
“A CCD-based optical CT scanner for high-resolution 3-D imaging of radiation dose distributions: equipment specifications, optical simulations and preliminary results,”
Phys. Med. Biol., 46 3191
–3213
(2001). https://doi.org/10.1088/0031-9155/46/12/309 0031-9155 Google Scholar
N. Krstajic and
S. J. Doran,
“Focusing optics of a parallel beam CCD optical tomography apparatus for 3-D radiation gel dosimetry,”
Phys. Med. Biol., 51 2055
–2075
(2006). https://doi.org/10.1088/0031-9155/51/8/007 0031-9155 Google Scholar
J. Sharpe,
“Optical projection tomography as a new tool for studying embryo anatomy,”
J. Anat., 202 175
–181
(2003). https://doi.org/10.1046/j.1469-7580.2003.00155.x 0021-8782 Google Scholar
J. Sharpe,
U. Ahlgren,
P. Perry,
B. Hill,
A. Ross,
J. Hecksher-Sorensen,
R. Baldock, and
D. Davidson,
“Optical projection tomography as a tool for 3-D microscopy and gene expression studies,”
Science, 296 541
–545
(2002). https://doi.org/10.1126/science.1068206 0036-8075 Google Scholar
M. Oldham,
T. Oliver, and
M. Dewhirst,
“A novel method of imaging unperturbed tumor vasculature in 3-D,”
Int. J. Radiat. Oncol., Biol., Phys., 63 S134
(2005). 0360-3016 Google Scholar
M. Oldham,
T. Oliver, and
M. Dewhirst,
“Optical imaging of tumor microvasculature in 3-D,”
Med. Phys., 32 2134
(2005). 0094-2405 Google Scholar
M. Oldham,
H. Sakhalkar,
T. Oliver,
Y. M. Wang,
Y. Cao,
C. Badea,
G. A. Johnson, and
M. Dewhirst,
“Three dimensional imaging of xenograft tumors using optical computed and emission tomography,”
Med. Phys., 33 3193
–3202
(2006). https://doi.org/10.1118/1.2217109 0094-2405 Google Scholar
E. L. Ritman,
“Molecular imaging in small animals—roles for micro-CT,”
J. Cell Biochem. Suppl., 39 116
–124
(2002). 0733-1959 Google Scholar
N. Beckmann,
R. P. Hof, and
M. Rudin,
“The role of magnetic resonance imaging and spectroscopy in transplantation: from animal models to man,”
NMR Biomed., 13 329
–348
(2000). 0952-3480 Google Scholar
R. Myers,
“The biological application of small animal PET imaging,”
Nucl. Med. Biol., 28 585
–593
(2001). 0969-8051 Google Scholar
S. J. Wright and
D. J. Wright,
“Introduction to confocal microscopy,”
Methods Cell Biol., 70 1
–85
(2002). 0091-679X Google Scholar
A. G. Podoleanu,
“Optical coherence tomography,”
Br. J. Radiol., 78 976
–988
(2005). 0007-1285 Google Scholar
Y. Cao,
C. Y. Li,
B. J. Moeller,
D. Yu,
Y. Zhao,
M. R. Dreher,
S. Shan, and
M. W. Dewhirst,
“Observation of incipient tumor angiogenesis that is independent of hypoxia and hypoxia inducible factor-1 activation,”
Cancer Res., 65 5498
–5505
(2005). 0008-5472 Google Scholar
L. Miquerol,
S. Meysen,
M. Mangoni,
P. Bois,
H. V. van Rijen,
P. Abran,
H. Jongsma,
J. Nargeot, and
D. Gros,
“Architectural and functional asymmetry of the His-Purkinje system of the murine heart,”
Cardiovasc. Res., 63 77
–86
(2004). 0008-6363 Google Scholar
S. T. Magness,
H. Jijon,
N. Van Houten,
N. Fisher,
N. E. Sharpless,
D. A. Brenner, and
C. Jobin,
“In vivo pattern of lipopolysaccharide and anti-CD3-induced NF-kappa B activation using a novel gene-targeted enhanced GFP reporter gene mouse,”
J. Immunol., 173 1561
–1570
(2004). 0022-1767 Google Scholar
M. Oldham,
J. H. Siewerdsen,
S. Kumar,
J. Wong, and
D. A. Jaffray,
“Optical-CT gel-dosimetry I: basic investigations,”
Med. Phys., 30 623
–634
(2003). https://doi.org/10.1118/1.1559835 0094-2405 Google Scholar
M. Oldham and
L. Kim,
“Optical-CT gel-dosimetry II: optical artifacts and geometrical distortion,”
Med. Phys., 31 1093
–1104
(2004). https://doi.org/10.1118/1.1655710 0094-2405 Google Scholar
V. V. Tuchin,
“Optical clearing of tissues and blood using the immersion method,”
J. Phys. D, 38 2497
–2518
(2005). https://doi.org/10.1088/0022-3727/38/15/001 0022-3727 Google Scholar
E. L. Travis,
Z. X. Liao, and
S. L. Tucker,
“Spatial heterogeneity of the volume effect for radiation pneumonitis in mouse lung,”
Int. J. Radiat. Oncol., Biol., Phys., 38 1045
–1054
(1997). 0360-3016 Google Scholar
|


