|
|
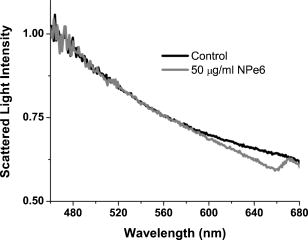
1.IntroductionThere is an increasing body of work in the literature on the subject of light scattering from intact cultured cells and in tissues to quantify subcellular morphology. These reports initially focused on wavelength-resolved or angularly resolved backscattering measurements from tissues, where nuclear sizes could be extracted.1, 2, 3 In cultured cells, where scattering measurements are free from the diffusive background present in tissues, there have been a variety of reports demonstrating that light scattering is sensitive to smaller organelles, and particularly to mitochondrial morphology changes induced by a variety of stresses. Boustany used an optical scatter imaging microscope to observe mitochondrial swelling from intact cells in response to calcium insult4 as well as from cells undergoing apoptosis by staurosporine exposure.5 Schuele 6 were able to observe heat-induced mitochondrial morphology changes using wavelength-resolved backscattering measurements in cultured cells. Our own studies revealed that angularly resolved light scattering could be used to monitor oxidative-stress-induced changes in mitochondrial morphology.7 Light scattering, in principle, has the ability to report both organelle sizes and relative changes in organelle sizes that are below the diffraction limit of an optical microscope. This was demonstrated by Fang, 8 who used wavelength-resolved backscattering measurements with 450 to 750-nm light to size polystyrene microspheres as small as with 20-nm accuracy. The authors were also able to size zymogen granules, extracted from cells, with length scales as small as and confirm their results with electron microscopy. While light scattering from cells has been modeled using more complicated methods,4, 9 most researchers have used various Mie-theory-based models to extract morphological information from their measurements. Mie theory, or the exact solution to scattering of an infinite plane wave by a homogeneous sphere, incorporates the parameters of particle size, particle refractive index, wavelength of light, and the refractive index of the surrounding medium. It has been shown that for organelle sizes smaller than nuclei and for refractive indices of organelles in cytoplasm reported in the literature,10, 11 the shape of both angularly resolved12 and wavelength-resolved light scattering8 distributions from a single particle depends strongly on particle size and weakly on the refractive index. The relative refractive index of the particle primarily affects the total scattering cross section. Because of this, in many studies it has been assumed in their respective inversion algorithms that all organelles have the same refractive index. When measurements are made from an ensemble of particles, such as organelles within intact cells, it has been shown that the observable signal is governed by the product of the number density of particles of a particular size and their scattering cross sections.13 In an angularly resolved measurement, we showed that we were sampling a phase function , which when measured from a collection of particles that obeyed a size distribution , was written where is the scattering cross section. There is an analogous expression for a wavelength-resolved measurement. Because each particle’s scattering cross section is dependent on its index of refraction, it is clear from Eq. 1 that a rigorous model of light scattering from cells must have a priori knowledge of the indices of refraction for different organelle populations that may blend together in size.In this paper, we report results of light scattering measurements from cells stained with high extinction lysosomal- and mitochondrial-localizing dyes. We both model and exploit experimentally the effects of adding absorbing dyes to organelles, with specific emphasis on the dependence of absorber-induced scattering changes on the inherent refractive index of organelles. Using these measurements and models, we provide strong evidence that there is a significant difference in the refractive index of mitochondria and lysosomes in EMT6 cells. 2.Materials and Methods2.1.Organelle-Localizing DyesTo stain lysosomes, we used N-aspartyl chlorine e6 (NPe6) (Light Sciences Corporation, Snoqualmie, Washington). NPe6 has been shown to strongly localize to lysosomes.14 Beyond this affinity to lysosomes, NPe6 has a high molar extinction, with a maximum of at in saline or at when bound to bovine serum albumin. As a mitochondrial stain with similar selectivity and extinction to NPe6, we chose the dye 2-(1-hexyloxyethyl)-2-devinyl pyropheophorbide- (HPPH), which was prepared from pyropheophorbide- according to the method of Pandey 15 This dye has been shown to localize strongly to mitochondria16 and has a molar extinction of at . Representative fluorescence excitation and emission spectra for NPe6 and HPPH in EMT6 cells are shown in Fig. 1 . Fig. 1Fluorescence excitation and emission spectra for EMT6 cells loaded with NPe6 (upper panel) or HPPH (lower panel). For NPe6, emission spectra were excited at , and excitation spectra were acquired monitoring emission at . For HPPH, emission spectra were excited at , and excitation spectra were acquired monitoring emission at . 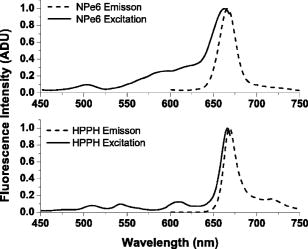 To verify that these experiments could be repeated with other organelle-localizing dyes, we used MitoTracker Deep Red 633 (Molecular Probes, Eugene, Oregon) with an extinction of at and LysoTracker Green (Molecular Probes, Eugene, Oregon) with an extinction of at to stain mitochondria and lysosomes, respectively. 2.2.Cell Culture and StainingFor angularly resolved light scattering and fluorescence excitation measurements, EMT6 mouse mammary sarcoma cells were maintained in monolayer in Eagle’s basal medium with 10% fetal bovine serum (complete media) at and 5% . When the cells reached 60 to 70% confluence, the media was removed, and cells were loaded with the appropriate dye. For NPe6 and HPPH loading, cells were incubated overnight in complete media at concentrations of and , respectively. For MitoTracker Deep Red and LysoTracker Green loading, cells were incubated at for and for , respectively. The cells were then washed twice with Hanks’ balanced salt solution (HBSS), lifted from the plate with 0.25% trypsin, and then suspended in at least 1 part complete media per part trypsin. They were then centrifuged and resuspended in HBSS at a concentration of approximately . For darkfield scattering spectroscopy measurements, EMT6 cells were grown on 25-mm-round No. 1 thickness coverslips in complete media. They were then incubated for in NPe6 in complete media in the dark. Prior to a measurement, the cells were washed twice in HBSS. 2.3.Fluorescence SpectroscopyFluorescence measurements of cells stained with either NPe6 or HPPH as already described were made using a Varian Eclipse (Palo Alto, California) fluorometer. Approximately cells suspended in of HBSS were pipetted into a 1-cm-path-length cuvette. For NPe6, excitation scans were taken monitoring fluorescence emission at , and emission spectra were taken with an excitation wavelength of . For HPPH, excitation scans were taken monitoring fluorescence emission at , and emission spectra were taken with an excitation wavelength of . 2.4.Angularly Resolved Light Scattering MeasurementsOur goniometer measurements have been reported previously.7, 13 A scattering sample in aqueous suspension is placed in a cylindrical cuvette, which is positioned above the center of a rotary stage, and light from a laser is directed through the cuvette. In these experiments, we used of light from a laser, of light from an argon laser, or of light from a diode laser. Both the diode laser and the argon laser are coupled into a single-mode optical fiber and then recollimated using a microscope objective with a numerical aperture (NA) of 0.4, while the collimated beam from the is sent directly to the cuvette. In all of our measurements, the laser light is linearly polarized perpendicular to the surface of the rotary stage. Light scattered from the sample is passed through a pinhole mounted midway to the edge of the rotary stage and collected by an optical fiber that is mounted at the edge. Light exiting the fiber is measured by a photodiode (New Focus model 2001, San Jose, California). A PC-controlled stepper motor rotates the stage, and the angular position is read out from an optical encoder. The stage position and photodiode voltage are simultaneously recorded every . The data acquisition is automated and controlled by a lab-built program written in LabView (National Instruments, Austin, Texas). A schematic of our setup is shown in Fig. 2 . Fig. 2Schematic of our goniometer for angularly resolved light scattering measurements. A sample (S) is placed above a rotary stage (RS). Light from a (633-nm), argon (488-nm), or diode (658-nm) laser is directed through the sample. The argon or diode lasers are coupled into a single mode (SM) fiber and then recollimated using a pair of objectives (Obj). Scattered light is collected through an aperture (A) into a multimode (MM) fiber and measured by a photodiode (PD).  For each measurement, a background is taken with only HBSS in the cuvette. Cells are then added to a concentration of , and the measurements are taken over the angular range 5 to . The background is subtracted from the data, and a factor of is multiplied to the data to correct for the intersection volume of the laser beam and the detector field of view.17 2.5.Darkfield Scattering Spectroscopy MeasurementsDarkfield scattering spectroscopy measurements are made using a method similar to that described by Curry 18 We use a Nikon Diaphot inverted microscope with its oil-immersion darkfield condenser (NA=1.43 to 1.2) and a , NA=0.75, objective. The light source is the 50-W filament lamp normally used for brightfield. At the 35-mm camera port, a 1-in.-diam. lens tube is mounted via a Nikon bayonet-to-C-mount adapter (B&H Photo Video #GBCMN, New York). Light scattered into the objective is collected by a planoconvex lens mounted in the end of the lens tube proximal to the microscope. This light is then coupled into a , 0.22-NA multimode fiber mounted at the focus of the lens. The output of the optical fiber is spectrally resolved with a resolution of and digitized at 16 bits by a spectrometer (BWtek BTL111-OEM, Newark, Delaware). Figure 3 shows a schematic of this setup. Fig. 3Schematic of our darkfield spectroscopy setup. This experiment is built around a standard inverted microscope fit with a darkfield condenser. The oil-immersion darkfield condenser forms a hollow light cone that misses the objective. Light scattered from the cell monolayer is collected by the objective. This light is transmitted through the internal microscope optics to the camera port, where it is collected by an optical fiber via a lens mounted inside a lens tube. The scattered light is then spectrally resolved and detected by a spectrometer.  To measure darkfield spectra of cells grown on coverslips, the 25-mm-round coverslip is placed cell-side down on a second square No. 1 thickness coverslip to form a slide. Approximately of HBSS is placed between these two coverslips. The slide is then placed on the stage, as shown in Fig. 3, and brought into focus under darkfield using the eyepiece. A spectrum of the field is then taken with integration times of 3 to . The darkfield spectra were corrected for dark counts and the system spectral throughput. For each measurement, a dark spectrum was acquired and subtracted from the data. The spectral throughput of the system was measured by removing the darkfield condenser, which is reflective and should have minimal chromatic aberrations, and placing the diffusing plate described by Hull and Foster19 at the focus of the objective. As a second method of measuring the throughput, we created a slide as already described above with a paste of the scattering standard (Ref. 20) in water, and recorded a spectrum with the darkfield condenser in place. This second method gave us an identical correction spectrum. The darkfield spectrum is a wavelength-resolved measurement of light scattered from the sample and into the objective. As already stated, the NA range of the oil-immersion darkfield condenser is 1.43 to 1.2, which corresponds to an effective “air NA” of 0.94 to 0.8, and the objective has an NA of 0.75. These NAs are such that the smallest angle into which light could be scattered from the sample and into the objective is , and the largest angle is . Thus we can model our darkfield scattering spectrum, , as where is a constant, and is as written in Eq. 1. The signal as written in Eq. 2 is similar to an integration of our angularly resolved measurements already described.2.6.Mie Theory Fitting to Angularly Resolved Light Scattering DataA Mie theory model was fit to angularly resolved light scattering data by methods similar to those reported previously.7, 13 We assumed that our bulk light scattering signal was a sum of uncorrelated scattering from homogeneous spheres characterized by their radius and a refractive index of 1.4 surrounded by medium of refractive index of 1.38 to approximate organelles in cyotsol.10, 11 We further assumed that these spheres obeyed a particle size distribution that was a weighted sum of log normal distributions as Based on our previous results,13 we used a bimodal distribution in to model whole-cell scattering from those cells not subjected to NPe6. We used Mie theory to calculate the angular scattering distribution, , which in the language of Eq. 1 is writtenfor individual particles, and from these distributions we calculated test functions such thatThese are functions of six parameters, which are the means , widths (standard deviations) , and relative amplitudes for two populations. These parameters were adjusted by an iterative, nonlinear fit to minimize the functionwhere represents the th data point, is the corresponding value of the test function, and is the corresponding variance.To model changes in angularly resolved light scattering observed in the presence of NPe6, we fit an absorbing sphere model to our scattering data. Based on calculations presented in Sec. 3, we adopted a simplified absorbing sphere model in which the addition of absorption reduced the scattering cross section of an organelle population and had no effect on that population’s angular distribution of scattered light. We fit this to the control cell and NPe6-stained cell data simultaneously, letting be a trimodal version of Eq. 3 and forcing the particle size distribution to be the same for the two cell populations. We then built test functions for the two data sets independently as which are identical except for the constants , which is a model for the ratio of the scattering cross section of the stained population to its corresponding unstained population; and , which is an additional constant to account for any errors in the counting of the cell densities during the measurements.The two test functions are cumulatively governed by 11 input parameters, namely the means , widths , and relative amplitudes of the three populations and the additional two constants and . We then minimized the function where ’s, ’s, and ’s are as in Eq. 6 but for the control or NPe6-stained case.3.Results3.1.Angularly Resolved Scattering in the Presence of NPe6Informed by the excitation spectrum of NPe6 shown in Fig. 1, we investigated light scattering from cells loaded with this dye versus scattering from cells that were unstained using three different laser lines—488, 633, and —representing wavelengths of low, medium, and high NPe6 absorption, respectively. As shown in the top panel of Fig. 4 , the angular distributions of scattered light for both NPe6-loaded and control cells at are nearly indistinguishable. When these scattering data were fit by a Mie theory model, as described by Eqs. 5, 6, the fitting algorithm returned virtually identical parameters for the two cases that were consistent with studies presented in Wilson and Foster,13 providing evidence that NPe6 staining does not change overall cell or organelle morphology. Fig. 4Representative angularly resolved light scattering data for cells loaded with NPe6 (circles) and control cells (squares) at (A) 488, (B) 633, and (C) . At , the two curves are indistinguishable. At , the two curves are virtually identical in the forward- and side-scattering regions, but there is a reduction in scattering in the range 15 to in the NPe6-loaded cells. At , there is an angularly dependent scattering change similar to that at , but with a slightly larger angular range and with a larger magnitude near . 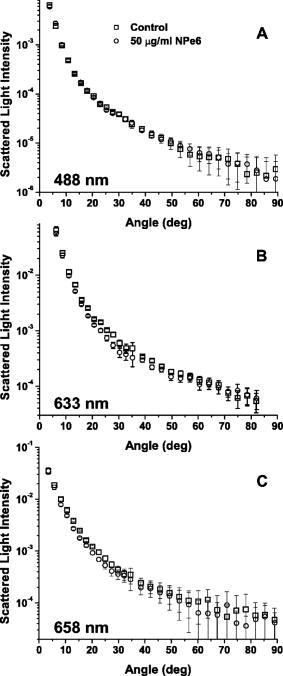 As shown in the middle panel of Fig. 4, there are differences in the angularly-resolved light scattering at between control cells and cells stained with NPe6. The two scattering spectra are very similar for scattering angles less than and for angles greater than , while the scattering changes are most pronounced near . The statistical significance of this change was assessed by a test between the control and Npe6-loaded data sets as described by Bevington and Robinson.21 We found a that the differences in these data sets were due to statistical fluctuations. This scattering change is dramatically inconsistent with the mitochondrial-type perturbations reported previously by Wilson, 7 where the scattering changes associated with mitochondrial swelling manifested themselves in the first . Within a Mie theory model, changes at these larger angles are consistent with scattering from particles smaller than mitochondria. The scattering comparison was made at a third wavelength, , chosen to be near NPe6’s absorption maximum. These data are displayed in the lower panel of Fig. 4. At this wavelength, we see a scattering change that is similar to that observed using , but with a slightly greater magnitude, both in the angular range and maximum relative intensity, again providing evidence for a chromatic effect. 3.2.Darkfield SpectroscopyUsing darkfield spectroscopy we were able to further establish the relationship between scattering changes and NPe6 absorption. As stated in Eq. 2, a darkfield spectrum is derived from wavelength-resolved measurements of scattering integrated over a range of angles defined by the NAs of the illumination and detection optics. Darkfield scattering spectra were acquired for cells grown on coverslips with and without incubation with NPe6. Representative spectra are shown in Fig. 5 . These two spectra are identical from approximately 480 to . Beyond , control cells scatter noticeably more light than cells loaded with NPe6. At wavelengths corresponding to the laser lines used in the angularly resolved study, the darkfield spectra reveal that control cells scatter the same amount of light into the objective at , roughly 4% more light at , and 6% more light at . The feature near that appears in the scattering spectrum of NPe6-loaded cells is fluorescence emission (see Fig. 1). When the darkfield spectra displayed in Fig. 5 are compared to the fluorescence excitation spectrum for NPe6 displayed in Fig. 1, we see that the magnitude of the scattering change scales with the absorption coefficient of NPe6. 3.3.Modeling Complex Refractive IndexAs observations both in darkfield spectroscopy and angularly resolved light scattering measurements suggest that light scattering changes were associated with the absorption band of NPe6 in lysosomes, we used Mie theory to model the effects of adding a dye with large absorption directly to organelles. Absorption in a particle is represented by the imaginary part of the particle’s complex refractive index as Figure 6 shows the mean scattering cross section of a candidate lysosomal population with a mean diameter of and a standard deviation of at . On the horizontal axis is from Eq. 9, and the various curves represent different values of spanning 1.4 to 1.6. As was observed by Kattawar and Plass,22 for particle sizes roughly the size of the incident wavelength there are regions of this space where increasing can serve to reduce the mean scattering cross section, and this effect is highly dependent on . For , which is near the value that has been reported for organelles in the literature,10, 11 there is negligible reduction in the mean scattering cross section as increases, whereas for higher values such as , the mean cross section can differ by as much as a factor of 2. Fig. 6Mie theory calculations of the mean scattering cross section at versus the imaginary part of the refractive index for a candidate population of lysosomes that obey a log-normal size distribution with mean and standard deviation of 0.7 and , respectively. The various curves represent populations with differing real parts of their refractive index. The horizontal axis was plotted on both a (A) linear and a (B) logarithmic scale. For particles with a high real part of the refractive index, the scattering cross section drops quickly with absorption for less than 0.1 as demonstrated in (A). For smaller real parts of the refractive index, this effect is negligible as shown in (B).  Similar forward calculations were made to determine what, if any, effects on the angular distribution of scattered light would occur with the addition of an absorber. The results of these are displayed in Figs. 7 and 8 . We chose to represent both and to bracket the range of refractive indices shown in Fig. 6. For , we found that for values of less than 0.1, there was very little change in the angular dependence of scattered light. For larger values of , there was a small shift in the angular distribution such that light scattered into large angles was as much as 15% higher relative to the light scattered into the forward direction. This is apparent in the lower panel of Fig. 7. For the case of , which is close to the reported refractive index of organelles,11 we examined a broad range of to look for any change in the angular distribution of scattered light. As displayed in Fig. 8, we saw no change in the angular distribution of light scattered for values of less than 0.1. For larger values, there was a slight shift in the angular distribution, however this cannot be responsible for our observed scattering changes already described, as for these values the scattering cross section increases (see Fig. 6). Fig. 7Mie theory calculations of the angular dependence of light scattering at for candidate populations of lysosomes with a mean size and standard deviation of 0.7 and , respectively, and and ranging from 0 to 0.2. The upper panel shows the differential cross section for the various . The lower panel displays the angularly resolved light scattering distribution of a nonabsorbing particle, the solid curve from the top panel, divided by that of a distribution with an as shown in the legend. These curves are then normalized to 1 at . 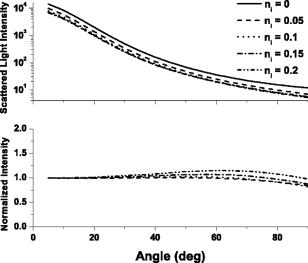 3.4.Angularly Resolved Scattering in the Presence of HPPHThe scattering changes induced by the addition of NPe6 raise the question of whether or not the phenomenon of adding absorption to mitochondria can also change the light scattering distribution from whole cells. To this end, angularly resolved light scattering measurements were taken for cells loaded with HPPH, which was specifically chosen for its high extinction and its strong localization to mitochondria. Multiple angularly resolved measurements were taken for control and HPPH-loaded cells at , which is near the absorption maximum of HPPH, as shown in Fig. 1. The results of these experiments are displayed in Fig. 9 . There were no discernable changes in angularly resolved light scattering between the control and HPPH-loaded cell groups. Fig. 9Representative angularly resolved light scattering data for cells loaded with HPPH (circles) and control cells (squares) at . There are no data points outside the error of the measurement. These data have been plotted over a smaller angular range to highlight the regions where we would expect to see any scattering changes due to mitochondria (0 to ) or lysosomes (20 to ). 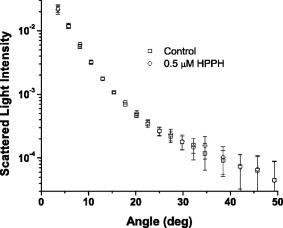 3.5.Fits to Angularly Resolved MeasurementsA Mie theory model for angularly resolved light scattering at was fit to both control and NPe6-stained cells individually using the methods outlined in Eqs. 5, 6. When fit individually, both data sets were compatible with a bimodal particle size distribution and were found to be incompatible with a trimodal distribution in particle size using this analysis. There was, however, a shift toward larger particles being responsible for the light scattering signal from NPe6-stained cells, consistent with a lower scattering cross section from NPe6-stained lysosomes. Informed by our calculations of scattering from spheres with a complex refractive index, we fit an absorbing sphere model to our angularly resolved light scattering data at using Eqs. 7, 8. As displayed in Fig. 6, the addition of absorption can have significant impact on the scattering cross section when the real part of the refractive index is sufficiently high. Also, there is minimal change in the angular distribution of scattered light for regions of Fig. 6, where is decreasing with increasing (see Fig. 7). Thus, in our model, the addition of NPe6 simply changes the scattering cross section of each lysosome by a dimensionless factor . Using the contrast between the angularly resolved light scattering measurements for NPe6-stained and the unstained cells at shown in Fig. 4B, we were able to isolate a third population made up of lysosomes, from Eq. 7, whose scattering cross sections changed in response to staining with NPe6. The parameters for this population obtained by fitting our model to five different data sets taken on different days returned particle size distributions typical of particles, with the exact values extracted varying from data set to data set within this range. To bracket the returned parameters, the smallest particle size distribution had a mean of with a standard deviation of , while the largest had a mean and standard deviation of 0.8 and , respectively. We found that varied between 0.7 and 0.2, with a typical value near 0.5. If we define the relative contribution to the total cross section of the ’th population as where the sum is over the three populations, then the contribution of this population was found to be between 10 and 16% of the scattering cross section. This is remarkably consistent with darkfield spectroscopy measurements at . We found experimentally that the darkfield signal was roughly 4% lower for NPe6-stained versus control cells at , and with from Eq. 7 being 0.5, our model for the angularly resolved data predicts that NPe6-stained cells scatter between 5 and 8% less light than control cells at this wavelength. Representative absorbing sphere fits to the data are displayed in Fig. 10 . To determine whether the returned fits for control and NPe6-stained cells were statistically different, we calculated the goodness of fit parameters21 for the best fits to the control and NPe6-stained data sets, which are the thin and thick solid lines in Fig. 10, respectively. We then asked whether the best fit to the control cell data was a good fit to the data from NPe6-stained cells and vice versa. In both of these mismatched cases, increased by a factor of 25.Fig. 10Angularly resolved light scattering data and absorbing sphere fit as described in the text. The fit parameters returned a stained population of spheres of sizes consistent with lysosomes. Table 1Summary of typical diameters [means ± standard deviation (std. dev.) of three populations of scatterers returned from simultaneous fits to angle-resolved scattering from NPe6-loaded and control cells.
The population numbers
ℓ
are defined in Eq. 7;
R
is the relative contribution to the total scattering cross section for each of the populations, as defined by Eq. 10 in the text.  An interesting result of this study is that when this trimodal absorbing sphere model was applied, the organelle population from Eq. 7, which was responsible for 75 to 85% of the signal, was virtually identical for each measurement that was made. This population was characterized by a mean particle size and standard deviation of 1.3 and , respectively. The mean size extracted by our trimodal model for this population was slightly larger, 1.3 versus , than for a similar population reported previously in Wilson and Foster,13 which was attributed to a combination of mitochondria and lysosomes. This discrepancy is consistent with the smaller organelles, lysosomes, now being isolated from this population in the absorbing-sphere trimodal model, and the size parameters for here principally representing mitochondria. The final population, from Eq. 7, with a contribution to the total scattering cross section, of only 5%, was characterized by particles with a mean size and a standard deviation of 0.2 and , which is very similar to the population previously identified in Wilson 7 to be made up of secretory granules or other small subcellular compartments. The three populations, their mean diameters, and their contributions to the scattering cross sections in whole cells are summarized in Table 1 . 3.6.Scattering from Cells Stained with Mito- and LysoTracker DyesNPe6 and HPPH were chosen for their organelle selectivity and high extinction, as well as for their red absorption bands, which could be readily sampled by our lasers. To address whether or not these observations could be repeated using more common organelle-specific stains, we chose LysoTracker Green and MitoTracker Deep Red. We observed changes in angularly resolved scattering between cells stained with LysoTracker Green and control cells at that were consistent with particles when both data sets were fit simultaneously using Eqs. 7, 8. There were no scattering changes in angularly resolved light scattering between these two cell groups when the measurement was made at . When angularly resolved scattering was measured from cells loaded with MitoTracker Deep Red versus control cells at , no changes were observed (data not shown). 4.DiscussionThe data presented in this paper demonstrate a phenomenon that, to the best of our knowledge, has not been described before. We found that adding a lysosome-specific, strongly absorbing dye to EMT6 cells affects the scattering of light from these cells. At wavelengths near the absorption maximum of NPe6, scattering changes manifested themselves both in an angularly resolved and integrated sense. Using a combination of angularly-resolved scattering measurements at three different wavelengths (Fig. 4) and a method to obtain a wavelength-resolved measurement of angle-integrated scattering (Fig. 5), we were able to show that these effects were prominent only in regions of significant NPe6 absorption. Because this phenomenon occurs only at wavelengths where absorption is high, it cannot be due to an NPe6-induced morphology change. The forward calculations shown in Fig. 6 are striking in terms of how differently the average scattering cross section of these particle populations responds to the addition of an absorber, depending on the real part of the inherent refractive index. For organelle refractive indices reported in the literature, which are near 1.4, increasing the imaginary refractive index has little effect on the scattering cross sections for modest absorptions. As shown in Fig. 6, for regions of very high absorption the scattering cross section increases for all values of . The physical interpretation of this is one of a particle becoming increasingly metallic,23 which is an effect that is likely beyond what could be achieved by staining an organelle. In addition, for weakly absorbing particles, increases as the real part of the refractive index increases. As noted by Fang, 8 within the Rayleigh-Gans approximation for nonabsorbing particles, the cross section should be proportional to , where is the ratio of the refractive index of the particle to that of the surrounding medium. In light of Fig. 4A, where we see no significant scattering changes between the NPe6-labeled and unlabelled cell populations at , we conclude that the addition of NPe6 to lysosomes has little effect on the real part of their refractive index. When the absorbing sphere model for scattering changes, represented by Eq. 7, was fit simultaneously to the angularly resolved scattering data obtained from control and NPe6-labeled EMT6 cells, the most interesting parameter to consider from the fitting algorithm was . We did not attempt to directly extract the refractive index of lysosomes by fitting an exact absorbing sphere Mie theory model to the data, but this parameter served as an approximation to it. In almost all measurements, we obtained a value for near 0.5. If we assume that the NPe6 staining brought the mean cross section in Fig. 6 from its nonabsorbing value to its minimum value, which is modeled by the parameter , then we must conclude that the real refractive index of lysosomes in this cell line is near 1.6. Indeed, in Fig. 6, the curve is the only one that exhibits absorption-induced changes consistent with . When the absorbing sphere model was applied to angularly resolved scattering at from control and NPe6-loaded cells, the fitting algorithm returned parameters that were consistent with a stained lysosomal population, though the size distributions that were recovered showed some variability. From the analysis shown in Fig. 7, we were probably underestimating the contribution of NPe6-stained lysosomes at angles greater than during fits, as this is where our approximation that the addition of absorption did not change the angular distribution of scattering for the lysosomal population is least valid. This assumption may have contributed to some minimal parameter crosstalk. Therefore, we are not proposing this study as a method to accurately size lysosomes by using an organelle-specific staining contrast agent in scattering measurements. However, the size distributions captured by these fits provide sound evidence that we are in fact observing lysosomes. To the best of our knowledge, these are the first scattering signatures from intact cells identified to come directly from lysosomes reported in the literature. When we examined angularly resolved light scattering measurements from cells stained with HPPH at a wavelength near its absorption maximum, we did not see any discernable scattering changes between the HPPH-loaded and control cells. The concentrations of HPPH used in these measurements were guided by the literature16 as well as from fluorescence microscopy that we performed to maximize the intracellular concentration while retaining selectivity to mitochondria. It is not surprising that there were no scattering changes between control and HPPH-loaded cells in light of Figs. 6 and 8. For indices of refraction of mitochondria cited in the literature, near 1.4, there should be no absorption-induced scattering changes. The fact that a study designed to stain mitochondria with a high extinction dye revealed no changes in the scattering provides strong evidence that the refractive index of mitochondria differs significantly from that of lysosomes. We cannot leave this discussion without commenting on what this study implies about the mitochondrial contribution to our observed scattering signals. From the HPPH staining experiments, we conclude that the refractive index of these mitochondria is within the range reported in the literature. When we fit our absorbing-sphere model to the NPe6-stained and control cell data at , we extracted information about a population of light scattering centers within cells, from Eq. 7, with a mean diameter and standard deviation of 1.3 and , respectively, that scatters between 75 and 85% of the light. This represents a population that is similar to that reported in Wilson and Foster,13 which had a mean diameter and standard deviation of 1.1 and , respectively. In that earlier report, we concluded that this signal originated from a mixture of mitochondria and lysosomes. In this paper, we focused on isolating the contribution to the scattering signal from the NPe6-stained lysosomes. As mitochondria are larger organelles than lysosomes, the larger mean size extracted in this paper, 1.3 versus 1.1, is not surprising. We believe that the population extracted in this study represents the mitochondria and is relatively free from contamination from scattering associated with lysosomes. This lends further evidence to support previous assertions that mitochondria scatter a large majority of the light from EMT6 cells at and that scattering measurements from these cells are very sensitive to mitochondrial morphology. The results of this study are significant in that they are the first to effectively isolate a lysosomal population of light scattering centers within cells, as well as demonstrate a refractive index difference between two organelle populations. We also believe that the observation that staining can cause scattering changes from certain organelle populations is important in that this could inform the data analysis for other researchers studying cell morphology with light scattering. A future study that this paper suggests is a complete characterization of the lysosomal contribution to whole-cell scattering. NPe6, with proper irradiation, has the ability to deposit oxidative stress to lysosomes in much the same way that aminolevulinic acid-induced protoporphyrin IX was used to perturb mitochondria.7 Since we now have an understanding of how these staining effects can influence the scattering data, this should be relatively straightforward. As we continue to generate knowledge about how individual organelle populations contribute to whole-cell light scattering signals, light scattering measurements can fulfill their promise as an important tool for studying morphology in cell biology. AcknowledgmentsThe authors are grateful to the Light Sciences Corporation for the gift of NPe6 and to Dr. Ravindra Pandey, with support from National Institutes of Health (NIH) grant P01 CA55791, for the gift of HPPH. WJC acknowledges support from NIH training grant T32 HL66988. This work was supported by NIH grant CA68409 awarded by the National Cancer Institute. ReferencesL. T. Perelman,
V. Backman,
M. Wallace,
G. Zonios,
R. Manoharan,
A. Nusrat,
S. Shields,
M. Seiler,
C. Lima,
T. Hamano,
I. Itzkan,
J. Van Dam,
J. M. Crawford, and
M. S. Feld,
“Observation of periodic fine structure in reflectance from biological tissue: a new technique for measuring nuclear size distribution,”
Phys. Rev. Lett., 80 627
–630
(1998). https://doi.org/10.1103/PhysRevLett.80.627 0031-9007 Google Scholar
V. Backman,
R. Gurjar,
K. Badizadegan,
L. Itzkan,
R. R. Dasari,
L. T. Perelman, and
M. S. Feld,
“Polarized light scattering spectroscopy for quantitative measurement of epithelial cellular structures in situ,”
IEEE J. Sel. Top. Quantum Electron., 5 1019
–1026
(1999). https://doi.org/10.1109/2944.796325 1077-260X Google Scholar
A. Wax,
C. Yang,
V. Backman,
K. Badizadegan,
C. W. Boone,
R. R. Dasari, and
M. S. Feld,
“Cellular organization and substructure measured using angle-resolved low-coherence interferometry,”
Biophys. J., 82 2256
–2264
(2002). 0006-3495 Google Scholar
N. N. Boustany,
R. Drezek, and
N. V. Thakor,
“Calcium-induced alterations in mitochondrial morphology quantified in situ with optical scatter imaging,”
Biophys. J., 83 1691
–1700
(2002). 0006-3495 Google Scholar
N. N. Boustany,
Y. C. Tsai,
B. Pfister,
W. M. Joiner,
G. A. Oyler, and
N. V. Thakor,
“BCL-xL-dependent light scattering by apoptotic cells,”
Biophys. J., 87 4163
–4171
(2004). 0006-3495 Google Scholar
G. Schuele,
E. Vitkin,
P. Huie,
C. O’Connell-Rodwell,
D. Palanker, and
L. T. Perelman,
“Optical spectroscopy noninvasively monitors response of organelles to cellular stress,”
J. Biomed. Opt., 10 051404
(2005). https://doi.org/10.1117/1.2075207 1083-3668 Google Scholar
J. D. Wilson,
C. E. Bigelow,
D. J. Calkins, and
T. H. Foster,
“Light scattering from intact cells reports oxidative-stress-induced mitochondrial swelling,”
Biophys. J., 88 2929
–2938
(2005). https://doi.org/10.1529/biophysj.104.054528 0006-3495 Google Scholar
H. Fang,
M. Ollero,
E. Vitkin,
L. M. Kimerer,
P. B. Cipolloni,
M. M. Zaman,
S. D. Freedman,
I. J. Bigio,
I. Itzkan,
E. B. Hanlon, and
L. T. Perelman,
“Noninvasive sizing of subcellular organelles with light scattering spectroscopy,”
IEEE J. Sel. Top. Quantum Electron., 9 267
–276
(2003). https://doi.org/10.1109/JSTQE.2003.812515 1077-260X Google Scholar
R. Drezek,
A. Dunn, and
R. Richards-Kortum,
“Light scattering from cells: finite-difference time-domain simulations and goniometric measurements,”
Appl. Opt., 38 3651
–3661
(1999). 0003-6935 Google Scholar
J. Beuthan,
O. Minet,
J. Helfmann,
M. Herrig, and
G. Muller,
“The spatial variation of the refractive index in biological cells,”
Phys. Med. Biol., 41 369
–382
(1996). https://doi.org/10.1088/0031-9155/41/3/002 0031-9155 Google Scholar
H. Liu,
B. Beauvoit,
M. Kimura, and
B. Chance,
“Dependence of tissue optical properties on solute-induced changes in refractive index and osmolarity,”
J. Biomed. Opt., 1 200
–211
(1996). https://doi.org/10.1117/12.231370 1083-3668 Google Scholar
J. R. Mourant,
T. M. Johnson,
S. Carpenter,
A. Guerra,
T. Aida, and
J. P. Freyer,
“Polarized angular dependent spectroscopy of epithelial cells and epithelial cell nuclei to determine the size scale of scattering structures,”
J. Biomed. Opt., 7 378
–387
(2002). https://doi.org/10.1117/1.1483317 1083-3668 Google Scholar
J. D. Wilson and
T. H. Foster,
“Mie theory interpretations of light scattering from intact cells,”
Opt. Lett., 30 2442
–2444
(2005). https://doi.org/10.1364/OL.30.002442 0146-9592 Google Scholar
J. J. Reiners Jr., J. A. Caruso,
P. Mathieu,
B. Chelladurai,
X. M. Yin, and
D. Kessel,
“Release of cytochrome c and activation of pro-caspase-9 following lysosomal photodamage involves Bid cleavage,”
Cell Death Differ, 9 934
–944
(2002). 1350-9047 Google Scholar
R. K. Pandey,
A. B. Sumlin,
S. Constantine,
M. Aoudla,
W. R. Potter,
D. A. Bellnier,
B. W. Henderson,
M. A. Rodgers,
K. M. Smith, and
T. J. Dougherty,
“Alkyl ether analogs of chlorophyll-a derivatives: Part 1. Synthesis, photophysical properties and photodynamic efficacy,”
Photochem. Photobiol., 64 194
–204
(1996). 0031-8655 Google Scholar
I. J. MacDonald,
J. Morgan,
D. A. Bellnier,
G. M. Paszkiewicz,
J. E. Whitaker,
D. J. Litchfield, and
T. J. Dougherty,
“Subcellular localization patterns and their relationship to photodynamic activity of pyropheophorbide-a derivatives,”
Photochem. Photobiol., 70 789
–797
(1999). https://doi.org/10.1562/0031-8655(1999)070<0789:SLPATR>2.3.CO;2 0031-8655 Google Scholar
C. F. Bohren and
D. R. Huffman, Absorption and Scattering of Light by Small Particles, Wiley, New York (1998). Google Scholar
A. Curry,
G. Nusz,
A. Chilkoti, and
A. Wax,
“Substrate effect on refractive index dependence of plasmon resonance for individual silver nanoparticles observed using darkfield micro-spectroscopy,”
Opt. Express, 13 2668
–2677
(2005). https://doi.org/10.1364/OPEX.13.002668 1094-4087 Google Scholar
E. L. Hull and
T. H. Foster,
“Steady-state reflectance spectroscopy in the P-3 approximation,”
J. Opt. Soc. Am. A, 18 584
–599
(2001). 0740-3232 Google Scholar
J. R. Lakowicz, Principles of Fluorescence Spectroscopy, 2nd ed.Kluwer Academic/Plenum, New York (1999). Google Scholar
P. R. Bevington and
D. K. Robinson, Data Reduction and Error Analysis for the Physical Sciences, 3rd ed.McGraw Hill, New York (2003). Google Scholar
G. W. Kattawar and
G. N. Plass,
“Electromagnetic scattering from absorbing spheres,”
Appl. Opt., 43 1377
–1382
(1967). 0003-6935 Google Scholar
E. Hecht, Optics, Addison Wesley, San Francisco (2002). Google Scholar
|