|
|
1.IntroductionSkin is usually described as consisting of two mayor layers, the dermis and the epidermis. The main dermis constituents are collagen, elastic tissue, and blood vessels, and it acts as a supportive layer for the epidermis.1 The main epidermis function is maintenance, yielding a continuous renewal of the skin’s outermost layer, the stratum corneum. In the epidermis, keratinocytes move from the basal cell layer up to the stratum corneum and undergo dramatic structural as well as biochemical changes. In the stratum corneum, the keratinocytes become dead cornified cells, so called corneocytes, which shed off the skin by the daily mechanical and chemical wear. They are replaced by the on-moving keratinocytes from below. The stratum corneum functions as a highly efficient barrier for the body against chemical and biological agents. It facilitates prevention of dehydration of the organism and protection. This is possible by the combination of highly packed keratin filaments in the cells and lipid layers surrounding the cells, resulting in a barrier that is impermeable for hydrophobic agents. While highly efficient, the stratum corneum has only a thickness of 10 to , depending on the position on the body and its exposition to mechanical wear. The optical properties of skin are still subject to discussion.2 Since the optical parameters are dependent on the structural and chemical properties of the material, it is clear that the rapid biochemical change of the keratinocytes across the epidermis as well as the difference in water content from physiological levels to environmental levels will result in a change in refractive index and absorption coefficient of the material. The refractive index of tissues is sometimes estimated using the known dispersion of its main constituents, or measured using destructive methods.2, 3 The refractive index is then assumed to be the same over the whole depth of the skin, and the layered structure of the skin is not taken into account. Other approaches to measure optical parameters of tissues are, e.g., optical coherence tomography and depolarization measurements. They can help only in acquiring4, 5, 6 depth profiles for the refractive index . The absorption coefficient cannot be acquired with these techniques. However, the absorption coefficient is a quantity necessary to completely describe optics in tissues. Therefore, a technique that is able to measure both parameters is required. Ellipsometry can measure these two quantities within one single measurement. Therefore, the complete complex refractive index containing as the real part the refractive index and as the imaginary part the absorption coefficient can be measured. Furthermore, ellipsometry does not rely on depolarization of light on scattering in all directions, but uses only the directly reflected light to determine the complex refractive index. Knowledge of the behavior of the complex refractive index over the skin can deliver data about the changes that occur during the differentiation of the keratinocytes. Also, knowledge of the depth-dependent complex refractive index of skin is important for the interpretation of other optical techniques. Scattering methods usually profit greatly from a detailed knowledge of the refractive index, since this is required to estimate the optical path length.3 Determining information for numerous structural parameters of the skin out of one single, fast measurement is highly desirable and can be achieved using spectrally resolved ellipsometry. In this paper, we propose to use the advantages of spectral ellipsometry such as low power density, high sensitivity, and gathering many parameters within one single and fast measurement on in vivo tissue. Our study found that the optical ellipsometry technique is highly sensitive to both the biochemical and the morphological parameters of skin. The feasibility of in vivo measurements is demonstrated with a tape-stripping method, in which we study the variation of the ellipsometric parameters and as a function of depth into the stratum corneum. The tape-stripping procedure changes the morphology of the skin in a relatively controlled way. The variation of the ellipsometric parameters can be described by the change in complex refractive index across the stratum corneum and by assuming a model accounting for interface roughnesses and the alternating corneocyte and lipid layers. The model yields structural parameters such as corneocyte thicknesses, lipid layer thicknesses, and surface roughness parameters, which are within a sensible region. Once a model has been established, all of these parameters can be determined from single measurement. 2.Experimental Details2.1.EllipsometryEllipsometry is a technique for establishing optical and structural parameters of complex layered systems. It is known in solid state physics for its accuracy and the low power densities in the probe beam that hardly influence the samples.7 In ellipsometry, linear or circular polarized light is reflected by the sample under an angle . The change in polarization on reflection is analyzed using a rotating polarizer. The measured intensity changes are converted to the ellipsometric parameters and , which are linearly independent. These parameters signify the change in polarization due to the refractive index mismatch between different structural features of the system and are restricted to the range 0 to . They are calculated using only intensity ratios measured at different analyzer angles. Therefore, this technique is self-normalizing, which results in its high accuracy. The basic equation for ellipsometry is where and are the complex reflection coefficients for the components of the light being parallel and perpendicular to the plane of incidence, respectively7 (see Fig. 1 ).Fig. 1Basic layout of an ellipsometry measurement. Light is emitted by the source and linearly polarized with a polarizer angle . The intensity of the directly reflected light under an angle is measured at the detector as a function of the analyzer angle . 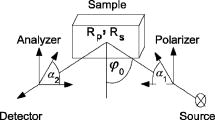 The ellipsometer used for all measurements is a Sentech SE850 with custom-made extensions for the deep-UV region. Its light source in the visible and UV wavelength range is a xenon gas discharge lamp. The light is coupled into the arm emitting the light via a glass fiber. The reflected light is coupled into a second glass fiber and detected using a grating and a photodiode array. The usage of a photodiode array enables the detection of the whole wavelength region from 220 to in one measurement. To compensate for the high surface roughness of the skin, focusing units were used for all measurements. These microprobes focus the emergent beam from a diameter of down to a diameter of . Since Eq. 1 assumes a parallel beam, it must be integrated over the angles given by the usage of a focused beam. Test measurements on silicon wafers, however, show that the resulting error can be estimated to be less than in and for our lenses with a small numerical aperture and, therefore, weak focusing. 2.2.Basic EquationsThe ellipsometric parameters and describe the change in polarization of the light beam due to the influence of a sample. To extract the physical parameters of the sample like refractive index, one must make a model of the investigated system. Assuming a homogeneous, infinitely thick sample, or a so-called bulk system, the reflection parameters and from Eq. 1 are the well-known Fresnel coefficients, and the ellipsometric parameters can be transformed into the complex refractive index of the sample according to where is the complex refractive index of the ambient, which is usually air and can be set in good approximation to 1. In this case, the values of are restricted7 to 0 to .To model the influence of small particles with refractive index embedded in a host medium with refractive index , the effective medium approximation is used. It states that the net effect of both constituents can be modeled as a single medium with complex refractive index given by where is the volume percentage of the embedded material.7A sample consisting of homogeneous, isotropic layers where each layer is characterized by its complex refractive index can be modeled using a matrix formalism.7 The different layers are modeled by matrices. For each polarization component, the interface between two layers and is described by an interface matrix , which accounts for the change in polarization due to index mismatch between the layers and depends on the Fresnel coefficients of the interface. The change in polarization due to the thickness and the complex refractive index of a layer is modeled by a layer matrix . From the matrix product of the interface and layer matrices of all layers scattering matrices and for both linear polarization components can be computed Here, the indexes and refer to the parallel and the perpendicular polarizations.The ratio of the complex reflection coefficients required to analyze Eq. 1 can then be calculated to be The influence of surface roughnesses, which are much smaller than the incident wavelength, can be modeled in this framework by introducing a roughness layer. The complex refractive index of the roughness layer is then given by an effective medium approximation where the two constituents are given by the two adjacent layers.7 Equation 5 cannot be analytically inverted for the unknown parameters. Therefore, it must be fitted numerically to the measured spectra to yield the parameters of interest, such as complex refractive indices, layer thicknesses, inclusion ratios in layers described by effective medium approximations, and roughness parameters. 2.3.ExperimentThe skin of the left middle finger just above the nail from different volunteers was measured by in vivo ellipsometry. No special treatment was performed prior to the measurements. To immobilize the arm we used a custom made arm rest. Measurements were performed in a wavelength range from 300 to . Layers of skin were removed with a tape stripping procedure. Adhesive tape was applied onto the skin and ripped off. With each strip, approximately one cell layer is removed with a thickness of about . This procedure should be effective up to about 10 strips, since after that the glue does not stick to the corneocytes effectively.8 After a tape strip, ellipsometric measurements were performed. For the measurement, the sample was moved through the focus and the raw intensity spectrum at defined polarizer and analyzer angle was observed. The measurement was started when the raw intensity reached its maximum value. The acquisition time for one spectrum was 20 seconds. Since the immobilization of the hand was not perfectly achieved, at least five measurements were made for each strip. The maximum intensity, which should stay roughly constant during one measurement, was monitored online. Loss of the focus position due to movements of the hand was thereby identified, and the corresponding measurements were not considered in the analysis. Up to 55 strips were performed. To reduce the effects due to the hand moving between the measurements, the spectra belonging to the same strip were averaged. Furthermore, mean values of several wavelength regions of the averaged spectra were computed, because the spectral features of the measurements can vary considerably between measurements due to the local variations in morphology and chemical composition of the skin resulting from slightly different positions of the beam. Also, movements during a single measurement can alter the spectral information. 3.ResultsFigure 2 shows averaged spectra of and from different tape strips of one person and a comparison to previous hydration experiments on human fingernails.9 The error bar signifies the standard deviation of five measurements. It can be seen that with increasing strip number both and are increasing. The change in both parameters is larger than the error bars, resulting from averaging the measurements belonging to one strip. The changes in are less distinct, which is not surprising, since the determination of in ellipsometry is more difficult for nearly transparent media such as the stratum corneum. Fig. 2Left column, averaged and spectra for different tape strips from one person; right column: and spectra of human fingernails after different immersion times in water. 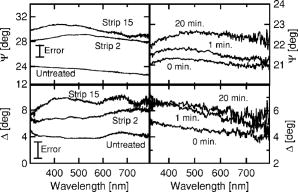 The observed behavior of and is similar to the results of previous hydration experiments in vitro on human fingernails.9 The increase in can be explained by an effective medium taking into account the skin host medium and water. The increase in cannot be understood in this model. For transparent media such as water, the value of approaches zero. Therefore, an increase in water content alone would result in an decrease of . The increase can be understood, however, by taking into account the presence of water bound by hydrogen bonds to the protein matrix.9 Also, other chromophores such as melanin, which introduce additional absorptions, become more important with increased depth into the skin.10 Finally, a layered structure of the sample can influence the behavior of the ellipsometric parameters as well. The wavelength averaged spectra were plotted against the strip number and fitted with an exponential function Figure 3 shows the result of this fit for a wavelength average from 400 to for three different persons. The values for the parameters in Eq. 6 can be found in Table 1 . Initial values of are around 24.5 with a decay constant of 1 to 4. With a steady state criterion of , we can see that after approximately a steady state is reached, assuming that each layer has a thickness of . This is in accord with previous publications,8 which showed that the adhesive tape loses its effectiveness in removing cells after a few strips. Only for at most the first 10 tape strips one can therefore expect that a tape strip removes a single cell layer. The differences between the development of of different persons can be attributed to the interindividual biological variations. Fig. 3Mean value of averaged spectra in the wavelength region 400 to versus tape strip number from three different volunteers; lines are fits of Eq. 6 to the measurements. 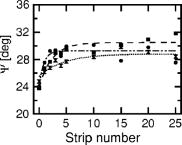 Table 1Values of the fit parameters for Eq. 6 of the measurements shown in Fig. 3.
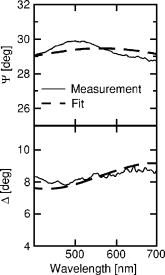
3.1.ModelingWhile a qualitative explanation of the development of and can be made as already outlined, a simple bulk model according to Eq. 2 is not sufficient to describe the spectra. A conversion using the simple bulk model from Eq. 2 results in spectra that have values of . Since the refractive index of water is in the visible,11 a higher water content in the skin layer results in a lowering of the observed toward 1.33, because water is the dominant constituent of biological media. A decrease below this value is unlikely, since the other constituents of skin can be expected to be optically denser. Thus, should always be larger than 1.33. A first analysis applying an effective medium approximation using Eq. 3 with tissue host material and embedded water droplets was only able to describe the spectra of , but not the spectra of . Taking into account that the refractive index is mostly influenced by , and that the absorption coefficient is mostly influenced by , this result can be seen as clear evidence not only for applying a more realistic model, but also that it is necessary to have information about the absorption coefficient to completely understand the optical parameters in tissues. A better description of the spectra of both and can be achieved only by assuming a model that accounts for surface roughness effects and the internal structure of the stratum corneum. The model is schematically depicted in Fig. 4 . It assumes four constituents, a dry host medium, a medium comprised of skin lipids, water, and air. Using Eqs. 4, 5, the alternating occurrence of corneocytes and lipid layers is modeled by an alternating sequence of isotropic, homogeneous layers. An effective medium of the host material and water with a volume ratio of constitutes the cell layer material. Another effective medium of the same host material and the skin lipids with volume ratio constitutes the lipid layer material. The thicknesses of the cell and lipid layers are given by the parameters and , respectively. Finally, the roughness is modelled by an effective medium of the cell layer and air with volume ratio and a layer thickness . Up to six subsequent corneocyte and lipid layers were used in the modeling. The analysis of a representative measurement is described in the following. Fig. 4Morphological model of the stratum corneum with surface roughness ( , air content; , roughness layer thickness) and alternating cell and lipid layers ( , water content; , cell layer thickness; , lipid layer thickness; , lipid content; and , distance into the skin).  For this analysis, the water content was assumed to follow a gradient, as given in Fig. 5 with values ranging from 15 to 19%. For this gradient, it was assumed that the development of the water content follows the same behavior as the measured values of , as shown in Fig. 3. To determine the refractive indices and absorption coefficients of the host medium and the lipid layer, the four parameters were assumed to be constant over the whole wavelength range. The assumption of a constant host dispersion is reasonable, as previous measurements on nails as a biochemically similar system showed a mostly flat dispersion.9 Then a simultaneous fit of the first five tape strips was made, where the refractive indices and the absorption coefficients of host and lipid layer were equal for each strip. This fit results in estimates for the unknown optical constants of the host and the lipid medium. Fig. 5Fit results for the measurements on one person: (a) assumed water content development , (b) air content of the roughness layer, (c) lipid content of the lipid layer, (d) thickness of the roughness layer, (e) thickness of the cell layer, and (f) thickness of the lipid layer. 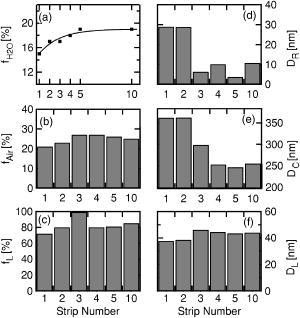 The complex refractive indices derived in the first step were then used in fits of every single tape strip measurement. Therefore, only the roughness parameters, the layer thicknesses, and the inclusion percentage in the lipid layer were varying parameters in the optimization procedure. The result of a such a fit to the measured ellipsometric parameters is shown in Fig. 6 . It can be seen that the modelling of surface roughnesses and the internal structure results in an additional oscillation that effectively offsets the resulting to a higher value. Also, the shape of the spectrum is qualitatively followed by the fitted data. Table 2Values of the optical parameters assuming a constant dispersion for the cell layer composed of the host material and water.
The host material has values of
n=1.436
for the refractive index and
k=0.273
for the absorption coefficient. The lipid layer has values of
n=1.471
and
k=0.273
. The values for the lipid layer are independent from the depth in the stratum corneum, and therefore from the tape strip number. The numerically fitted values of the layer thicknesses and the effective media inclusions are given in Fig. 5. The thickness of the roughness layer drops sharply from values of approximately 30 to values below , while the air content stays roughly constant at around 27%. This is consistent with the view that for the first strips, the surface roughness of a corneocyte is dominated by the surface proteins, e.g., desmosomes with typical dimensions of up to . For subsequent strips, the surface roughness of the cell is diminished, since the break occurs within the lamellar lipid layer. At the same time, the thickness of the corneocytes shows values of around 350 to . This is within the expected range, since a single corneocyte has a thickness12 of 200 to . Finally, the percentage of lipids in the lipid layer has a high value of 80% and more, while the thickness of the lipid layer has a value of approximately 40 to . Again, this is consistent13 with values for the thickness of the lipid lamella of 40 to . The values for the parameters of the complex refractive index, the refractive index , and the absorption coefficient of the cell layers of the strips, thereby the depth profile of these parameters, are given in Table 2 . The host material has values of for the refractive index and for the absorption coefficient. The lipid layer has values of and . The values for the lipid layer are independent from the depth in the stratum corneum, and therefore from the tape strip number. 4.ConclusionThe measurements and the mathematical analysis performed in this paper demonstrate that ellipsometry can be used to investigate tissues in vivo. The low power density is advantageous for in vivo measurements. In particular, we performed an in vivo tape strip study of human skin. The tape-stripping removes subsequent cell layers of the skin, resulting in a scan through the various depths of the stratum corneum. The behavior of the ellipsometric parameters and can be modeled using a model with interface roughnesses and alternating corneocyte and lipid layers. Assuming a water content from 15 to 19%, we derive values for the roughness parameters of and . The calculated values for the corneocyte thickness of to and the parameters for the lipid layers of to and are within the range of published values. Once the model has been established, we can determine a number of parameters for which one would usually require more than one measurement. This is of great importance when studying the “functional behavior” in bioorganic tissues, as you can study many parameters simultaneously. The further development of the experimental instrumentation, the extension of our model to other important chromophores of the skin, and the further understanding of the important morphological parameters are the focus of our work. More studies applying the spectral ellipsometry to bioorganic tissue in vivo and ex vivo are being completed. AcknowledgmentsWe thank M. Berneburg and R. Wepf for many discussions. We acknowledge financial support for this work via Beiersdorf AG Hamburg and DFG through Ru 773/2-2 and Ru 773/2-3. ReferencesF. Parker, Structure and Function of the Skin, 1
–14 Prentice Hall International, London (1991). Google Scholar
F. P. Bolin,
L. E. Preuss,
R. C. Taylor, and
R. J. Ference,
“Refractive index of some mammalian tissues using a fiber optic cladding method,”
Appl. Opt., 28 2297
–2303
(1989). 0003-6935 Google Scholar
T. L. Troy and
S. N. Thennadil,
“Optical properties of human skin in the near infrared wavelength range of 1000 to ,”
J. Biomed. Opt., 6 167
–176
(2001). https://doi.org/10.1117/1.1344191 1083-3668 Google Scholar
A. Knüttel,
S. Bonev, and
W. Knaak,
“New method for evaluation of in vivo scattering and refractive index properties obtained with optical coherence tomography,”
J. Biomed. Opt., 9 265
–273
(2004). https://doi.org/10.1117/1.1647544 1083-3668 Google Scholar
S. L. Jacques,
J. C. Ramella-Roman, and
K. Lee,
“Imaging skin pathology with polarized light,”
J. Biomed. Opt., 7
(3), 329
–340
(2002). https://doi.org/10.1117/1.1484498 1083-3668 Google Scholar
A. G. Matoltsy and
C. A. Balsamo,
“A study of components of the cornified epithelium of human skin,”
J. Biophys. Biochem. Cytol., 1
(4), 339
–360
(1955). 0095-9901 Google Scholar
R. M. A. Azzam and
N. M. Bashara, Ellipsometry and Polarized Light, 4th ed.Elsevier Science B.V., Amsterdam (1999). Google Scholar
F. Pflücker,
H. Hohenberg,
E. Hölzle,
T. Will,
S. Pfeiffer,
R. Wepf,
W. Diembeck,
H. Wenck, and
H. Gers-Barlag,
“The outermost stratum corneum layer is an effective barrier against dermal uptake of topically applied micronized titanium dioxide,”
Int. J. Cosmet. Sci., 21 399
–411
(1999). 0142-5463 Google Scholar
B. Schulz,
D. Chan,
J. Bäckström,
M. Rübhausen,
K. P. Wittern,
S. Wessel,
R. Wepf, and
S. Williams,
“Hydration dynamics of human fingernails: an ellipsometric study,”
Phys. Rev. E, 65 061913-1
–061913-7
(2002). https://doi.org/10.1103/PhysRevE.65.061913 1063-651X Google Scholar
A. R. Young,
“Chromophores in human skin,”
Phys. Med. Biol., 42 789
–802
(1997). https://doi.org/10.1088/0031-9155/42/5/004 0031-9155 Google Scholar
J. D. Jackson, Classical Electrodynamics, Wiley, New York (1975). Google Scholar
T. Richter,
J. H. Müller,
U. D. Schwarz,
R. Wepf, and
R. Wiesendanger,
“Investigation of the swelling of human skin cells in liquid media by tapping mode scanning force microscopy,”
Appl. Phys. A, 72
(Suppl.), 125
–128
(2001). 0947-8396 Google Scholar
G. H. Imokawa,
H. Kuno, and
M. Kawai,
“Stratum corneum lipids serve as a bound-water modulator,”
J. Invest. Dermatol., 96 845
–851
(1991). 0022-202X Google Scholar
|

