
|
|
1.IntroductionThere has been an increasing incidence of carcinomas of the gastroesophageal junction in the Western industrialized countries in recent years. Radical esophageal resection is the only potentially curative therapeutic option currently available.1, 2 Despite constant progress in surgical management, radical resection is still associated with a high morbidity and mortality rate.3 An alternative therapeutic strategy is photodynamic therapy (PDT),4, 5, 6, 7, 8, 9 a nonthermal technique in which the interaction between a photosensitizer and light of a specific wavelength leads to phototoxic cell destruction in tissue.10, 11 Besides the concentration of the photosensitizer, the diffusion of light in tissue is responsible for the extent of tumor destruction.12 To prevent complications such as perforations and stenoses, several factors must be taken into account during clinical application. Apart from the concentration of the photosensitizer and the choice of the time interval between the application and the irradiation, other important parameters for the successful use of PDT are the duration of exposure and the light dose. Knowledge about the behavior of light in the specific tissue is imperative, since the therapeutic effect depends primarily on the amount of light absorbed.13, 14 In this connection, the penetration depth of light is dependent on the optical tissue parameters (absorption coefficient , scattering coefficient , anisotropy factor , and penetration depth ). The clinical application of PDT has thus far been based on purely empirical values for the light dose and exposure time. Knowledge about the behavior of light in healthy and dysplastic tissue is of great interest for careful scheduling of irradiation. The current literature offers little information about the optical tissue properties. Data are available for stomach or carcinoma of the esophagus, but not especially about the gastroesophageal junction. Thus, the aim of this study was to determine the optical properties of healthy and carcinomatous human tissue of the gastroesophageal junction to provide reproducible parameters for optimal dosimetry in PDT. In this context, we examined a wavelength range of to determine the differences between healthy and tumorous tissue and those in the effective area of currently used photosensitizers [hypericin, 5-aminolaevulinic acid (5-ALA) and porfimer sodium]. 2.Materials and Methods2.1.Tissue SamplesA total of 36 tissue samples were obtained from patients undergoing surgical resection for cancer of the gastroesophageal junction. These samples came from squamous cell cancer tissue as well as adenocarcinoma tissue of the gastroesophageal junction . In addition, healthy tissue (stomach and esophagus) was removed from a safety margin of at least from the tumor. The histopathological workup of preparations was performed by our pathological institute as standardized tumor staining (HE). To measure optical parameters, tissue samples were cut from the optical parameter (OP) specimens with a scalpel. Samples taken from healthy stomach or esophagus tissue measured at least and covered the entire mucosal depth. Samples taken from carcinoma tissue of the gastroesophageal junction were cut from the solid parts (macroscopically necrosis-free) and measured approximately . The samples were transported in an ice-cooled container, shock frozen in liquid nitrogen, and subsequently homogenized in a mortar cooled down to . The homogenate was then placed in the sample space of cylindrical quartz cuvettes (Hellma, Mühlheim, Germany) with a defined thickness of . The interior space of the cuvettes was completely filled with the homogenate, which prevented the formation of air bubbles. The average transportation time from removal to further processing was . The histological findings in the surgical specimens were examined and documented to differentiate the carcinomas (squamous cell and adenocarcinoma). 2.2.Optical Parameter MeasurementsOptical parameters were determined by a new integrating sphere spectrometer (Lambda 900 UV/VIS/NIR, Perkin-Elmer, Norwalk, Connecticut) in an indirect measurement procedure.15 The spectrometer contained an optical system and an integrating sphere ( diam) with a transmission port ( diam) and a remission port ( diam) to position sample holders or reflection standards. Monochromatic light of any wavelength was generated with a preset deuterium lamp (wavelength range ) and a Wolfram halogen lamp (wavelength ), and conducted into the sample space via spherical mirrors and monochromators. Alternation between lamps, monochromators, and photodetectors was automatic. A chopped beamsplitter provided permanent calibration of the optical system through an additional port and a permanent reference standard. The beam diameter at the transmission and remission port was xx cm and xx cm, respectively. The spectralon coating on the inside of the integrating sphere (type PELA 1000) permitted overall uniform reflection of the infalling light. Detectors inside the measuring sphere (NIR area: thermostatic high-performance PBS cells; UV/VIS: Hamamatsu R-955 photomultiplier) recorded the infalling light. Three measurements were done for each sample and wavelength. To measure total transmission , the sample cuvettes were attached to the transmission port. The remission port was closed with a spectralon-coated standard, and the total light intensity penetrating the tissue was recorded. After that, the standard was removed from the remission port and a significant portion of the diffuse transmission was recorded because unscattered photons were able to escape through the open port. To measure the diffuse remission , the sample cuvette holder was positioned at the remission port, and a significant portion of the diffuse retrograde scattering was registered. It is important to note that both and exhibit an inherent systematic error because photons scattered at small angles were able to leave the remission port, while diffusely backscattered photons could eventually leave the transmission port without being detected. However, these systematic errors were taken into consideration during the calculation of the optical parameters. The absorption coefficient , scattering coefficient , and anisotropy factor were subsequently determined from the macroscopic parameters , , and by an inverse Monte Carlo simulation. Because the Monto-Carlo simulation is a forward calculation, it was necessary to “estimate” a set of optical tissue parameters as starting values for the iterative fitting algorithm. We applied the Kubelka-Munk theory, which provided quite a good first guess, hence keeping the number of required iterations limited.16 The forward Monte-Carlo simulation provided a calculated set of measuring data. Comparing these simulated data with the measured data yielded information about the quality of the parameters applied. In the case of significant differences, the actual optical parameters were varied according to the fitting algorithm and a new forward simulation was started. The actual optical parameters were accepted as sample properties if the measured and calculated parameters for , , and were within a 0.5% limit of error. The simulation took into account the exact geometrical and optical conditions of the experimental design (sample geometry, sphere parameters, refractive index steps, diameter of diaphragm, radiation divergence, etc.). By doing so, the simulated systematic error of and , including scattered photons traveling in a lateral direction of the sample and hence being not detected in the integrating sphere (side losses), led to the necessary correction of the tissue parameters during the Monte-Carlo calculation process as a prerequisite to obtain precise optical parameters at a wavelength with a low absorption coefficient. The optical penetration depth was given in millimeters and calculated by the following equation: where is the absorption coefficient; is the scatter coefficient; and is the anisotropy factor.2.3.StatisticsOptical properties were given as mean values and standard deviation based on the descriptive analysis. Nonparametric tests were performed because of the small number of samples. Friedman’s test for more than two paired samples was used to compare the optical tissue parameters of different wavelengths. Different tissues (healthy/tumorous) were compared by Wilcoxon’s test for unpaired samples. Interindividual fluctuations of optical properties in one type of tissue were shown as person-related standard deviation and variation coefficient. The statistical significance level was set at and calculated by SPSS software (version 10.0; SPSS Incorporated, Chicago, Illinois). 3.Results3.1.Optical Parameters of Healthy Stomach and Adenocarcinoma TissueEvaluation of the data showed marked variations between the parameters. The values of the absorption coefficient for healthy tissue were between 0.01 and in the survey spectrum. The results for carcinomatous adenocarcinoma tissue were significantly lower at values between 0.02 and (Fig. 1 ). After reaching a maximum value of at , the scattering coefficient for stomach tissue dropped continuously to a minimum value of at . Scattering coefficient values for adenocarcinomas were between 23.08 and (Fig. 2 ). Both healthy stomach and adenocarcinoma tissue showed strong forward scattering over the entire light spectrum, i.e., the anisotropy factor ranged from 0.7 to 0.9. The optical penetration depth was highest from in healthy stomach tissue and 0.11 and in adenocarcinomas, with a maximum value of at (healthy stomach tissue) and at (adenocarcinoma) (Fig. 3 ). The optical penetration depth in carcinoma tissue was higher, up to , and lower, from , than in healthy tissue. 3.2.Optical Parameters of Healthy Esophagus and Squamous Cell Carcinoma TissueThe absorption coefficient ranged from for human esophagus tissue, and from for squamous cell carcinoma (Fig. 4 ). Here, the values were significantly lower for squamous cell carcinoma than for healthy esophagus tissue. Fig. 4Absorption coefficient in the survey spectrum for esophageal and squamous cell carcinoma tissue.  The scatter coefficient dropped continuously from at 300 nm to at (healthy esophagus tissue). The scatter coefficient for squamous cell carcinomas ranged from at 300 nm to at (Fig. 5 ). Fig. 5Scattering coefficient in the survey spectrum for esophageal and squamous cell carcinoma tissue. 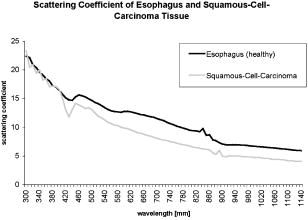 In healthy esophagus tissue and squamous cell carcinomas, the anisotropy factor likewise ranged between 0.7 and 0.9, corresponding to strong forward scattering. The optical penetration depth ranged from in healthy esophagus tissue (maximum of at ), and from in squamous cell carcinoma (maximum of at 1110) (Fig. 6 ). Here, the optical penetration depth was higher in squamous cell carcinoma than in healthy tissue at a wavelength of up to and usually lower above . Fig. 6Optical penetration depth in the survey spectrum for esophageal and squamous cell carcinoma tissue. 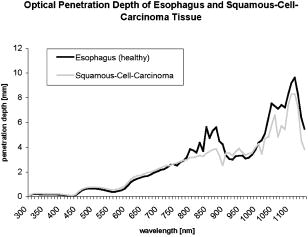 Table 2OP of healthy esophagus versus squamous cell carcinoma at 330, 630, and 650nm . * signifies p<0.05 versus esophagus at current wavelength; # signifies p<0.05 versus esophagus at 330nm ; and + signifies p<0.05 versus squamous cell carcinoma at 330nm .
3.3.Optical Properties of Healthy Stomach Tissue Versus Adenocarcinoma Tissue at 330, 630, andTable 1 shows the mean values for the optical properties of human stomach and adenocarcinoma tissue at wavelengths of 330, 630, and . The wavelengths correspond to the effective ranges of the currently used photosensitizers hypericin, 5-ALA, and photofrin. Applying higher wavelengths reduced the absorption coefficient of both tissues. Direct comparison of the tissues showed significantly lower absorption coefficients for adenocarcinoma tissue than for stomach tissue in the selected wavelengths. Table 1OP of healthy stomach versus adenocarcinoma at 330, 630, and 650nm . * signifies p<0.05 versus stomach at current wavelength; # signifies p<0.05 versus stomach at 330nm ; and + signifies p<0.05 versus adenocarcinoma at 330nm .
The scattering coefficient of both stomach and adenocarcinoma tissue dropped with increasing wavelengths. The differences between 330 and and between 330 and were significant. There were no statistical differences between 630 and . A comparison of stomach and adenocarcinoma tissue at each wavelength yielded no significant differences between the scattering coefficient values. Comparing the wavelengths revealed a significantly higher anisotropy factor of stomach tissue at 630 and than at , but not between 630 and . In adenocarcinomas, the anisotropy factor only reached statistical relevance at wavelengths between 330 and 630 or 650. The optical penetration depth in both stomach and adenocarcinoma tissue increased with increasing wavelengths. The differences in both tissues were significant, between 330 and 630 or 650, but not between 630 and . The penetration depth was significantly higher in adenocarcinoma tissue than in stomach tissue at the three wavelengths. 3.4.Optical Properties of Healthy Esophagus Versus Squamous Cell Carcinoma Tissue at 330, 630, andTable 2 gives the optical properties of human esophagus and squamous cell carcinoma tissue at wavelengths of 330, 630, and . The absorption coefficient of the esophagus was significantly smaller at 630 and than at , although no significant difference was found between 630 and . The same was true for the squamous cell carcinoma. The mean absorption coefficient of the squamous cell carcinoma was significantly smaller than that of the esophagus. The scattering coefficient of the esophagus differed significantly between values at 330 and and those at 330 and . The difference between 630 and was not significant. This also applied to the values obtained for the squamous cell carcinoma. Comparing the two tissues at each wavelength showed that carcinoma tissue has a significantly lower scattering coefficient than healthy esophagus at all three wavelengths. The anisotropy factor for both the esophagus and squamous cell carcinoma differed significantly between 330 and and 330 and , but not between 630 and . No significant differences were found when comparing the tissues. The optical penetration depth was found to increase for both tissues at higher wavelengths. Values varied significantly between 330 and 630 or for both the esophagus and the squamous cell carcinoma. The penetration depth in esophageal tissue was significantly higher at all three selected wavelengths. 4.DiscussionPhotodynamic therapy is an established alternative procedure for management of pT1 tumor stages and early esophageal and gastric carcinomas, as well as for palliative therapy of extensive esophageal carcinoma or inoperable cases.17, 18, 19 However, the clinical approach of PDT has thus far been based solely on empirical data. There are only a few reports in the literature on the optical tissue properties. Thus, knowledge about the behavior of light in healthy and dysplastic tissue is of great interest for careful irradiation scheduling. The aim of this study was to initially determine all optical parameters (absorption, scattering, anisotropy factor, and penetration depth) in healthy and carcinomatous human tissue of the gastroesophageal junction to obtain reproducible parameters for optimal dosimetry in PDT application. We examined the question of whether differences exist between healthy and tumorous tissue and in the effective range of currently used photosensitizers [hypericin, 5-aminolaevulinic acid (5-ALA), and porfimer sodium]. The measurements were performed by a new integrating sphere spectrometer in an indirect measurement procedure.15 The advantages of the new spectrometer over a double Ulbricht’s sphere system were the automated measurement and the resultant simplified, faster handling. Measurement errors in spectrometer application occurred because a certain light component was lost by lateral diffusion due to multiple scattering from the sample holder, and was thus not registered by the light detector. The detectors also had higher absorption than the spectralon coating of the sphere’s inside surface. This loss of light caused a slight increase in the absorption coefficient.20 Our analysis took into account this error, which is estimated to be 1 to 2% in the literature. An in-vitro study design was selected to determine the optical properties as accurately as possible. The technique of tissue sampling is considered a potential source of error. The most unadulterated, i.e., freshest, sample without essential changes in the tissue properties is the quality criterion. The freshly removed samples should not lose water or hemoglobin, nor should they be exposed to nonphysiological oxidation. Air bubbles enclosed in the tissue, inhomogeneity, and uneven surface structures cause changes in the layer thickness and thus alter the tissue properties.21 To ensure transferability to the in-vivo situation, the tissue was snap frozen and homogenized immediately after removal from the surgical biopsy specimen. It was subsequently placed in a cell of a given size without the inclusion of air bubbles. According to the literature, the optical properties of native and cryohomogenized tissue diverge by a maximum of 3%.22, 23 In a previous study, we demonstrated that the absorption level was not significantly influenced after cryohomogenization (increase of 5.9% in relation to the reference preparation). Also, the calculated reduced scattering factor decreased not significantly by a mean value of . Hence, the changes in and compensated each other, and no cryohomogenization effect is expected from these data if the reduced set of optical properties is used.22 Accordingly, Peters found a maximum deviation of 3% in comparison to the nonhomogenized tissue sections.23 As a rule, biological tissue consists mainly of water. The absorption properties of water are therefore of decisive importance for light-tissue interactions. In addition, there are various pigments. The most important example of these so-called chromophores is hemoglobin. Hemoglobin and cytochrome oxidases are generally known to be the most important absorbers in the short infrared wavelength range. Thus, they exert a decisive influence on the optical parameters, especially on absorption. In this study, blood was not removed from the samples. However, the optical parameters of blood and water have to be considered for in-vivo irradiation planning. So, further experiments should be performed to study the influence of blood and water residuals on the absorption coefficients. The dependence of the optical parameters on the wavelength must also be mentioned as another important factor. Except for the anisotropy factor, the optical properties vary widely, especially in the range of visible, ultraviolet, and infrared light.24, 25 Earlier publications on tissue properties were limited to individual wavelength values.3, 7, 20, 23, 25 These were mainly in the laser application and PDT range. Apart from measuring the tumor diameter, Maier determined the extinction coefficient and the penetration depth of esophageal carcinoma tissue at in vivo.18 There are no reports in the literature on the optical properties of stomach tissue. Our study assessed all optical parameters in healthy and cancerous esophageal and gastric tissue in the wavelength range of . The absorption coefficient showed marked differences for both tissues over the course of the measured wavelength spectrum. The highest values were found in the lower wavelength range. The maximum was for the stomach and for the esophagus at a wavelength of . After lowering the values, there was a second peak at with for the stomach and for the esophagus. All values were under at wavelengths above . There was another increase in the absorption coefficient from , which can be explained by the absorption of water in this range. The maximums at 430 and are attributed to the absorption of light by deoxyhemoglobin.24 Yaroslavsky found markedly lower values for when measuring optical parameters in human brain tissue after washing out the hemoglobin. They thus obtained an absorption coefficient in the range of .26 Anderson, Parrish, and Parrish described absorption of at for skin tissue.27 This very low value can clearly be attributed to the lower amount of hemoglobin. In agreement with this, Gottschalk found absorption coefficients between 1.4 and at a wavelength of for healthy gastric and esophageal tissue.21 All absorption coefficient data were under between 740 and . In 1981, Parrish defined this phenomenon as the “optical window of biological tissue.”28 Over the entire spectrum, the scattering coefficient showed a continuous decrease from (esophagus) and (stomach) to 7.56 and at the beginning of the measurement range. Simpson speak of a decreasing scattering coefficient with increasing wavelengths for all biological tissue.26 In agreement with the present study, scattering was described in various tissues as fluctuating only slightly compared to the absorption coefficient. At a wavelength of , Gottschalk found a scattering coefficient of for stomach tissue. This was in our study. The anisotropy factor for the two tissues showed hardly any variation over the entire spectrum of measured tissue. Nearly all results were in the range of 0.9. A value of 1.0 corresponds to complete forward scattering. Thus, the scattering direction for the measured tissue is almost forward. In Yaroslavsky, the anisotropy factor for gray and white matter was between 0.81 and 0.96.26 At a wavelength of , he determined a mean anisotropy factor between 0.9 and 0.95. The value of 0.94 measured in our study showed clear agreement. The impact of the absorption coefficients on the parameters can be determined from the course of the optical penetration depth over the measurement range. Due to the high absorption in the lower wavelength range, the penetration depth is less than up to . The two negative peaks of the curve result from the high light absorption caused by hemoglobin in the tissue. The values are almost the reversed image of the decrease in the absorption coefficients between 700 and . The highest penetration depth was at for the esophagus, and at for the stomach. Germer obtained almost identical data for the penetration depth in human liver tissue ( at ).29 The optical properties of carcinoma tissue showed clear parallels to those of healthy tissue in the survey spectrum. In the qualitative comparison, the absorption coefficient also demonstrated a decreasing course above , just like healthy tissue. The values of the scatter coefficient and anisotropy factor hardly changed in either tissue. The optical penetration depth increased significantly with longer wavelengths. There were no significant quantitative differences between the optical penetration depth of healthy and cancerous tissue. The qualitative change in the optical parameters can be explained by the hemoglobin component in the tissue. Like Gottschalk and Roggan, we can also confirm an effect on the parameters above due to the water content of each tissue. Significant differences were found in the quantitative comparison of absolute values. The values for the absorption and scattering coefficients were 52.3 and 9.4% higher in stomach tissue than in adenocarcinoma tissue. The optical properties of the squamous cell carcinoma had a significantly lower absorption and scatter coefficient in the quantitative comparison with healthy esophagus. This may be due to the lower content of chromophores, cell nuclei and membranes in tumor tissue.30 In contrast, the recorded data showed no quantitative difference between tumorous and healthy tissue for the anisotropy factor. The optical penetration depth was significantly higher in adenocarcinoma tissue than in stomach tissue up to . The difference from healthy tissue was using a wavelength. The differences of 0.44 and 0.40 at 630 and were also significant. This corresponds to a 45.9% times higher mean penetration depth in carcinoma tissue. Using , the penetration depth was higher in squamous cell carcinoma tissue than in healthy tissue. The difference in the wavelengths at 630 and was 0.24 and . This corresponds to a 20.67% times higher mean penetration depth in carcinoma tissue than in the esophagus. Several authors have described a higher penetration depth in tumor tissue.20, 24, 25 Maier reported a penetration depth of for , depending on the tumor thickness. However, no distinction was made here between adenocarcinoma and squamous cell carcinoma.18 The interindividual differences in the tumor tissue may be explained by tissue structures varying according to the differentiation grade. Histological grading of the tumors was not included in our study. Denaturated proteins within the tumor necroses may also cause changes in the optical properties. Further studies should be performed using the available data to examine the effect of the photosensitizers on the optical tissue properties. It would be of great interest in this connection to determine the optical parameters of tissues in the presence of photosensitizers. Such investigations would have to be performed in animal models. The present study deals with in-vitro measurement of samples from surgical preparations, but a photosensitizer cannot be previously applied in patients for ethical reasons. Up to now, there have been hardly any reports on the tissue properties of the human esophagus and stomach. Measurements over a broad light spectrum have not been previously published for esophageal tissue. This is the first study to determine the penetration depth, absorption, and scattering for a given tissue. Our data can be used as the basis for exact dosimetry to ensure effective and safe photodynamic therapy. In summary, it may be said that the measuring procedure with the spectrometer described in our study is an efficient and fast in-vitro method for determining optical parameters of healthy and dysplastic tissue. In view of the high penetration depth at the end of the light spectrum, PDT should be carried out in this range whenever possible. Thus, a photosensitizer with an optimal effect in the high wavelength range would be desirable for clinical use to ensure adequate tumor destruction, ideally by a single application. The sensitizers frequently used today have an effective range between 300 and . In this range, light does not penetrate deeper than a few millimeters, achieving only superficial destruction of the tumor tissue and requiring high energy doses or repeated ablation treatments. ReferencesA. Ruol,
G. Zaninotto,
M. Costantini,
G. Battaglia,
M. Cagol,
R. Alfieri,
M. Epifani, and
E. Ancona,
“Barrett’s esophagus: management of high-grade dysplasia and cancer,”
J. Surg. Res., 117 44
–51
(2004). 0022-4804 Google Scholar
P. Sharma,
“Controversies in Barrett’s esophagus: management of high grade dysplasia,”
Semin Gastrointest Dis., 12 26
–32
(2001). 1049-5118 Google Scholar
P. McCulloch,
J. Ward, and
P. P. Tekkis,
“Mortality and morbidity in gastro-oesophageal cancer surgery: initial results of ASCOT multicentre prospective cohort study,”
BMJ, 327
(7425), 1192
–1197
(2003). 0959-8138 Google Scholar
H. C. Wolfsen,
“Present status of photodynamic therapy for high-grade dysplasia in Barrett’s esophagus,”
J. Clin. Gastroenterol., 39 189
–202
(2005). 0192-0790 Google Scholar
R. L. Van Veen,
M. C. Aalders,
K. L. Pasma,
P. D. Siersema,
J. Haringgsna,
W. Van de Vrie,
E. E. Gabeler,
D. J. Robinson, and
H. J. Sterenborg,
“In situ light dosimetry during photodynamic therapy of Barrett’s esophagus with 5-aminolevulinic acid,”
Lasers Surg. Med., 31 299
–304
(2002). https://doi.org/10.1002/lsm.10129 0196-8092 Google Scholar
O. Pech,
L. Gossner,
A. May,
T. Rabenstein,
M. Vieth,
M. Stolte,
M. Berres, and
C. Ell,
“Long-term results of photodynamic therapy with 5-aminolevulinic acid for superficial Barrett’s cancer and high-grade intraepithelial neoplasia,”
Gastrointest. Endosc., 62
(1), 24
–30
(2005). 0016-5107 Google Scholar
J. Webber,
M. Herman,
D. Kessel, and
D. Fromm,
“Photodynamic treatment of neoplastic lesions of the gastrointestinal tract. Recent advances in techniques and results,”
Langenbecks Arch. Surg., 385
(4), 299
–304
(2000). 1435-2443 Google Scholar
H. C. Wolfsen,
“Present status of photodynamic therapy for high-grade dysplasia in Barrett’s esophagus,”
J. Gastroenterol., 39
(3), 189
–202
(2005). 0944-1174 Google Scholar
S. Burch,
A. Boogaards,
J. Siewerdsen,
D. Moseley,
A. Yee,
J. Finkelstein,
R. Weersink,
B. C. Wilson, and
S. K. Bisland,
“Photodynamic therapy for treatment of metastatic lesions in bone, studies in rat and porcine models,”
J. Biomed. Opt., 10
(3), 034011
(2005). https://doi.org/10.1117/1.1921887 1083-3668 Google Scholar
J. Moan,
Q. Peng,
R. Sorensen,
V. Iani, and
J. M. Nesland,
“The biophysical foundations of photodynamic therapy,”
Endoscopy, 30 387
–391
(1998). 0013-726X Google Scholar
S. Wong,
M. Luna,
A. Ferrario, and
C. J. Gomer,
“CHOP activation by photodynamic therapy increases treatment induced photosensitization,”
Lasers Surg. Med., 35 336
–41
(2004). https://doi.org/10.1002/lsm.20110 0196-8092 Google Scholar
R. Cheung,
M. Solonenko,
T. M. Busch,
F. Del Piero,
M. E. Putt,
S. M. Hahn, and
A. G. Yodh,
“Correlation of in vivo photosensitizer fluorescence and photodynamic-therapy-induced depth of necrosis in a murine tumor model,”
J. Biomed. Opt., 8
(2), 848
–852
(2003). https://doi.org/10.1117/1.1560011 1083-3668 Google Scholar
V. R. Litle,
J. D. Luketich,
N. A. Christie,
P. O. Buenaventura,
M. Alvelo-Rivera,
J. S. McCaughan,
N. T. Nguyen, and
H. C. Fernando,
“Photodynamic therapy as palliation for esophageal cancer, experience in 215 patients,”
Ann. Thorac. Surg., 76
(5), 1687
–1692
(2003). 0003-4975 Google Scholar
T. Stepinac,
P. Grosjean,
A. Woodtli,
P. Monnier,
H. van den Bergh, and
G. Wagnieres,
“Optimization of the diameter of a radial irradiation device for photodynamic therapy in the esophagus,”
Endoscopy, 34
(5), 411
–415
(2002). 0013-726X Google Scholar
J. D. Lovell,
“Theory and application of integration sphere technology,”
Laser Focus/Electro-Optics, 5 86
–96
(1984). Google Scholar
P. Kubelka and
F. Munk,
“Ein beitrag zur optik der farbanstriche,”
Z. Tech. Phys. (Leipzig), 12 593
–601
(1931). 0373-0093 Google Scholar
C. J. Lightdale,
“Role of photodynamic therapy in the management of advanced esophageal cancer,”
Gastrointest Endosc Clin. N. Am., 10
(3), 397
–408
(2000). 1052-5157 Google Scholar
A. Maier,
F. Tomaselli,
F. Gebhard,
P. Rehak,
J. Smolle, and
F. M. Smolle-Jüttner,
“Palliation of advanced esophageal carcinoma by photodynamic therapy and irradiation,”
Ann. Thorac. Surg., 69 1006
–1009
(2000). 0003-4975 Google Scholar
P. E. Claydon and
R. Ackroyd,
“5-Aminolaevulinic acid-induced photodynamic therapy and photodetection in Barrett’s esophagus,”
Dis. Esophagus, 17 205
–212
(2004). 1120-8694 Google Scholar
A. Roggan,
K. Dörschel,
O. Minet,
D. Wolff, and
G. Müller,
“The optical properties of biological tissue in the near infrared wavelength range-review and measurement,”
Laser-Induced Interstitial Thermotherapy, 132
–149
(1995) Google Scholar
D. Zhu,
Q. Luo, and
J. Cen,
“Effects of dehydration on the optical properties of in vitro porcine liver,”
Lasers Surg. Med., 33 226
–231
(2003). https://doi.org/10.1002/lsm.10215 0196-8092 Google Scholar
A. Roggan,
D. Schädel,
U. Netz,
J. P. Ritz,
C. T. Germer, and
G. Müller,
“The effect of preparation technique on the optical parameters of biological tissue,”
Appl. Phys. B, 69 445
–453
(1999). https://doi.org/10.1007/s003400050833 0946-2171 Google Scholar
V. G. Peters,
D. R. Wyman,
M. S. Patterson, and
G. L. Frank,
“Optical properties of normal and diseased human breast tissues in the visible and near infrared,”
Phys. Med. Biol., 35 1317
–1334
(1990). https://doi.org/10.1088/0031-9155/35/9/010 0031-9155 Google Scholar
J. P. Ritz,
A. Roggan,
C. Isbert,
G. Müller,
H. J. Buhr, and
C. T. Germer,
“Optical properties of native and coagulated porcine liver tissue between 400 and ,”
Lasers Surg. Med., 29 205
–212
(2001). https://doi.org/10.1002/lsm.1134 0196-8092 Google Scholar
A. Terenji,
S. Willmann,
J. Osterholz,
P. Hering, and
H. J. Schwarzmaier,
“Measurement of the coagulation dynamics of bovine liver using the modified microscopic Beer-Lambert law,”
Lasers Surg. Med., 36 365
–370
(2005). https://doi.org/10.1002/lsm.20178 0196-8092 Google Scholar
C. R. Simpson,
M. Kohl,
M. Essenpreis, and
M. Cope,
“Near-infrared optical properties of ex-vivo human skin and subcutaneus tissues measured using the Monte-Carlo inversion technique,”
Phys. Med. Biol., 43 2465
–2478
(1998). https://doi.org/10.1088/0031-9155/43/9/003 0031-9155 Google Scholar
R. R. Anderson,
B. S. Parrish, and
J. A. Parrish,
“The optics of human skin,”
J. Invest. Dermatol., 77 13
–19
(1981). https://doi.org/10.1111/1523-1747.ep12479191 0022-202X Google Scholar
J. A. Parrish,
“New concepts in therapeutic photomedicine, photochemistry, optical targeting and the therapeutic window,”
J. Invest. Dermatol., 77 45
–50
(1981). https://doi.org/10.1111/1523-1747.ep12479235 0022-202X Google Scholar
C. T. Germer,
A. Roggan,
J. P. Ritz,
C. Isbert,
D. Albrecht,
G. Muller, and
H. J. Buhr,
“Optical properties of native and coagulated human liver tissue and liver metastases in the near infrared range,”
Lasers Surg. Med., 23
(4), 194
–203
(1998). https://doi.org/10.1002/(SICI)1096-9101(1998)23:4<194::AID-LSM2>3.0.CO;2-6 0196-8092 Google Scholar
B. Beauvoit,
T. Kitai, and
B. Chance,
“Contribution of the mitochondrial compartment to the optical properties of the rat liver, a theoretical and practical approach,”
Biophys. J., 67 2501
–2510
(1994). 0006-3495 Google Scholar
|
||||||||||||||||||||||||||||||||||||||||||||||||||||||||||||||||||||||||||||||||||


