|
|
1.IntroductionThere has been significant interest in the noninvasive determination of the morphology and biochemical composition of biological tissues through the measurement of optical properties. Epithelial tissues are a major target because they represent the site from which more than 85% of all cancers originate.1 Epithelial tissues line organ surfaces with a single or stratified layer of closely packed cells and are supported by underlying stromal tissue composed primarily of collagen and other extracellular matrix proteins. It is well known that the vast majority of epithelial cancers are preceded by distinct biochemical and morphological changes in both the epithelia and stroma.2 The thickness of the cellular epithelial layer is typically and lies within the transport regime with respect to optical scattering.3, 4 On one hand, the thickness of the cellular epithelium is of the same order or larger than the single scattering mean free path of photons in the visible and near-IR, typically to . Thus, when using light to interrogate both the epithelium and the underlying stroma, one will invariably detect photons that have multiply scattered within the tissue; often interacting with both these layers. On the other hand, the epithelial layer thickness is typically smaller than the transport mean free path and precludes the use of models based on the diffusion approximation to radiative transport to analyze the optical signals and extract optical properties. As a result, the use of optical approaches to detect and separate the optical properties of these two tissue layers continues to present a major challenge in biomedical optics. The accurate characterization of both epithelial and stromal tissues is critically important because as epithelial cancer progresses, the optical properties of the epithelial and stromal layers can be altered in markedly different ways. For example, the development of dysplasia and epithelial neoplasm often results in an increase in epithelial scattering due to the enlargement of nuclear size, increased nuclear/cytoplasmic ratio and hyperchromasia. Simultaneously, stromal scattering can decrease due to degradation of collagen fibers resulting from the release of matrix metalloproteases (MMPs) and stromal absorption can increase due to the release of angiogenic factors such as vascular endothelial growth factor1, 2 (VEGF). To address these issues, many investigators have examined the sensitivity of reflectance measurements made at specific source-detector separations to optimize their sensitivity to changes in optical properties in homogeneous media.5, 6, 7 This knowledge has spurred the design of optical probes to isolate or differentially sample the superficial epithelial tissue versus the supporting stromal tissue layer or vice versa. Several studies have examined the impact of many fiber probe design characteristics including fiber diameter, numerical aperture, and source-detector (s-d) separation on the sensitivity of fluorescence and reflectance measurements in these two layers. 8, 9, 10, 11 Recently, many have proposed novel fiber probe configurations that potentially isolate contributions of the epithelium to the detected signal12, 13 or provide depth-selective reflectance spectra to separate epithelial scattering from stromal scattering.14, 15 Others, including the groups of Backman and Sokolov, have used polarization gating techniques to detect photons that travel “short path lengths” within the tissue from those that travel “long path lengths” to provide differential sensitivity to the superficial epithelial layer versus the deeper stromal layer. 15, 16, 17, 18 While such approaches no doubt enhance the contribution of either the epithelial or stromal layer to the detected optical signal, the fact that the epithelial tissue thickness is typically of the same order or larger than the single scattering mean free path prevents these probe designs from fully separating and isolating the contributions of both the epithelial and stromal tissue layers to the detected signal. These innovative developments in probe design to better interrogate epithelial and stromal tissues would be complemented greatly by accurate modeling of radiative transport in heterogeneous tissues on submillimeter length scales. If available, such models could assess the epithelial and stromal contributions to spatially resolved reflectance measurements and perhaps recover the distinct optical properties of the two layers. Such a capability would improve greatly the potency of diffuse reflectance measurements to detect and characterize the physiological changes occurring in both epithelial and stromal layers during dysplastic and neoplastic transformation. As noted earlier, the epithelial thickness is typically intermediate between and . Moreover, the epithelium and sometimes the underlying stroma may not be strongly scattering. Both these features demand the use of models that can provide both forward and inverse predictions of radiative transfer in the transport regime, i.e., outside the range of the diffusion approximation.4 The development of such radiative transport models is difficult. Optical diagnostic modalities based on multiple light scattering to recover optical properties of spatially heterogeneous tissues have relied on methods that either invoke the diffusion approximation to radiative transport or utilize hybrid diffusion/Monte Carlo approaches. Unfortunately, the validity of these approaches are limited to highly scattering tissues [i.e., ] and/or spatial scales significantly larger than a transport mean free path . Specifically, the numerous methods that have been developed to determine optical properties of layered media from spatially resolved, time domain and/or frequency-domain diffuse reflectance measurements cannot be applied to epithelial tissues due to the submillimeter thicknesses of the tissue layers involved. 19, 20, 21, 22, 23, 24, 25, 26, 27, 28, 29, 30 More recently, several investigators have used Monte Carlo methods to examine the impact of epithelial and/or stromal optical property changes as well as changes in epithelial thickness on the resulting photon migration signal.31, 32, 33 However, these studies have not addressed the inverse problem of optical property determination from the photon migration measurements. Thus, the availability of methods to enable the recovery of optical properties in low/moderately scattering tissues on spatial scales comparable to from the signals measured by the new generation optical probes aimed to examine epithelial tissues would be quite valuable for the accurate determination of layered optical properties. These facts motivated us to develop a computational platform to address both forward and inverse problems in a framework faithful to the radiative transport equation. This platform combines perturbation and differential Monte Carlo (pMC/dMC) methods to provide transport rigorous estimates of optical signals as well as extraction of optical properties. These features make it applicable to systems with arbitrary optical properties possessing heterogeneities of characteristic dimension approaching . Our group proposed and computationally validated this approach in an earlier study.3 This study demonstrated the use of pMC/dMC methods in conjunction with a gradient-based optimization algorithm to process MC-simulated spatially resolved frequency-domain reflectance measurements to provide for the efficient and rapid recovery of optical properties in a layered epithelial tissue model. In this technique, the optimization determined the optical properties of the heterogenous tissue regions that result in a radiative transport prediction that best matched the simulated measurements. The radiative transport predictions required for the optimization procedure are provided using a pMC algorithm. The pMC algorithm provides these estimates by rescaling the weights of photon biographies stored from the MC simulation of a related “background” medium in a way consistent with the assumed optical properties of the heterogeneous tissue. In addition a dMC algorithm provides a sensitivity analysis of the measured optical signals relative to the optical properties of each heterogeneous region to determine how the optical properties in these regions should be changed for each iteration of the gradient-based optimization. The advantage of using this combined pMC/dMC approach was demonstrated by rapidly determining optical properties in a two-layer turbid medium under conditions in which diffusion-approximation-based approaches are not tenable. Since our initial introduction of the pMC/dMC technique, other groups have adopted its use for the examination of other problems in biomedical optics. For example, the studies of Kumar and Vasu34 and Yalavarthy 35 applied this technique to both simulated and measured data sets of time-resolved diffuse reflectance/transmittance for optical property image reconstruction of low-scattering turbid media. These studies demonstrated the superior performance of the pMC/dMC technique relative to diffusion-approximation-based reconstruction methods. Given these recent advances in the application of the pMC/dMC technique to optical diagnostics, the objectives of this paper are twofold. First, we wish to demonstrate the ability of the pMC/dMC approach to recover optical properties from experimental measurements of steady-state (CW) spatially resolved diffuse reflectance (SRDR) of two-layer turbid media. The successful utilization of pMC/dMC techniques to recover optical properties from CW reflectance data is not evident because this data does not contain information on the dynamics of optical transport in the medium. The ability to recover optical properties using CW data is of practical significance due to the reduced expense and ease of use of CW measurement systems relative to time-domain or frequency-domain systems. Second, we wish to explore the impact of different sets of s-d separation on the ability to recover optical properties of the superficial epithelial layer versus the deeper stromal layer. The experimental system utilizes tissue phantoms whose optical absorption and scattering properties are similar to those of epithelial tissues with layer thicknesses smaller than a transport mean free path. In what follows, we provide details of the theory that forms the basis of pMc/dMc methods, describe the methodology for determination of optical properties and the experimental system in which the measurements were performed. We then provide the results of our optical property recovery and discuss the general applicability of this approach. 2.Theory2.1.pMC/dMC MethodsThe pMC algorithm implemented in this paper employs a conventional MC simulation for a fixed s-d geometry with homogeneous background optical absorption and scattering coefficients and . We launch photons at the origin of semi-infinite media and save the biographies (path length and scattering locations) of the detected photons. For a narrow beam normally incident onto a tissue, intercollision distances are chosen from the probability density function as the photons propagate within the tissue, where . At each collision point, a new scattering angle is sampled from the Henyey-Greenstein phase function. The weight of each photon is reduced by a factor of at each collision. Thus, a photon that has undergone collisions within a homogeneous tissue prior to detection carries a weight , where is a factor that accommodates the numerical aperture of the detector and the refractive index mismatch between the detector and the tissue. A valuable feature of pMC is that it provides for the rapid determination of detected photon weights for a system that can be considered perturbed relative to a background system. Specifically, let us consider a heterogeneous tissue consisting of perturbed regions each with optical properties and . If the optical properties of each of these regions can be expressed in terms of a perturbation to the background optical properties, i.e., and , (see Fig. 1 ) the detected photon weight in the second system can be estimated by where is the number of collisions the photon experiences in the th perturbed region, and is the path length of photon travel within the th perturbed region.3The pMC method enables the simulation of several different, but related transport problems at a fraction of the computational time and cost required for separate MC simulations.36, 37 In our application, Eq. 1 is used to obtain estimates for the change in the detected photon signal in a perturbed system using the saved photon biographies from a background simulation. Note that the background system is not required to be spatially homogeneous but can instead be composed of several structures containing different optical properties. The expected value of Eq. 1 summed over all photons is the signal produced by the perturbed system. Thus, the implementation of pMC requires only a single MC simulation for the background system that can serve as a basis to determine the optical signal of any number of related systems so long as these systems can be related in terms of regions whose optical properties that can be expressed in terms of the background system. To find the optical properties of the perturbed regions of interest, derivative information must be supplied to the gradient-based optimization. This information is obtained by taking the derivative of the Eq. 1 with respect to either the absorption perturbation or scattering perturbation of the th heterogeneity. These sensitivities can be derived for all heterogeneous regions in the perturbed geometry. The closed form expressions for these derivatives follow and constitute dMC. and3.Methods3.1.Epithelial Tissue ModelThe SRDR measurements are performed using turbid liquid phantoms with 10% Intralipid (B. Brown, Irvine, California) solution providing the scattering and nigrosin (Sigma-Aldrich) as the optical absorber. The optical phantoms were designed to reproduce optical properties of normal cervical tissue measured by Hornung 38 We consider the epithelial tissue to be composed of a thin cellular layer supported by a thicker stromal layer. The mean optical properties found by Hornung at and were used. This set of parameters corresponds to , , and an epithelial layer thickness of . The consistent preparation of a two-layer liquid phantom with a 500- top-layer thickness proved to be difficult. As a result, we constructed an epithelial tissue phantom with spatial dimensions that are roughly double in size. To preserve optical similarity in the phantom system, the value of was kept constant in this “extended” tissue model. Thus, in the extended epithelial tissue model, the thickness of the epithelial layer is and the optical properties of the background were chosen to be and . These optical properties ensure that the extended tissue model has the same ratio of reduced scattering to absorption , while doubling the transport mean free path to . Based on these background optical properties, we prepared phantoms with perturbed optical absorption or scattering properties in either the top or bottom layer. Note that although perturbations in both and can be examined simultaneously using the proposed pMC/dMC method, we chose to examine perturbations in only one property in either of the layers to test the effectiveness of the two parameter inversion algorithm and its susceptibility to “crosstalk” between absorption and scattering properties. This led to the examination of four cases: perturbation in the (1) top layer absorption, (2) bottom layer absorption, (3) top layer scattering, and (4) bottom layer scattering. We examined perturbations to the background optical properties in the range of 50 to 400% for and 50 to 150% for . Depiction of these four cases is presented in Fig. 2 along with the range of optical properties examined. The detailed optical properties for each absorption and scattering perturbation case considered are listed in Tables 1, 2 . Note that collectively the range of optical properties tested span a broad range of to 40. Fig. 2Illustration of pMC in a two-layer geometry: (a) top layer absorption perturbation, (b) bottom layer absorption perturbation, (c) top layer scattering perturbation, and (d) bottom layer scattering perturbation. 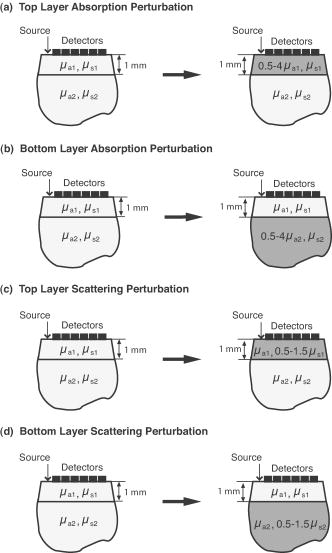 Table 1Optical properties for absorption perturbation in the extended epithelial tissue model.
Table 2Optical properties for scattering perturbation in the extended epithelial tissue model.
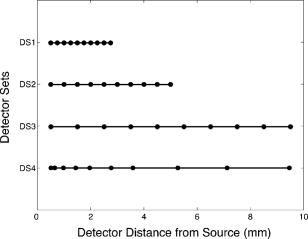
3.2.Measurement of SRDRFigure 3 provides a schematic of the experimental setup for the SRDR measurements. A cylindrical container of diameter and height was filled with an optically turbid medium composed of 10% Intralipid, nigrosin, and deionized water. The container was composed of two compartments, with top and bottom layers separated by a thin sheet of plastic film. The bottom compartment was filled with the phantom solution with optical properties corresponding to the stromal layer while a premeasured volume of the phantom solution for the epithelial layer was poured into the top compartment to provide a thickness of . A laser (JDS Uniphase, Mountain View, California) emitting at was coupled to a 200- -diam multimode optical fiber using a collimating lens. A neutral density filter was placed between the laser and fiber to attenuate the intensity of the light source delivered to the sample. To ensure that specular reflection was not captured, a fiber optic illuminator (Fiberguide, Stirling, New Jersey) was designed and fabricated to deliver light to the medium and block specular reflection from reaching the camera. The illuminator was composed of a right-angle microprism in size coupled to a fiber with numerical aperture of 0.12. The prism was used for deflecting light from the fiber for perpendicular illumination of the medium. The fiber and prism were placed in the center of a black, rectangularly shaped housing . In making the measurement, the microprism was placed flush with the tissue phantom surfaces, as shown in Fig. 3. The use of this illuminator enabled the acquisition of quality images at locations proximal to laser source without saturation and enabled the utilization of the full dynamic range of the camera. The SRDR was measured by placing the sample surface in the focal plane of a photographic lens (Nikon, Japan) coupled to a thermoelectrically cooled 16-bit CCD camera (Photometrics, Tucson, Arizona). A region on the sample surface was captured by the camera and the resulting image was binned in groups of pixels to improve the SNR. Control of the CCD readout, image storage, and data processing were provided by a personal computer (Xi computer, San Clemente, California). The spatial resolution was determined to be using a U.S. Air Force resolution standard (Edmund Scientific). Pixel intensity as a function of radial position away from the source was acquired by the camera 15 times to provide an average and standard deviation for the SRDR measurement. Figure 4 provides a contour plot from a captured image of a liquid optical phantom and also provides the raw reflectance data obtained from a line scan of the image. Fig. 4Illustration of SRDR measurement using CCD camera and illuminator: (a) intensity contour plot from a captured CCD image, and (b) extraction of spatially resolved diffuse reflectance along the line - shown in (a) for a liquid phantom. Rectangularly shaped illuminator is captured in the image (a) and scale bar in the bottom right corner represents .  To convert the measured intensity to an absolute SRDR measurement, we must account for factors such as the optical point spread function of the system, sensitivity of the CCD, spatial variations in the CCD response, and the instrument response of the system. These factors were accounted for using a calibration procedure described previously by Pham 39 This procedure consists of two steps. First, images of the diffuse reflectance were acquired from a reference phantom with known optical properties. These calibration images were taken using the same settings as those used for measurements of the layered tissue phantoms. The instrument response of the system was then calculated using the data obtained from the reference phantom and a prediction of the diffuse reflectance generated by a MC simulation using the same optical properties of the reference phantom. The raw image measured by the CCD is a convolution of the true image and the instrument response , which can be described as When Eq. 4 is Fourier transformed into the spatial frequency domain, the convolution relation is converted into a simple multiplication, so that the instrument response can be determined by the division of the Fourier transform of the raw image by the Fourier transform of the “true” image, as provided by the MC simulation. Using this instrument response, any measured intensity data can be converted into absolute reflectance using the following relationship:where and represent the Fourier and inverse Fourier transforms, respectively. This reflectance data is then fed into the pMC/dMC inversion algorithm for extraction of the optical properties.3.3.Source-Detector ConfigurationsTo study the quality of the optical property recovery with the range and spacing of detector locations used in the SRDR measurements, we analyzed the measured data using specific sets of s-d separations. The four configurations chosen are illustrated in Fig. 5 and listed in Table 3 . All sets consisted of 10 detectors each, DS1, DS2, and DS3 have detectors spaced at uniform intervals with the minimum s-d separation at and the maximum s-d separation set at , and , respectively, This range in the maximum s-d separation corresponds to a range of approximately l to of the background medium. The fourth configuration DS4 spans the same spatial range as the DS3, except that the spacing between the detectors is not constant but scaled exponentially. We examined this case to provide greater sampling in the region closest to the source where the intensity of the diffuse reflectance falls sharply and sparser sampling at more distal locations where the intensity is falling less rapidly. 3.4.Determination of Optical PropertiesOur approach to the determination of optical properties is depicted schematically in Fig. 6 . The capital letters shown in the square brackets below refer to the individual steps shown within this schematic. We use a conventional MC simulation to generate photon biographies using the s-d geometry used in the measurement. In this study, the background optical properties used were those found by Hornung, as mentioned in Sec. 3.1. However, in general, the background optical properties could either be properties of the superficial epithelial layer determined through a technique such as differential-path-length spectroscopy12, 13 or that of the supporting stromal tissue determined using SRDR measurements at s-d separations larger than a transport mean free path. Moreover, in this paper we assume that the thickness of the epithelial layer is known either from anatomical information, another imaging modality such as high-resolution ultrasound, or using optical measurement using the method proposed recently by Gandjbakhche’s group.31 For post-processing of the photon biographies, we save only information needed to compute the perturbation in the detected photon weight and the sensitivities as specified by Eqs. 2, 3. This requires only the storage of both the number of collisions and total photon path length within each tissue region as well as the angle of photon exit from the tissue upon detection. With this photon biography information generated and stored [A], pMC is used to calculate a predicted diffuse reflectance signal at each detector location using an initial set of optical properties in the perturbed region that are identical to the background (i.e., ) [B]. Note that in this case, as we are perturbing only the properties of the stromal layer or the epithelial layer. The algorithm then compares the actual experimental measurement to the radiative transport prediction provided by pMC using a least-squares metric [C]; where is the number of measurement locations, and is the standard deviation of the diffuse reflectance measurement taken at location . The metric is tested for its convergence to the minimum within a Levenberg-Marquardt algorithm as described by Press 40 [D]. The convergence criteria of the two-parameter fit requires that the vector distance between two successive iterates is less than a predefined . If the convergence criteria is not met, a new set optical properties for the perturbed region is determined using the derivative information provided by dMC using Eqs. 2, 3 [E]. We then used pMC again to generate a new estimate for the predicted reflectance signal [B].4.Results and Discussion4.1.Top Layer Absorption PerturbationFigure 7 provides the experimental SRDR measurements for a series of phantoms in which the optical absorption of the top layer is varied systematically from 50 to 400% of the background value. The arrow indicates the direction of increasing absorption in the top layer. As expected, an increase in top layer absorption results in a decrease in the SRDR over the entire range of s-d separation. Fig. 7Experimentally measured SRDR data from the extended epithelial tissue model with an absorption perturbation in the top layer. Data points shown correspond to detector set 4 (DS4). The relative error in the measured reflectance is smaller than the symbol size and less than 5% in all cases. The direction of the arrow indicates an increase of the absorption perturbation.  For recovery of the top layer optical properties, we supplied the measured SRDR data at the s-d separations specified by the detector sets described above (see Fig. 5 and Table 3) to the pMC/dMC inversion algorithm to determine the top-layer optical properties. The inversion results for each of the detector sets DS1 to DS4 are shown in Figs. 8a, 8b, 8c, 8d and provide the recovered top layer absorption and scattering coefficients as a function of the absorption perturbation in the top layer. For each detector set, we provide the results of optical property recovery from SRDR measurements made in 10 different phantoms where is held fixed and the top layer is varied between 50 and 400% of the background. The diagonal line indicates the true values of , and the horizontal line indicates the true value of . All the detector sets successfully recover the true absorption and scattering properties in the perturbed top layer and decouple the constant scattering of the top layer from the varying absorption over the entire range of the perturbation. Although there are slight overestimations of for perturbations of 300% and greater, the recovered values never deviate from the true value by more than 5%. The results obtained using detector sets DS1 and DS2 exhibit slightly larger confidence intervals for the recovery of . This likely occurs because these detector sets have a span of only 3 and , respectively, while DS3 and DS4 have a span of over . Thus detector sets DS1 and DS2 collect photons that, on average, have shorter path lengths in the medium and increases the uncertainty in the recovered value. 4.2.Bottom Layer Absorption PerturbationFigure 9 provides the SRDR for a series of phantoms in which the optical absorption of the bottom layer is varied systematically from 50 to 400% of the background value. The arrow indicates the direction of increasing absorption of the bottom layer. Similar to the case of the top layer absorption perturbation, an increase in bottom layer absorption results in a decrease in the SRDR over the entire range of s-d separation. The relative difference between the SRDR measurements is more prominent at larger s-d separations as the photons detected at these locations have longer path lengths and more opportunity to sample the bottom layer. Fig. 9Experimentally measured SRDR data from extended epithelial tissue model with an absorption perturbation in the bottom layer. Data points shown correspond to detector set 4 (DS4). The relative error in the measured reflectance is smaller than the symbol size and less than 5% in all cases. The direction of the arrow indicates an increase of the absorption perturbation.  The results of the pMC/dMC algorithm for optical property recovery of the bottom layer is given for all four detector sets in Figs. 10a, 10b, 10c, 10d , which provide the recovered bottom layer absorption and scattering as a function of the absorption perturbation in the bottom layer. For each detector set, we provide the results of optical property recovery from SRDR measurements made in 10 different phantoms, where is held fixed and the bottom layer is varied between 50 and 400% of the background. The diagonal line indicates the true values of , and the horizontal line indicates the true value of , Detector sets DS2, DS3, and DS4 all provide data to the pMC/dMC algorithm of sufficient quality to recover the true absorption and scattering properties of the bottom layer over the full range of absorption perturbation. Specifically, for DS2, DS3, and DS4 detector sets, the bottom layer is predicted with a relative error of less than 20% throughout the full range of the 50 to 400% perturbation. The unperturbed is of the bottom layer is recovered within 15% relative error. The results obtained using data provided by the DS2 detector set are particularly notable in that the accuracy in optical property recovery is similar to the DS3 and DS4 detector sets even though the span of the DS2 detector set is , about half the span used in DS3 and DS4. However, the reduced detector span of DS2 results in slightly higher uncertainties in the recovered values. 4.3.Top Layer Scattering PerturbationFigure 11 provides the SRDR measurements for a series of phantoms in which the optical scattering in the top layer is varied in the range 50 to 150% of the background value. These results show that increases in the top layer scattering result in increases in the SRDR, as indicated by the direction of the arrow in the figure. Moreover, increases in the SRDR are most noticeable at detector locations proximal to the source ( or ) and becomes insignificant at more distal locations. This occurs because detector locations proximal to the source receive photons that have interacted much more with the top layer and thus experience a greater probability of being backscattered. However, as the s-d separation increases, the photons that are detected have spent an increasing amount of time in the lower layer and thus the probability of being detected is not affected greatly by changes in top layer scattering. This lack of sensitivity of the SRDR at larger s-d separations to top layer scattering changes indicates that SRDR measurements at these locations possess little information content regarding the scattering properties of the top layer. Fig. 11Experimentally measured SRDR data from extended epithelial tissue model with a scattering perturbation in the top layer. Data points shown correspond to detector set 4 (DS4). The relative error in the measured reflectance is smaller than the symbol size and less than 5% in all cases. The direction of the arrow indicates an increase of the scattering perturbation.  These effects are clearly evident in the results for optical property recovery by the pMC/dMC algorithm, as shown in Figs. 12a, 12b, 12c, 12d , which provide the recovered top layer absorption and scattering as a function of the scattering perturbation in the top layer. For each detector set, we provide the results of optical property recovery from SRDR measurements made in 10 different phantoms where only the top layer is varied between 50 and 150% of the background. The diagonal line indicates the true values of , and the horizontal line indicates the true value of . While the top layer is recovered accurately by all detector sets for scattering perturbations in the range 70 to 130%, the recovery of is not decoupled from the changes in . For scattering perturbations of 50 to 70%, is successfully decoupled from and predicted with a relative error of , but the top layer is overestimated with a relative error as large as 40%. The best predictions are provided by detector set DS1, which has all 10 detectors placed within of the source where the SRDR is most sensitive to the top layer scattering perturbation (see Fig. 11). However, the overall success in the recovery of top layer optical properties when subject to changes in scattering using this pMC/dMC is poor. 4.4.Bottom Layer Scattering PerturbationFigure 13 provides the SRDR measurements for a series of phantoms in which optical scattering of the bottom layer is varied in the range 50 to 150% of the background value. For this range of scattering perturbation, an increase in bottom layer scattering results in a broad increase in the SRDR. An interesting feature is that the relative difference between the SRDR measurements is greatest at intermediate s-d separations of 1 to . This indicates that the highest sensitivity to the scattering changes in the bottom layer of superficial tissues (i.e., stroma) occurs not at large s-d separations, where the detected photons have sampled mostly the bottom layer, but at an intermediate region where detected photons have sampled both layers. This is consistent with the fact that for a given s-d separation, there exists sampling depth where the visitation probability by detected photons is the highest.41 Fig. 13Experimentally measured SRDR data from extended epithelial tissue model with a scattering perturbation in the bottom layer. Data points shown correspond to detector set 4 (DS4). The relative error in the measured reflectance is smaller than the symbol size and less than 5% in all cases. The direction of the arrow indicates an increase of the scattering perturbation.  Figure 14 provides the results for optical property recovery by the pMC/dMC algorithm for bottom layer scattering perturbations in the range 50 to 150%. Figures 14a, 14b, 14c, 14d provide the recovered bottom layer absorption and scattering as a function of the scattering perturbation in the top layer. For each detector set, we provide the results of optical property recovery from SRDR measurements made in 10 different phantoms where only the bottom layer is varied between 50 and 150% of the background. The diagonal line indicates the true values of , and the horizontal line indicates the true value of . Overall the pMC/dMC algorithm does a good job in recovering the bottom layer optical properties when using DS2, DS3, and DS4 detector sets for scattering perturbations in the range of 60 to 150%. The DS1 detector set does poorly and does not provide data sufficient to decouple the changes in the bottom layer from . Again we find that the DS3 and DS4 detector sets result in the best recovery of optical properties and the smallest confidence intervals for . Overall the DS3 detector set provides accurate recovery of both and with relative error of less than 20 and 5%, respectively, for scattering perturbations in the range of 60 to 150%. 5.Analysis and Discussion5.1.Sensitivity Characteristics of SRDR MeasurementsTo understand the performance characteristics of the pMC/dMC algorithm, we conducted independent two-region MC simulations with optical properties given by Tables 1, 2. Seven million photons were simulated for each perturbation case and the resulting SRDR is added with 2% noise to consider the potential impact of experimental error. Figures 15a, 15b, 15c, 15d present these MC simulated SRDR measurements for absorption [Figs. 15a and 15b] and scattering [Figs. 15c and 15d] perturbations in the top [Figs. 15a and 15c] and bottom [Figs. 15b and 15d] layers, respectively. Below each SRDR plot, we also present the percent change in the SRDR for each of the perturbation cases relative to the background. These latter figures clearly show the percentage difference of the SRDR measurement relative to the background for each of the perturbation cases considered. Fig. 15MC-simulated SRDR for extended epithelial tissue model with perturbations (top panel) and its relative reflectance difference from the unperturbed (100%) case (bottom panel). The direction of the arrow indicates the increase of perturbation. Absorption perturbation in the (a) top layer and (b) bottom layer with 50, 75, 100 (dashed line), 150, 200, 300, and 400% perturbations. Scattering perturbation in the (c) top layer and (d) bottom layer with 50, 60, 80, 100 (dashed line), 120, 140, and 150% perturbations. 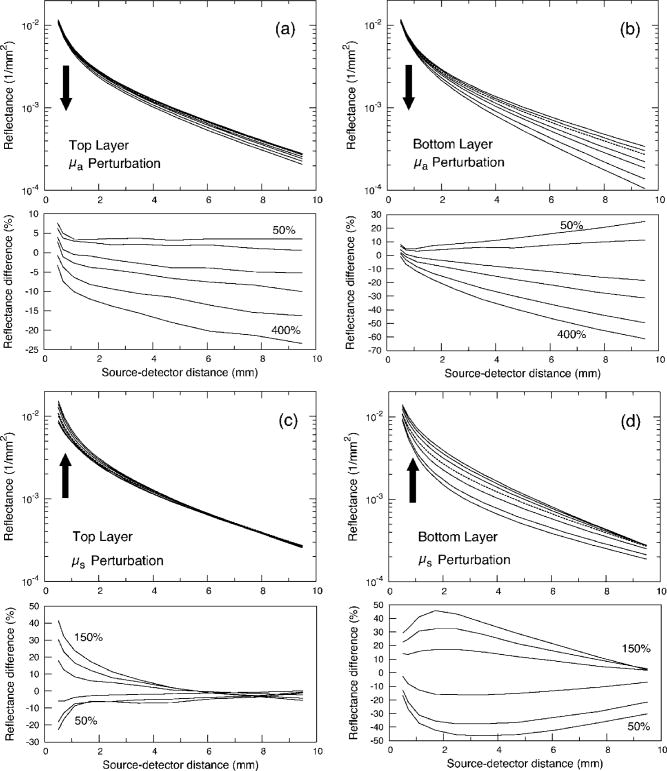 Table 3Listing of the absolute detector locations (r) and their relative location based on transport mean free path (l*) of the four detector configurations used for the recovery of optical properties of two-layer extended epithelial tissue model.
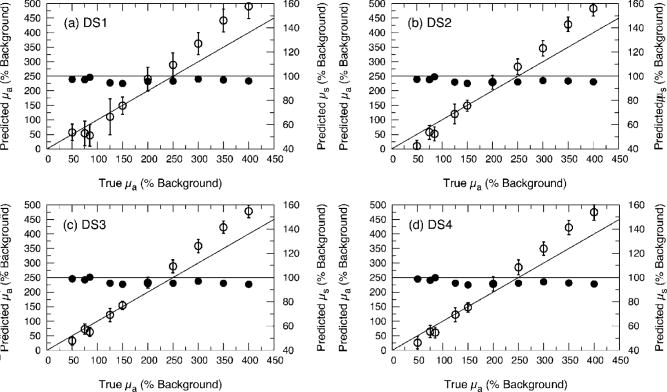
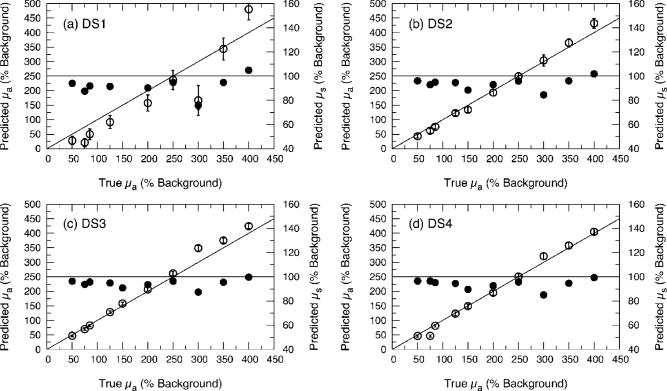
Figures 15a and 15b provide the results for absorption perturbation in the top and bottom layer, respectively. The MC results for the SRDR are consistent with the actual experimental data shown in Figs. 7 and 9, respectively. The plots displaying the percent change in the SRDR relative to the unperturbed case show that increases in either top or bottom layer absorption results in broad reductions in the SRDR over all s-d separations, the amount of reduction generally increasing with s-d separation. This is consistent with the inversion results shown in Figs. 8 and 10 where good inversion results were obtained for all detector sets except DS1 which has a maximum span of less than . This indicates that the pMC/dMC algorithm benefits greatly from the information content of the SRDR measurement at larger s-d separations. Figures 15c and 15d provide the MC simulation results for scattering perturbations in the top and bottom layers, respectively. Again, the MC results for the SRDR compare favorably to the experimental measurements shown in Figs. 11 and 13, respectively. As compared to the absorption perturbation cases considered above, scattering perturbations of the top or bottom layer provide relative changes in the SRDR with a very different character. Increases in top layer scattering result in a significant increase in the SRDR only at s-d separations . At larger s-d separations, the scattering perturbation does not provide much of a change in the SRDR. For s-d separations , increases in top layer scattering result in a slight decrease of the SRDR. By contrast, increases in bottom layer scattering result in a broad increase in the SRDR over the range of s-d separations considered. These sensitivity features are consistent with the quality of our inversion results shown in Figs. 12 and 14. While our attempted recovery of optical properties for top layer perturbations was not wholly successful, the best results were obtained for the DS1 detector set which has all detectors within of the source. As shown in Fig. 11, this is in fact the region where the SRDR is most sensitive to changes in top layer scattering. By contrast, our success in the recovery of bottom layer scattering perturbations is consistent with Fig. 13, which shows broad sensitivity to such perturbations over the entire range of s-d separation examined. As a result, detector sets DS3 and DS4, which span the entire range of s-d separations considered, provide the best-quality recovery of optical properties for bottom layer scattering perturbations. 5.2.Optical Property RecoveryOverall, optical property recovery using the pMC/dMC approach is best achieved using data provided by the DS3 detector configuration. This set consisted of 10 equispaced detectors located in the range of 0.5 to from the source. This is equivalent to having 10 equispaced detectors spanning a distance of from the source. This detector set provided excellent optical property recovery for absorption perturbations in both the epithelial and stromal layers as well as for scattering perturbations in the stromal layer. However, optical property recovery proved difficult for scattering perturbations in the top layer. In this case, we believe that the difficulty arises not due to a limitation of the pMC/dMC technique but due to the s-d configurations employed in the experimental study. As Fig. 15c demonstrates, sensitivity to changes in top layer scattering are concentrated at s-d separations of from the source. It is quite possible that processing of SRDR data from exclusively this region would result in better optical property estimates. Moreover, as suggested by recent studies,9, 10, 11 using a s-d detector geometry wherein the source is oriented not perpendicular to the tissue surface but angled at a 45-deg angle to the surface normal, may result in better interrogation of the epithelial layer and greater sensitivity of the SRDR measurement to scattering changes in the epithelial layer. We are currently investigating both these approaches. 5.3.Practical Considerations and Future DirectionsAs presented, the use of the pMC/dMC algorithm requires knowledge not only of the epithelial layer thickness but also of the optical properties of one of the two layers. Practically, the optical properties of the stromal layer can be found by processing a conventional SRDR measurement using only detector locations larger than approximately . Data from these locations are not sensitive to the optical properties of the superficial tissue layer.19, 22, 23 The pMC/dMC method can then be used to determine the properties of the epithelial layer. Alternatively, one can use approaches such as elastic scattering or differential path length methods 12, 13, 16, 17 to determine the optical properties of the epithelial tissue and use the pMC/dMC approach to determine the optical properties of the stromal layer. From an instrumentation perspective, this latter approach is particularly attractive as it is very easy to incorporate elastic scattering and/or differential path length methodology with an SRDR measurement capability within a single fiber-based probe. Note also that all of the optical property recovery results shown here were accomplished with only one background MC simulation. This one simulation provided the information necessary for the pMC/dMC algorithm to estimate the optical properties from 160 different SRDR measurement sets shown. Optical property recovery in each case required less than 10 iterations of the optimization algorithm and required less than on Pentium IV processor. Ultimately, we would like to move away from requiring a priori information for the epithelial layer thickness as well as the single-scattering asymmetry coefficient , both of which we held fixed in this study. We are currently working on more generalized formulations of the pMC/dMC algorithm to make possible the recovery of these parameters, in addition to the optical properties, from a SRDR measurement. 6.ConclusionsWe developed and validated a novel and efficient method for optical property determination of layered superficial tissues. The novelty of this method lies in the combined use of pMC and dMC methods. We used pMC to provide rapid estimates of the SRDR produced by changes in the optical properties of a heterogeneous tissue system. We used dMC to provide a sensitivity analysis of the SRDR measurement with respect to changes of the optical properties in each of the tissue regions. These two methods are used within an iterative nonlinear optimization algorithm to determine optical properties of heterogeneous structures. We demonstrated the accuracy of this method by determining optical properties of two-layered extended epithelial tissue systems using SRDR measurements acquired using a CCD camera platform. Specifically, our results demonstrate that this combined pMC/dMC approach can successfully recover optical properties for both absorption and scattering perturbations in a stromal tissue layer and absorption perturbations in an epithelial tissue layer. Since MC methods are used, the inversion technique can be applied in the transport regime, that is, on spatial scales comparable to the transport mean free path and in media where optical scattering is not required to be dominant over absorption. Our results also show that the location of detectors in the SRDR measurement has a significant impact on the accuracy of the results. Thus, an opportunity exists to optimize probe designs and spatial sampling procedures of diffuse reflectance measurements for increased sensitivity to specific physiological or structural features of superficial tissues. AcknowledgmentsWe thank Jerry Spanier for stimulating discussions. We are grateful to the National Institutes of Health for support under Grants No. P41-RR-01192 (Laser Microbeam and Medical Program) and No. R01-EB-00345. ReferencesR. Cotran,
V. Kumar, and
S. Robbins, Pathologic Basis of Disease, Saunders, Philadelphia (1994). Google Scholar
I. Pavlova,
K. Sokolov,
R. Drezek,
A. Malpica,
M. Follen, and
R. Richards-Kortum,
“Microanatomical and biochemical origins of normal and precancerous cervical autofluorescence using laser-scanning fluorescence confocal microscopy,”
Photochem. Photobiol., 77
(5), 550
–555
(2003). https://doi.org/10.1562/0031-8655(2003)077<0550:MABOON>2.0.CO;2 0031-8655 Google Scholar
C. K. Hayakawa,
J. Spanier,
F. Bevilacqua,
A. K. Dunn,
J. S. You,
B. J. Tromberg, and
V. Venugopalan,
“Perturbation Monte Carlo methods to solve inverse photon migration problems in heterogeneous tissues,”
Opt. Lett., 26
(17), 1335
–1337
(2001). 0146-9592 Google Scholar
J. S. You,
C. K. Hayakawa, and
V. Venugopalan,
“Frequency domain photon migration in the - approximation: analysis of ballistic, transport, and diffuse regimes,”
Phys. Rev. E, 72
(2), 021903
(2005). https://doi.org/10.1103/PhysRevE.72.021903 1063-651X Google Scholar
G. Kumar and
J. M. Schmitt,
“Optimal probe geometry for near-infrared spectroscopy of biological tissue,”
Appl. Opt., 36
(10), 2286
–2293
(1997). 0003-6935 Google Scholar
J. R. Mourant,
I. J. Bigio,
D. A. Jack,
T. M. Johnson, and
H. D. Miller,
“Measuring absorption coefficients in small volumes of highly scattering media: source-detector separations for which path lengths do not depend on scattering properties,”
Appl. Opt., 36
(22), 5655
–5661
(1997). 0003-6935 Google Scholar
H. Liu,
“Unified analysis of the sensitivities of reflectance and path length to scattering variations in a diffusive medium,”
Appl. Opt., 40
(10), 1742
–1746
(2001). 0003-6935 Google Scholar
T. J. Pfefer,
L. S. Matchette,
A. M. Ross, and
M. N. Ediger,
“Selective detection of fluorophore layers in turbid media: the role of fiber-optic probe design,”
Opt. Lett., 28
(2), 120
–122
(2003). 0146-9592 Google Scholar
A. M. J. Wang,
J. E. Bender,
J. Pfefer,
U. Utzinger, and
R. A. Drezek,
“Depth-sensitive reflectance measurements using obliquely oriented fiber probes,”
J. Biomed. Opt., 10
(4), 044017
(2005). https://doi.org/10.1117/1.1989335 1083-3668 Google Scholar
M. C. Skala,
G. M. Palmer,
C. F. Zhu,
Q. Liu,
K. M. Vrotsos,
C. L. Marshek-Stone,
A. Gendron-Fitzpatrick, and
N. Ramanujam,
“Investigation of fiber-optic probe designs for optical spectroscopic diagnosis of epithelial pre-cancers,”
Lasers Surg. Med., 34
(1), 25
–38
(2004). https://doi.org/10.1002/lsm.10239 0196-8092 Google Scholar
C. Zhu,
Q. Liu, and
N. Ramanujam,
“Effect of fiber optic probe geometry on depth-resolved fluorescence measurements from epithelial tissues: a Monte Carlo simulation,”
J. Biomed. Opt., 8
(2), 237
–247
(2003). https://doi.org/10.1117/1.1559058 1083-3668 Google Scholar
A. Amelink,
H. J. C. M. Sterenborg,
M. P. L. Bard, and
S. A. Burgers,
“In vivo measurement of the local optical properties of tissue by use of differential path-length spectroscopy,”
Opt. Lett., 29
(10), 1087
–1089
(2004). https://doi.org/10.1364/OL.29.001087 0146-9592 Google Scholar
A. Amelink and
H. J. C. M. Sterenborg,
“Measurement of the local optical properties of turbid media by differential path-length spectroscopy,”
Appl. Opt., 43
(15), 3048
–3054
(2004). https://doi.org/10.1364/AO.43.003048 0003-6935 Google Scholar
D. Arifler,
R. A. Schwarz,
S. K. Chang, and
R. Richards-Kortum,
“Reflectance spectroscopy for diagnosis of epithelial precancer: model-based analysis of fiber-optic probe designs to resolve spectral information from epithelium and stroma,”
Appl. Opt., 44
(20), 4291
–4305
(2005). https://doi.org/10.1364/AO.44.004291 0003-6935 Google Scholar
L. Nieman,
A. Myakov,
J. Aaron, and
K. Sokolov,
“Optical sectioning using a fiber probe with an angled illumination-collection geometry: evaluation in engineered tissue phantoms,”
Appl. Opt., 43
(6), 1308
–1319
(2004). https://doi.org/10.1364/AO.43.001308 0003-6935 Google Scholar
Y. L. Kim,
R. K. Wali,
H. K. Roy,
M. J. Goldberg,
A. K. Kromin,
K. Chen, and
V. Backman,
“Simultaneous measurement of angular and spectral properties of light scattering for characterization of tissue microarchitecture and its alteration in early precancer,”
IEEE J. Sel. Top. Quantum Electron., 9
(2), 243
–256
(2003). https://doi.org/10.1109/JSTQE.2003.814183 1077-260X Google Scholar
Y. Liu,
Y. L. Kim, and
V. Backman,
“Development of a bioengineered tissue model and its application in the investigation of the depth selectivity of polarization gating,”
Appl. Opt., 44
(12), 2288
–2299
(2005). https://doi.org/10.1364/AO.44.002288 0003-6935 Google Scholar
K. Sokolov,
L. T. Nieman,
A. Myakov, and
A. Gillenwater,
“Polarized reflectance spectroscopy for pre-cancer detection,”
Technol. Cancer Res. Treat., 3
(1), 1
–14
(2004). 1533-0346 Google Scholar
G. Alexandrakis,
T. J. Farrell, and
M. S. Patterson,
“Accuracy of the diffusion approximation in determining the optical properties of a two-layer turbid medium,”
Appl. Opt., 37
(31), 7401
–7409
(1998). 0003-6935 Google Scholar
T. J. Farrell,
M. S. Patterson, and
M. Essenpreis,
“Influence of layered tissue architecture on estimates of tissue optical properties obtained from spatially resolved diffuse reflectometry,”
Appl. Opt., 37
(10), 1958
–1972
(1998). 0003-6935 Google Scholar
Y. S. Fawzi,
A. B. M. Youssef,
M. H. El-Batanony, and
Y. M. Kadah,
“Determination of the optical properties of a two-layer tissue model by detecting photons migrating at progressively increasing depths,”
Appl. Opt., 42
(31), 6398
–6411
(2003). 0003-6935 Google Scholar
M. A. Franceschini,
S. Fantini,
L. A. Paunescu,
J. S. Maier, and
E. Gratton,
“Influence of a superficial layer in the quantitative spectroscopic study of strongly scattering media,”
Appl. Opt., 37
(31), 7447
–7458
(1998). 0003-6935 Google Scholar
B. Gelebart,
E. Tinet,
J. M. Tualle,
S. Avrillier, and
J. P. Ollivier,
“Time- and space-resolved reflectance applied to the analysis of multi-layered turbid media,”
J. Opt., 28
(6), 234
–244
(1997). https://doi.org/10.1088/0150-536X/28/6/002 0150-536X Google Scholar
A. H. Hielscher,
H. L. Liu,
B. Chance,
F. K. Tittel, and
S. L. Jacques,
“Time-resolved photon emission from layered turbid media,”
Appl. Opt., 35
(4), 719
–728
(1996). 0003-6935 Google Scholar
A. Kienle and
T. Glanzmann,
“In vivo determination of the optical properties of muscle with time-resolved reflectance using a layered model,”
Phys. Med. Biol., 44
(11), 2689
–2702
(1999). https://doi.org/10.1088/0031-9155/44/11/301 0031-9155 Google Scholar
A. Kienle,
T. Glanzmann,
G. Wagnieres, and
H. van den Bergh,
“Investigation of two-layered turbid media with time-resolved reflectance,”
Appl. Opt., 37
(28), 6852
–6862
(1998). 0003-6935 Google Scholar
F. Martelli,
A. Sassaroli,
Y. Yamada, and
G. Zaccanti,
“Method for measuring the diffusion coefficient of homogeneous and layered media,”
Opt. Lett., 25
(20), 1508
–1510
(2000). 0146-9592 Google Scholar
E. Okada,
M. Firbank,
M. Schweiger,
S. R. Arridge,
M. Cope, and
D. T. Delpy,
“Theoretical and experimental investigation of near-infrared light propagation in a model of the adult head,”
Appl. Opt., 36
(1), 21
–31
(1997). https://doi.org/10.1007/s002459900053 0003-6935 Google Scholar
T. H. Pham,
T. Spott,
L. O. Svaasand, and
B. J. Tromberg,
“Quantifying the properties of two-layer turbid media with frequency-domain diffuse reflectance,”
Appl. Opt., 39
(25), 4733
–4745
(2000). 0003-6935 Google Scholar
L. O. Svaasand,
T. Spott,
J. B. Fishkin,
T. Pham,
B. J. Tromberg, and
M. W. Berns,
“Reflectance measurements of layered media with diffuse photon-density waves: a potential tool for evaluating deep burns and subcutaneous lesions,”
Phys. Med. Biol., 44
(3), 801
–813
(1999). https://doi.org/10.1088/0031-9155/44/3/020 0031-9155 Google Scholar
D. Hattery,
B. Hattery,
V. Chernomordik,
P. Smith,
M. Loew,
J. Mulshine, and
A. Gandjbakhche,
“Differential oblique angle spectroscopy of the oral epithelium,”
J. Biomed. Opt., 9
(5), 951
–960
(2004). https://doi.org/10.1117/1.1781161 1083-3668 Google Scholar
S. K. Chang,
D. Arifler,
R. Drezek,
M. Follen, and
R. Richards-Kortum,
“Analytical model to describe fluorescence spectra of normal and preneoplastic epithelial tissue: comparison with Monte Carlo simulations and clinical measurements,”
J. Biomed. Opt., 9
(3), 511
–522
(2004). https://doi.org/10.1117/1.1695559 1083-3668 Google Scholar
K. Vishwanath and
M. Mycek,
“Time-resolved photon migration in bi-layered tissue models,”
Opt. Express, 13
(19), 4507
–4514
(2003). https://doi.org/10.1364/OPEX.13.004507 1094-4087 Google Scholar
Y. P. Kumar and
R. M. Vasu,
“Reconstruction of optical properties of low-scattering tissue using derivative estimated through perturbation Monte-Carlo method,”
J. Biomed. Opt., 9
(5), 1002
–1012
(2004). https://doi.org/10.1117/1.1778733 1083-3668 Google Scholar
P. K. Yalavarthy,
K. Karlekar,
H. S. Patel,
R. M. Vasu,
M. Pramanik,
P. C. Mathias,
B. Jain, and
P. K. Gupta,
“Experimental investigation of perturbation Monte Carlo based derivative estimation for imaging low-scattering,”
Opt. Express, 13
(3), 985
–997
(2005). https://doi.org/10.1364/OPEX.13.000985 1094-4087 Google Scholar
A. Sassaroli,
C. Blumetti,
F. Martelli,
L. Alianelli,
D. Contini,
A. Ismaelli, and
G. Zaccanti,
“Monte Carlo procedure for investigating light propagation and imaging of highly scattering media,”
Appl. Opt., 37
(31), 7392
–7400
(1998). 0003-6935 Google Scholar
J. Spanier and
E. M. Gelbard, Monte Carlo Principles and Neutron Transport Problems, Addison-Wesley, Reading, MA (1969). Google Scholar
R. Hornung,
T. H. Pham,
K. A. Keefe,
M. W. Berns,
Y. Tadir, and
B. J. Tromberg,
“Quantitative near-infrared spectroscopy of cervical dysplasia in vivo,”
Hum. Reprod., 14
(11), 2908
–2916
(1999). https://doi.org/10.1093/humrep/14.11.2908 0268-1161 Google Scholar
T. H. Pham,
C. Eker,
A. Durkin,
B. J. Tromberg, and
S. Andersson-Engels,
“Quantifying the optical properties and chromophore concentrations of turbid media by chemometric analysis of hyperspectral diffuse reflectance data collected using a fourier interferometric imaging system,”
Appl. Spectrosc., 55
(8), 1035
–1045
(2001). 0003-7028 Google Scholar
W. H. Press,
B. P. Flannery,
S. A. Teukolsky, and
W. T. Vetterling, Numerical Recipes in C: The Art of Scientific Computing, 2nd ed.Cambridge University Press, New York (1992). Google Scholar
F. Bevilacqua,
J. S. You,
C. K. Hayakawa, and
V. Venugopalan,
“Sampling tissue volumes using frequency-domain photon migration,”
Phys. Rev. E, 69
(5), 051908
(2004). https://doi.org/10.1103/PhysRevE.69.051908 1063-651X Google Scholar
|
|||||||||||||||||||||||||||||||||||||||||||||||||||||||||||||||||||||||||||||||||||||||||||||||||||||||||||||||||||||||||||||||||||||||||||||||||||||||||||||||||||||||||||||||||||||||||||||||||||||||||||||||||||||||||||||||||||