
|
|
1.IntroductionThe contractions of the heart are triggered by electrical waves of excitation propagating through the cardiac muscle from the sinus node to the ventricles. In pathological myocardium, excitation waves can break up, giving rise to rapidly rotating vortices of excitation known as spiral waves or scroll waves. Scroll waves have been implicated in dangerous arrhythmias such as ventricular tachycardia and fibrillation 1, 2, 3, 4 causing sudden cardiac death. In this paper, we explore the possibility of visualizing scroll waves using voltage-sensitive dyes. Optical imaging utilizing such dyes has become a powerful tool for the analysis of cardiac excitation (see Refs. 5, 6 and references therein). Until today that tool was used primarily in the epifluorescence (or reflection) mode, where both the light source and the detector are aimed at the epicardial surface. In this mode, however, the analysis is limited only to surface and subsurface manifestations of scroll waves.7, 8 The goal of our study is to explore a different imaging modality—transillumination—where light source and detector are located on opposite sides of the myocardial wall.9 The main advantage of this mode is the increased contribution of deeper layers to the optical signal.9 According to earlier theoretical estimates, the optical penetration depth should further increase when using absorptive rather than fluorescence dyes.10, 11 For brevity, we call this approach absorptive transillumination. In this paper, we focus on utilizing this technique to visualize the organizing center of the scroll wave, the so-called filament [see Fig. 1a ]. These filaments can have various shapes and orientations,12, 13 and can drift in cardiac tissue under various conditions. 14, 15, 16, 17 However, such a drift usually occurs on a longer time scale than the actual scroll wave rotation. Another property of the filament is that the cells inside it remain unexcited during scroll wave rotation, a fact that distinguishes the filament from the rest of the myocardium and can be used for its visualization. Amplitude maps,4, 18 among the tools to be utilized in this study, are based on this property. Fig. 1Absorptive transillumination imaging of intramyocardial scroll waves: (a) schematic of a scroll wave rotating around its filament and (b) the setup of absorptive transillumination used in our computational study of intramyocardial scroll waves: a slab of cardiac tissue is uniformly illuminated on the endocardium by a source that provides light in the near IR spectrum . Optical signals emanating from scroll waves are recorded from the epicardial surface. The simulated scroll wave is depicted using a linear gray scale in the slab: white corresponds to a transmembrane potential of , black to (resting state). A white circle indicates the filament’s position. Note that the scroll wave is distorted due to the tissue anisotropy. 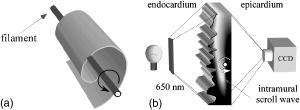 To assess the potential of absorptive transillumination for imaging scroll wave filaments we simulate scroll waves at various depths. In each simulation, we calculate sequences of transillumination images produced by the scroll wave at various phases of rotation (optical movies). The scroll waves are initiated in such a way that their filaments are parallel to the myocardial surfaces, and the rotation occurs in the transmural plane. Scroll waves with such filament orientations are known in the literature as intramural scroll waves.12 Unlike the transmural scroll waves, they do not produce characteristic spiral waves on the surface and cannot be as readily identified from conventional epifluorescence recordings. In our study, we use a realistic slab model of ventricular tissue with a smooth epicardial but trabeculated endocardial surface [see Fig. 1b]. The computations use a detailed ionic model of electrical excitation (LRd), coupled to a photon transport model for cardiac tissue as described in Refs. 10, 19. The photon diffusion equations are solved numerically;20 optical parameters were chosen to represent near-IR absorptive dyes, such as RH-155 (Ref. 10). To identify the filaments in sequences of transillumination images we use amplitude maps and time-space plots4, 18, 21 (TSPs) as well as power-of-dominant-frequency (PDF) maps.22 While the first two methods have been adopted from the imaging of scroll waves in chemical excitable media, the PDF approach has not been previously attempted for filament localization. Our simulations suggest that absorptive transillumination can be an efficient tool for the detection of intramural scroll waves. Using either of the three filament detection methods already mentioned, we were able to visualize intramyocardial filaments all the way through the thickness of the myocardial wall (6 to ). Neither variations in the thickness of the myocardial wall nor noise impeded the detection of intramural filaments. 2.Methods2.1.Model of Cardiac Electrical ActivityThe propagation of an action potential in cardiac tissue is modeled by the following reaction-diffusion equation: where is the transmembrane potential; is the membrane capacitance; is the position vector; is the diffusivity tensor, where is the conductivity tensor and the surface-to-volume ratio of the cell; and represents the total transmembrane ionic current. It was calculated using the latest variant of the dynamic Luo-Rudy model23 (LRd).We simulated a 3-D slab of the myocardial wall representing a portion of the porcine right ventricular wall. We defined the direction to be transmural from epi- to endocardium, and the and directions to be parallel with the epicardial surface. The planar dimensions of the slab were . We considered a flat epicardial surface and an irregular trabeculated endocardial surface (see Fig. 1), simulated by varying the thickness of the slab from 6 to . In some simulations, we considered a regular slab with uniform thickness of . The diffusivity tensor was defined as in Ref. 24, to account for the anisotropic properties of cardiac tissue due to transmural fiber rotation. In all simulations, the diffusivity in the longitudinal direction was and in the transverse direction was . For these values, the conduction velocities of planar waves in longitudinal and transverse directions were 65 and , respectively. The transmural fiber rotation angle was assumed to be a linear function of the depth: . The rate of rotation was set at , based on experimental measurements.25 Inside the trabeculae had the constant value of . In some simulations, we considered a constant fiber orientation of at all depths. We obtained intramural scroll waves using an S1-S2 cross-field stimulation protocol. The depth of the filament was controlled by varying the thickness of the S2 electrode. A transmural cross section of such a scroll wave is shown in Fig. 2 (upper row). A typical simulation lasted for 10 scroll wave rotation cycles. We did not simulate scroll waves inside the trabeculae. Fig. 2Electrical and optical signals during intramural reentrant activity: (a) two snapshots of the intramural scroll wave in a transmural cross section. The filament (white disk) is located at from the epicardial surface and (b) the corresponding simulated “raw” optical images of the epicardium. Variations in brightness reflect the variations in thickness. The dashed line indicates the position of the filament. (c) The same images as in (b) after processing, which includes normalization, spatial and temporal filtering (see text for details), and subtraction of the background. (d) Optical action potentials in two points indicated by asterisks in (a), (b), and (c), respectively.  To integrate Eq. 1 we used an explicit scheme, as described in Ref. 26, using a time step of and a space step of . The phase-field method, as presented in Ref. 27, was used to ensure no-flux boundary conditions at the irregular endocardial surface. Simulations were carried out on a parallel cluster consisting of 16 dual AMD Athlon processors running at . We used the MPI library and a “domain slicing” algorithm to parallelize the code.28 A typical simulation took approximately of central processing unit time. 2.2.Synthesis of Voltage-Sensitive Optical SignalsThe light propagation in cardiac tissue is described by the time-independent diffusion equation: 10, 19, 29, 30 where is the photon density within the tissue due to an inclusion (source or sink) , is the constant photon diffusivity and equals , is the reduced scattering coefficient, and is the photon absorption coefficient. Zero boundary conditions were assumed at all surfaces10, 19 except for the endocardium illuminated by the excitation light, where we set .The voltage-dependent changes of the absorption properties of the dyes were modeled through the source function in Eq. 2. We assumed that the absorption at a given point in the cardiac tissue is proportional to the intensity of the light reaching that point and depends linearly on the transmembrane potential at that point:19 where is a proportionality factor that takes into account the quantum yield of the dye and the fractional change in emission or absorption in response to voltage changes, and equals the resting potential. The sign in Eq. 3 was chosen to be negative for absorptive dyes (absorption of photons), differing from the positive sign used for fluorescent dyes.19Light propagation in the red spectrum is modeled using the following values for the optical parameters: and , yielding . These were determined experimentally at a wavelength of characteristic for absorptive dyes.31 The chosen parameter values yield an attenuation length of . For comparison, we also performed simulations of the widely used fluorescent dye DI-4-ANEPPS. In this case, we used the same parameter values as in Ref. 19. The recorded surface distribution of voltage-dependent signals was calculated using Fick’s law at the tissue boundary. To mimic the static background produced by dye molecules bound to membranes different from the cell membrane, we assumed a homogeneous voltage-independent distribution of absorption through a source . The background signal was calculated by solving Eq. 2 for this source term, and its amplitude was adjusted through the parameter to yield a signal-to-background ratio of 0.1, as was found in preliminary experimental studies4 using the absorptive dye RH-155. We also modeled noise in the optical signals through addition of a matrix of normally distributed random numbers. The SNR was set to 10, to mimic a typical optical mapping experiment.4 Equations 2, 3 were solved numerically using a relaxation technique.32 This was achieved by introducing a pseudotime variable in the optical model and a term on the right-hand side of Eq. 2. An iterative scheme using finite differences (space step ) was applied at each time step of the electrical model. The result of the ’th step with respect to the was used as an initial condition for the ’th iteration. As an initial condition we set . The resulting series converged toward the solution of Eq. 2 and the iteration was stopped when the convergence criterion was satisfied in all points of the slab. The number of iterations required varied from 50 to 3000 at different times of the wave propagation. The computation of the optical signals was implemented in and ran on a single Pentium 4 processor at . 2.3.Analysis of Optical SignalsTo mimic experiments we applied temporal and spatial filters with and kernel sizes, respectively. To detect the filament of intramural scroll waves, we used the following methods: TSP method:4, 18 scroll wave activity was identified and localized by the presence of typical “zigzag” patterns. TSPs were obtained by plotting the optical signal over time along a line perpendicular to the intramural filament. The position of the filament was inferred from the area where left and right branches in the TSP intersect (see Sec. 3). Amplitude maps:4, 21 in this study, we obtained amplitude maps by measuring the maximal amplitude of the optical signal in each pixel over one activation cycle. We normalized the maps for each depth of the intramural filament separately, to enable better comparison. The epicardial projection of the filament was identified as a region of minimal amplitude. PDF maps:22 spectral analysis of the optical signal was performed using the fast Fourier transform (FFT) of the optical signal over 10 scroll wave rotations . The minimal PDF indicated the position of the filament’s projection on the epicardium. 3.Results3.1.Absorptive Transillumination Optical Signal of an Intramural Scroll WaveWe began by simulating intramural scroll waves at different depths and calculating respective transillumination signals (see Sec. 2). Figure 2a shows two snapshots of membrane potential during scroll wave activity in a transmural cross section of the slab. The snapshots are separated by one half of the rotation period of the intramural scroll . The filament of the scroll wave (indicated by a white disk) is located at from the epicardial surface. The corresponding snapshots of the “raw” surface optical signal produced by this scroll are shown in Fig. 2b. One can see significant variations in the background signal: its intensity roughly follows the profile of the endocardial surface. It is largest where the tissue is thinnest, while the opposite is true for the thicker portions of the slab. The voltage-dependent part of the signal is unnoticeable, as both snapshots look almost identical. It can, however, be clearly observed in time recordings of individual pixels. Figure 2d shows electrical and optical action potentials recorded in a thick region (point ) and a thinner region of the slab (point ). The upper tracings show the electrical action potentials. The middle tracings show “raw” optical action potentials after subtraction of the background fluorescence. The effects of noise are much more pronounced in the thick portions of the slab, because of the lower signal amplitude. The spatial excitation patterns become apparent after subtraction and normalization by the background intensity . The effects of noise can be reduced by applying spatial and temporal filters. Figure 2c shows the optical images after such processing: in the first snapshot the optical signal is strongest left of the filament (dashed line), while in the second snapshot the optical wave has propagated to the right side of the slab. This is consistent with the overall wave propagation depicted in the transmural cross sections [Fig. 2a]. These instantaneous optical images are insufficient to reveal the presence of an intramural scroll wave. To detect those, the analysis of the whole temporal sequence of images is required. In the following, we compare the sensitivities of three different methods for the detection of intramural scroll waves in absorptive and fluorescent transillumination. We considered scroll waves with rectilinear filaments parallel to the epicardial surface. Figure 3a depicts amplitude maps (maximal amplitude over one rotation) in transmural cross sections for scroll waves at three selected depths: 1.8, 3.2 and . The region of low amplitude (dark region) corresponds to the filament’s cross section or core. The core size and its shape change significantly as the scroll wave’s depth varies. The variations in core size and shape are the result of the transmural fiber rotation: in the deeper layers of the slab, the fibers are more aligned with the filament, resulting in a smaller and more circular core. Note also that the filament is located in different portions of the slab with different local thicknesses. The lateral shift of the filament is a consequence of the specific protocol used for the initiation of scroll waves (see Sec. 2). Fig. 3Detection of scroll waves using amplitude maps: (a) the amplitude maps of the electrical activity in a transmural cross section of the slab, the bottom tracings show the amplitude profile along the dotted line in the amplitude maps, and (b) the corresponding normalized amplitude maps of the epicardial optical signal. White indicates maximal amplitude of 1.0, while black encodes for the lowest amplitudes (different in each image). A white dashed line indicates the position of the intramural filament. The bottom tracings show the amplitude profile along the dotted line in the amplitude maps.  3.2.Detection Using Amplitude Maps and TSPsAn image of the filament’s projection onto the epicardial surface can be obtained by calculating the amplitude map of the optical signal (see Sec. 2). Figure 3b shows amplitude maps of the optical signal for the scroll wave filaments depicted in Fig. 3a. In each map, a region of low amplitude can be distinguished, right above the filament. At , the dark band is quite broad and becomes narrower as the depth of the filament increases, as can be seen from the normalized amplitude profiles obtained along the dotted line in the corresponding amplitude maps. The latter can be quantified by measuring the full width at half minimum (FWHM) and the difference between minimal and maximal intensities of the amplitude map , as depicted in the middle tracing. Figure 4 depicts FWHM and as a function of the filament depth (solid line). FWHM shows a significant decrease from the epicardium up to depths of , followed by a plateau and slight increase at larger depths [Fig. 4a]. In contrast, has a pronounced peak in the middle of the slab , whereas closer to the epi or endocardial surface is significantly smaller. Fig. 4Characteristics of the filament “image” on the amplitude map: (a) how the FWHM of the filament image varies with the depth of the filament. The two curves represent simulations with fiber rotation (solid line) and without fiber rotation (dotted line). The numbers indicate the core size for each depth of the intramural scroll wave in the irregular slab. (b) How the difference between maximal and minimal amplitude depends on . Simulations were performed in the irregular slab model described in Sec. 2 (solid line) and in a regular slab of uniform thickness of (dotted line). The numbers indicate the local tissue thickness in millimeters for each depth of the filament in the irregular slab.  The rapid drop in FWHM with in Fig. 4a is a result of the changing core size due to the fiber rotation (indicated in millimeters for each data point). When we eliminated the fiber rotation, we did not see any drop in FWHM, but only a slight increase due to the increased optical scattering. The dotted line in Fig. 4a shows FWHM when the fiber angle was set at the constant value of for all layers. This yields a core size of at all depths. In this case, FWHM increases from 3.1 to as the depth of the filament increased from 1.8 to , solely due to scattering. Both curves in Fig. 4a coincide at large depths, confirming our hypothesis on the role of core size and optical diffusion on FWHM of amplitude maps. Significant variations of are primarily caused by local variations in thickness. The dotted line in Fig. 4b shows the results of simulations utilizing a regular slab of uniform thickness of . Although shows some variations in the regular slab ( is reduced near the epicardial surface due to loss of photons at the boundary), the effect is rather small when compared to the irregular slab (solid line). The solid curve (varying thickness) is always above the dotted one (constant thickness) when the local tissue thickness, indicated in millimeters for each data point, is lower than and is below the dotted curve when the local tissue thickness is higher than . Both curves intersect at local tissue thicknesses of . This strong correlation supports our hypothesis on the effects of tissue thickness on . Figure 5a shows TSPs derived from the same data set as in Fig. 3. They were obtained by visualizing the spatiotemporal behavior of the optical signal along a line perpendicular to the filament’s projection. The rotating excitation gives rise to a zigzag pattern with two mutually phase-shifted branches (left and right), which is a signature of rotating waves. The center of the zigzag pattern (dashed line) is a good approximation to the filament’s location, which is depicted in Fig. 5b using amplitude maps in a transmural cross section. The filament is readily identifiable for all investigated depths [compare Figs. 5a and 5b]. Fig. 5Detection of scroll wave filaments using the TSP method: (a) optical TSPs for three selected depths of the filament (dashed line); 1.8, 3.2, and , where the TSPs were obtained along a line perpendicular to the filament’s epicardial projection, and (b) the respective amplitude maps of the electrical activity in a transmural cross section.  3.3.Detection Based on PDF MapsWe discovered that PDF maps of the optical signal, which were previously used for the analysis of fibrillation,22 can also be used for the detection of intramural filaments. Figure 6a shows normalized power of the dominant frequency (PDF) maps for the optical signals emanating from intramural scroll waves at several depths (top row). In all cases, the dominant frequency was , which is the activation frequency of the scroll wave. For each depth of the intramural scroll wave, a narrow region of low power of the dominant frequency is observed above the filament. Fig. 6Detection of intramural filament using PDF maps. (a) Normalized power of the dominant frequency (PDF) maps for selected depths of the filament: 1.8, 2.5, 3.2, 3.9 and 4.6 mm. White stands for maximal power, black for minimal power. The filament appears as a region of low power. (b) Power spectra for each depth of the scroll wave in a point directly above (point ) and far away from the filament (point ), respectively. (c) Optical action potentials above the filament (point ) and far from the filament (point ) during two scroll wave rotations. The power spectra were obtained by a FFT over 10 scroll wave rotations. 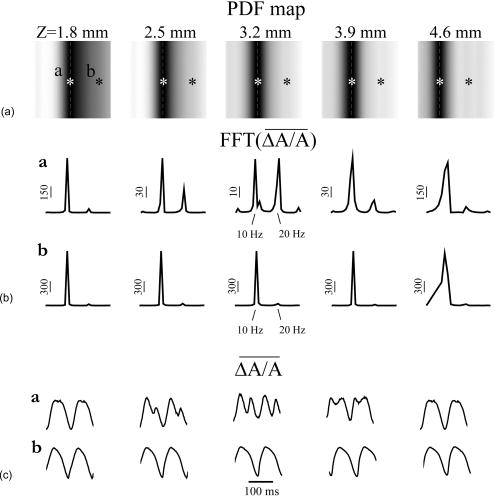 Analysis of the underlying spectra [Fig. 6b] shows that the drop in power of the dominant frequency occurs due to an increase of the power in the second harmonic at , right above the filament (point ). These effects are most pronounced for the scroll wave located at below the epicardial surface, roughly in the middle of the slab. In this case, the second harmonic is comparable to the first harmonic at point . The overall power is decreased by a factor of 30. Note the almost nonexistent second harmonic and large spectrum power away from the filament (point ). The increased power of the second harmonic near the filament is explained by the occurrence of dual-humped optical action potentials directly above the filament. The two humps reflect the wave crossing the line-of-sight twice over one scroll wave rotation within the tissue volume that contributes to the optical signal.7, 8 Figure 6c shows optical recordings during two scroll wave rotations directly above the filament (point ) and away from the filament (point ). Directly above the filament dual-humped action potentials are observed, whereas normal action potentials were found far from the filament. The second hump observed in the optical action potential close to the reentrant core affects the power spectrum of the optical signal by making a substantial contribution to the second harmonic at , thus increasing its power relative to the first harmonic at . 3.4.Comparison with Fluorescent TransilluminationWhile absorptive transillumination gives good results for all investigated depths of the filament, this is not the case for fluorescent dyes. Figure 7 illustrates the filament detection methods applied to fluorescent (fluo) and absorptive (abs) transillumination for an intramural scroll wave at 1.8 and depth. Close to the epicardial surface , the quality of the filament visualization is significantly lower in the case of fluorescent transillumination, independent of the detection method. Specifically, the TSP does not exhibit the typical zigzag pattern and the amplitude and PDF maps show only a faint and smeared projection of the filament, as opposed to the sharper images obtained using absorptive transillumination. However, closer to the illuminated endocardial surface , fluorescent transillumination succeeds in detecting intramural filaments as well as absorptive transillumination does. Fig. 7Filament detection methods applied to fluorescent (fluo) and absorptive (abs) transillumination for an intramural scroll wave at 1.8 (left) and (right) depths. Profiles of the amplitude and PDF maps were obtained along the dotted line. One can see that close to the epicardium fluorescent transillumination fails to detect the intramural scroll wave, whereas close to the endocardium both methods give similar results.  We quantified the quality of the filament detection using amplitude maps by investigating how the contrast of the image changed as a function of the depth of the scroll wave. Contrast was defined as ratio . Figure 8 compares the contrast versus for absorptive (abs) and fluorescent (fluo) transillumination. Close to the endocardial surface , fluorescent transillumination yields higher contrasts. However, throughout the bulk of the myocardial wall, absorptive transillumination provides the sharpest filament projections. Indeed, as the filament gets closer to the epicardium, the quality of the amplitude map deteriorates rapidly for fluorescent transillumination. This observation is in accordance with previous experimental and theoretical studies,9, 10 showing a skew of the optical weight toward the illuminated surface. 4.DiscussionThe goal of this project was to assess the effectiveness of a novel optical mapping method, transillumination, in the detection of deeply located intramural scroll waves. The rationale for our study is the well-known fact that standard optical mapping techniques using epifluorescence have a limited depth penetration inside the myocardium. 9, 33, 34, 35, 36 A recent experimental study performed by Efimov indicated the feasibility of identifying intramyocardial scroll waves by the typical “dual-humped” optical signals they produce above their filaments.7 The two humps reflect the wave crossing the line of sight twice over one scroll wave rotation. However, dual-humped epifluorescence signals can be observed only when the filament of the intramyocardial scroll wave is within a few hundred micrometer of the epicardium.8 Here we demonstrate that by utilizing transillumination one should be able to detect scroll wave filaments throughout the myocardial wall. Our simulations predict a significant difference between absorptive and fluorescent dyes. While in absorptive transillumination scroll waves can be detected throughout the myocardial wall, in fluorescent transillumination only scroll waves sufficiently close to the illuminated endocardial surface could be visualized (Figs. 7 and 8). This asymmetry between the surfaces is due to the different penetration depths of the excitation and the emission light.9, 10 The first has a shorter wavelength than the latter and therefore penetrates less well in cardiac tissue, resulting in larger optical weights close to the excitation light source. The difference in excitation and emission penetration depths depends on the choice of fluorescent dye. For example, for DI-4-ANEPPS this difference is usually19, 31, 35 about . An interesting idea to partially alleviate this problem was recently proposed by Ramshesh and Knisley.37 In this study a fluorescence absorber was coloaded with DI-4ANEPPS, thus bringing the penetration depth of emission closer to the excitation’s penetration depth. In absorptive imaging, however, there is only one wavelength involved. The distribution of the optical weight of intramural layers is therefore naturally uniform. In this study, we tested three methods for the detection of intramural filaments. While in silico the three methods have similar sensitivities, in experiments one can anticipate scenarios in which one method would have some advantages over another. Specifically, in the case of stationary scroll waves, amplitude maps are less cumbersome than TSPs in the visualization of the filament. However, scroll waves are also known to meander or drift in cardiac tissue under certain conditions. 14, 15, 16, 17 In such cases, TSPs should be preferred over amplitude maps, because the latter require the filament to remain localized for at least one scroll wave rotation, while the former does not have this limitation. One of the interesting findings of our study is that PDF maps, which were used earlier in other applications,22 can also be applied to the detection of stationary intramural scroll waves. In such maps, the filament is found to appear as a region of low power of the dominant frequency. This is due to the increased importance of the second harmonic in the spectrum, resulting from the presence of dual-humped action potentials.7 While the experimental detection of the filament deep inside the myocardial wall is itself a significant achievement, note that the methods proposed here exploit only a projection of the filament on the investigated surface. Such a single projection is, however, insufficient to determine the depth of the filament. To derive the depth, one should use multiple projections as has been done for the Belousov-Zhabotinsky (BZ) reaction,21 or apply inversion algorithms as developed in optical diffusion tomography.30 4.1.Limitations of the ModelFor the purpose of this study, we focused on linear intramural filaments parallel to the epicardium. In reality, filaments are likely to have more complex 3–D shapes.12 However, experimental studies of the BZ reaction have shown that complex filament shapes can be visualized as long as the complete filament projection can be recovered off the surface.21, 38 In this study, our data show that in the case of absorptive transillumination all tissue layers contribute almost equally to the optical signal. This indicates the feasibility of the proposed methods for different filament shapes. We used a monodomain approach for the reaction-diffusion properties of cardiac tissue, neglecting its bidomain structure consisting of intracellular and extracellular media. Boundary conditions at the tissue-bath and tissue-air interfaces, which can only be properly addressed using a bidomain model, have been shown to influence the dynamics of intramural filaments that are close to a boundary.39 In this study, however, we investigated intramural scroll waves that were sufficiently distant from the epi- and endocardial surface (at least ). For such deeply located filaments, it is reasonable to use a monodomain model. Our optical model assumed Dirichlet boundary conditions at the tissue surfaces. This approach does not take into account reflection of light at the tissue-bath interface due to refractive index mismatches. This would require the use of so-called Robin or mixed boundary conditions.40, 41 However, our group recently showed that differences in optical resolution resulting from the use of different boundary conditions were only noticeable for electrical sources close to the tissue surfaces.11 The shape of the optical action potential remained unaffected in all cases. Therefore, it is to be expected that our results obtained for deeply located intramural scroll waves should hold unchanged with Robin boundary conditions as well. AcknowledgmentsThe authors would like to thank Dr. M. Wellner, Dr. C. Zemlin, and R. Smith for useful discussions. This research was supported by National Institutes of Health (NIH) grants R01-HL071635 and R01-HL071762. Olivier Bernus is a postdoctoral fellow of the Research Foundation–Flanders (FWO-Vlaanderen). ReferencesA. T. Winfree,
“Electrical turbulence in three-dimensional heart muscle,”
Science, 266 1003
–1006
(1994). https://doi.org/10.1126/science.7973648 0036-8075 Google Scholar
R. A. Gray,
A. M. Pertsov, and
J. Jalife,
“Spatial and temporal organization during cardiac fibrillation,”
Nature (London), 392 75
–78
(1998). https://doi.org/10.1038/32164 0028-0836 Google Scholar
F. X. Witkowski,
L. J. Leon,
P. A. Penkoske,
W. R. Giles,
M. L. Spano,
W. L. Ditto, and
A. T. Winfree,
“Spatiotemporal evolution of ventricular fibrillation,”
Nature (London), 392 78
–82
(1998). https://doi.org/10.1038/32170 0028-0836 Google Scholar
A. M. Pertsov,
“Three-dimensional organization of reentry in fibrillating ventricular wall,”
Computer Simulation and Experimental Assessment of Cardiac Electrophysiology, Futura Publishing, Armonk, NY (2001). Google Scholar
D. S. Rosenbaum and
J. Jalife, Optical Mapping of Cardiac Excitation and Arrhythmias, Futura Publishing, Armonk, NY (2001). Google Scholar
I. R. Efimov,
V. P. Nikolski, and
G. Salama,
“Optical imaging of the heart,”
Circ. Res., 95 21
–33
(2004). 0009-7330 Google Scholar
I. R. Efimov,
V. Sidorov,
Y. Cheng, and
B. Wollenzier,
“Evidence of three-dimensional scroll waves with ribbon-shaped filament as a mechanism of ventricular tachycardia in the isolated rabbit heart,”
J. Cardiovasc. Electrophysiol., 10 1452
–1462
(1999). 1045-3873 Google Scholar
M. A. Bray and
J. P. Wikswo,
“Examination of optical depth effects on fluorescence imaging of cardiac propagation,”
Biophys. J., 85 4134
–4145
(2003). 0006-3495 Google Scholar
W. T. Baxter,
S. F. Mironov,
A. V. Zaitsev,
J. Jalife, and
A. M. Pertsov,
“Visualizing excitation waves inside cardiac muscle using transillumination,”
Biophys. J., 80 516
–530
(2001). 0006-3495 Google Scholar
O. Bernus,
M. Wellner,
S. F. Mironov, and
A. M. Pertsov,
“Simulation of voltage-sensitive optical signals in three-dimensional slabs of cardiac tissue: application to transillumination and coaxial imaging methods,”
Phys. Med. Biol., 50 215
–229
(2005). https://doi.org/10.1088/0031-9155/50/2/003 0031-9155 Google Scholar
O. Bernus,
V. D. Khait,
M. Wellner,
S. F. Mironov, and
A. M. Pertsov,
“The forward problem in optical mapping of electrical activity in the heart: application to various imaging methods,”
Proc. SPIE, 5696 13
–24
(2005). 0277-786X Google Scholar
A. M. Pertsov,
“Scroll waves in three-dimensional cardiac muscle,”
Cardiac Electrophysiology: From Cell to Bedside, 336
–344 Saunders, Philadelphia, pp.2000). Google Scholar
M. Wellner,
O. Berenfeld,
J. Jalife, and
A. M. Pertsov,
“Minimal principle for rotor filaments,”
Proc. Natl. Acad. Sci. U.S.A., 99 8015
–8018
(2002). https://doi.org/10.1073/pnas.112026199 0027-8424 Google Scholar
F. Fenton and
A. Karma,
“Vortex dynamics in three-dimensional continuous myocardium with fiber rotation: filament instability and fibrillation,”
Chaos, 8 20
–47
(1998). https://doi.org/10.1063/1.166311 1054-1500 Google Scholar
K. H. Ten Tusscher and
A. V. Panfilov,
“Reentry in heterogeneous cardiac tissue described by the Luo-Rudy ventricular action potential model,”
Am. J. Physiol. Heart Circ. Physiol., 284 H542
–H548
(2003). 0363-6135 Google Scholar
M. Vinson,
A. M. Pertsov, and
J. Jalife,
“Anchoring of vortex filaments in 3D excitable media,”
Physica D, 72 119
–134
(1993). https://doi.org/10.1016/0167-2789(94)90171-6 0167-2789 Google Scholar
I. R. Efimov,
V. I. Krinsky, and
J. Jalife,
“Dynamics of rotating vortices in the Beeler-Reuter model of cardiac tissue,”
Chaos, Solitons Fractals, 5 513
–526
(1995). https://doi.org/10.1016/0960-0779(95)95761-F 0960-0779 Google Scholar
A. Pertsov,
M. Vinson, and
S. C. Muller,
“3-dimensional reconstruction of organizing centers in excitable chemical media,”
Physica D, 63 233
–240
(1993). 0167-2789 Google Scholar
C. J. Hyatt,
S. F. Mironov,
M. Wellner,
O. Berenfeld,
A. K. Popp,
D. A. Weitz,
J. Jalife, and
A. M. Pertsov,
“Synthesis of voltage-sensitive fluorescence signals from three-dimensional myocardial activation patterns,”
Biophys. J., 85 2673
–2683
(2003). 0006-3495 Google Scholar
M. J. Bishop,
B. Rodriguez,
J. Eason,
J. P. Whiteley,
N. Trayanova, and
D. J. Gavaghan,
“Synthesis of voltage-sensitive optical signals: application to panoramic optical mapping,”
Biophys. J., 90 2938
–2945
(2006). 0006-3495 Google Scholar
S. Mironov,
M. Vinson,
S. Mulvey, and
A. Pertsov,
“Destabilisation of three-dimensional rotating chemical waves in an inhomogeneous BZ reaction,”
J. Phys. Chem., 100 1975
–1983
(1996). https://doi.org/10.1021/jp952556s 0022-3654 Google Scholar
A. V. Zaitsev,
O. Berenfeld,
S. F. Mironov,
J. Jalife, and
A. M. Pertsov,
“Distribution of excitation frequencies on the epicardial and endocardial surfaces of fibrillating ventricular wall of the sheep heart,”
Circ. Res., 86 408
–417
(2000). 0009-7330 Google Scholar
G. M. Faber and
Y. Rudy,
“Action potential and contractility changes in overloaded cardiac myocytes: a simulation study,”
Biophys. J., 78 2392
–2404
(2000). 0006-3495 Google Scholar
O. Berenfeld and
A. M. Pertsov,
“Dynamics of intramural scroll waves in three-dimensional continuous myocardium with rotational anisotropy,”
J. Theor. Biol., 199 383
–394
(1999). https://doi.org/10.1006/jtbi.1999.0965 0022-5193 Google Scholar
D. Streeter, Handbook of Physiology, American Physiological Society, Bethesda, MD (1979). Google Scholar
O. Bernus,
M. Wellner, and
A. M. Pertsov,
“Intramural wave propagation in cardiac tissue: asymptotic solutions and cusp waves,”
Phys. Rev. E, 70 061913
(2004). https://doi.org/10.1103/PhysRevE.70.061913 1063-651X Google Scholar
F. H. Fenton,
E. M. Cherry,
A. Karma, and
W. J. Rappel,
“Modeling wave propagation in realistic heart geometries using the phase-field method,”
Chaos, 15 013502
(2005). https://doi.org/10.1063/1.1840311 1054-1500 Google Scholar
R. Zaritsky and
A. M. Pertsov,
“Simulation of 2-D spiral wave interactions on a Pentium-based cluster,”
Proc. of Neural, Parallel, and Scientific Computation, Dynamic Publisher, Atlanta, (2002). Google Scholar
A. Ishimaru, Wave Propagation and Scattering in Random Media, Academic, New York (1978). Google Scholar
S. R. Arridge and
J. C. Hebden,
“Optical imaging in medicine: II. Modelling and reconstruction,”
Phys. Med. Biol., 42 841
–853
(1997). https://doi.org/10.1088/0031-9155/42/5/008 0031-9155 Google Scholar
A. Popp,
A. M. Pertsov, and
D. Weitz,
“Internal point spread imaging of cardiac tissue to provide depth resolution for bulk tissue imaging experiments,”
Proc. SPIE, 4431 141
–152
(2001). 0277-786X Google Scholar
W. H. Press,
S. A. Teukolsky,
W. T. Vetterling, and
B. P. Flannery, Numerical Recipes in C, 2nd ed.Cambridge University Press, New York (1992). Google Scholar
S. B. Knisley,
“Transmembrane voltage changes during unipolar stimulation of rabbit ventricle,”
Circ. Res., 77 1229
–1239
(1995). 0009-7330 Google Scholar
S. D. Girouard,
K. R. Laurita, and
D. S. Rosenbaum,
“Unique properties of cardiac action potentials recorded with voltage-sensitive dyes,”
J. Cardiovasc. Electrophysiol., 7 1024
–1038
(1996). 1045-3873 Google Scholar
L. Ding,
R. Splinter, and
S. B. Knisley,
“Quantifying spatial localization of optical mapping using Monte Carlo simulations,”
IEEE Trans. Biomed. Eng., 48 1098
–1107
(2001). https://doi.org/10.1109/10.951512 0018-9294 Google Scholar
D. L. Janks and
B. J. Roth,
“Averaging over depth during optical mapping of unipolar stimulation,”
IEEE Trans. Biomed. Eng., 49 1051
–1054
(2002). 0018-9294 Google Scholar
V. K. Ramshesh and
S. B. Knisley,
“Use of light absorbers to alter optical interrogation with epi-illumination and transillumination in three-dimensional cardiac models,”
J. Biomed. Opt., 11 024019
(2006). https://doi.org/10.1117/1.2187012 1083-3668 Google Scholar
M. Vinson,
S. Mironov,
S. Mulvey, and
A. Pertsov,
“Control of spatial orientation and lifetime of scroll rings in excitable media,”
Nature (London), 386 477
–480
(1997). https://doi.org/10.1038/386477a0 0028-0836 Google Scholar
A. Sambelashvili and
I. R. Efimov,
“Dynamics of virtual electrode-induced scroll-wave reentry in a 3D bidomain model,”
Am. J. Physiol. Heart Circ. Physiol., 287 H1570
–H1581
(2004). 0363-6135 Google Scholar
R. C. Haskell,
L. O. Svaasand,
T. T. Tsay,
T. C. Feng,
M. S. McAdams, and
B. J. Tromberg,
“Boundary conditions for the diffusion equation in radiative transfer,”
J. Opt. Soc. Am. A, 11 2727
–2741
(1994). 0740-3232 Google Scholar
R. Aronson,
“Boundary conditions for diffusion of light,”
J. Opt. Soc. Am. A, 12 2532
–2539
(1995). 0740-3232 Google Scholar
|


