|
|
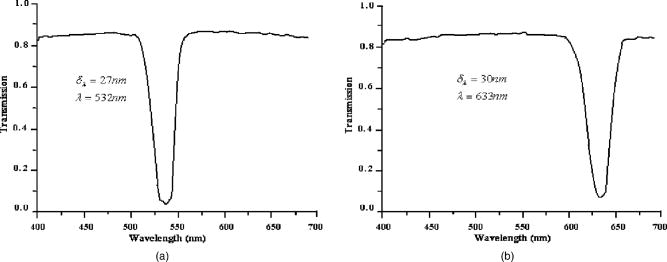
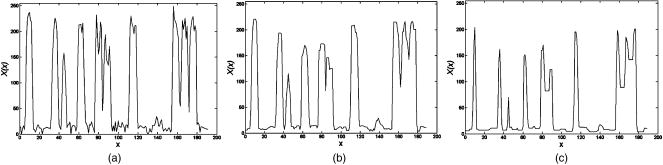
1.IntroductionIn DNA research, a microarray is a matrix of individual DNA molecules attached, in ordered sets of known sequence, to a substrate that is approximately the size of a microscope slide. A single array can contain thousands of molecules, each tagged with a specific fluorochrome. The array is then measured by a microarray scanner, where each individual site of the matrix is individually probed by a variety of laser wavelengths at, or near, the excitation band of specific protein tags. The resulting fluorescence is measured and the fluorescence, position, and sequence data are stored in a computer database for later analysis. Today’s microarray scanner uses two or more cw (continue wave) lasers, each with a different wavelength. The typical dual-wavelength system incorporates two cw lasers, two photomultiplier tubes (PMTs), and some bandpass filters. The beam from a laser is focused onto a molecule on the molecular matrix. If the appropriate fluorescent tag is present, the resulting fluorescence is measured by a detector. A filter in front of the detector separates the laser wavelength from the fluorescence signal. The laser beam is then moved to the next molecule. Microarray images can be generated using a single-color, two-color (red/green), or mutlicolor system. Spot intensities of images is a measure of expression of the corresponding gene.1 Laser confocal detection, which is currently the main method in measurement of microarray, has higher resolution and sensitivity than a CCD. In general, a DNA sample is fluor-tagged with Cy3 and Cy5 or more other fluorescent dyes, multicolor detection is necessary to more accurately analyze hybridization results. Normalization of the data could correct the variations due to scanner settings, labeling efficiencies, chemical properties of different dyes, etc. Before estimating the signal and background of each spot, it is necessary to locate the region of the spot. Thus, gridding of the fluorescent image is required. Currently, the most popularly used two-color fluorescence detecting method is dual-channel measuring, which acquires red and green fluorescence simultaneously by two PMTs. The final fluorescent image is synthesized from the two fluorescence images. The ideal scan is one in which the same amounts of red and green signal are acquired in each channel, resulting in a pixel ratio of approximately 1.0. A bias between the channels could result in variations of collection. Normalization is the procedure of minimizing the experimental bias between the channels. There are various normalization methods that correct for variation in relative signal intensities. A number of normalization techniques have been proposed. 2, 3, 4, 5, 6, 7 No one normalization method will correct the variation absolutely. In this paper, we report a laser confocal scanning system that could detect dual-wavelength Cy3 and Cy5 fluorescence. Its optical system mainly consists of two pulsed lasers, four volume holographic band-stop filters, and one PMT. Characteristics of the system are that images of spots are generated in the same optical path and two-color fluorescence is acquired by one PMT with time sharing. The procedure to minimize the bias between channels is free. Implementation of the holographic band-stop filter makes it possible for one PMT with filters that are not switched when different wavelength fluorescence is measured.8 Experiments are implemented and we acquired and imaged Cy3 and Cy5 fluorescence. A technique using a simple morphology transform, such as opening, closing, and eroding, is introduced that filters and grids the microarray images. Compared with traditional morphology,9 it operates simply and effectively. Finally, the results of experiments are presented. 2.Basis of Method and Experimental SetupFigure 1 shows a schematic diagram of the experimental arrangement. Two diode laser beams of lengths and pass through a collimating lens separately; reach the volume holographic filters (Filter1 and Filter2), which are cut off at incidences and . The laser light is diffracted and reflected by the filters and focused using a 40X objective (Objective1) to produced a spot of about diameter on the specimens. The back-scattered light, including fluorescent light which is induced by the illumination beam, is collected using the same objective and passes through filters 1, 2, and additional filters 3 and 4, successively. The incidence at which fluorescence goes through Filter3 and Filter4 is . The laser is blocked, while two-color fluorescence crosses the holographic filter due to its band-stop property. A spatial filter preceding the PMT in a confocal plane consists of a pinhole with a diameter of . Other lights from the out-of-focus plane are eliminated by the pinhole. The two lasers work in the pulse mode. A signal generator outputs a square-wave signal, whose duty ratio is 1/3, to control the laser 1 transmission. Laser 2 is controlled by the preceding square-wave signal delay. Thus, every confocal spot is illuminated twice by two different-wavelength lasers when the motorized - stage steps. Cy3 and Cy5 fluorescence are acquired by the same PMT with time sharing. This makes it obvious that data acquired by different PMTs should be normalized. In the multichannel acquisition of the same microarray, detection of different wavelengths could be variable because the gain of the PMT is set incorrectly. One of the main contributors to variability between channels is incorrect setting of PMT values, so that the signal acquired in one channel is significantly different from the signal acquired in others. In such a case, ratio values may be biased toward one channel. To minimize this form of variability, a preliminary scan must be performed to adjust two PMTs so that they are producing roughly the same response to both channels. The approach using one PMT would remove discrepancies across the channels. An additional benefit of the system is that two different fluorescences can be captured simultaneously in the same optical path when two lasers work synchronously. Thus, two different-wavelength fluorescences could be imaged in the same image. A disadvantage of acquiring data with time-sharing is low speed. The specifications of the system are listed in Table 1 . A transmission curves of the volume holographic filters are shown in Fig. 2 . The time sequence of the modulating pulses for the two laser is demonstrated in Fig. 3 , where is cycle of pulse, is width of pulse, and is the interval between pulses 1 and 2. 3.Microarray Image GriddingGridding is the segmentation of each spot with horizontal and vertical lines passing through the boundary between adjacent spots in images. In this section, we provide some definitions and properties necessary to understand the morphological approach used for spots gridding. A gray-scale image is represented by with domains and . The image function is equal to the gray level at . Let be a compact subset of that is symmetric with respect to its origin. We then define the erosion of by the structure element , positioned at as And the dilation of by the structure elements is defined asErosion and dilation can be combined to perform openings and closings , defined byAccording to the properties of a micorarray fluorescent image, opening, closing, eroding, etc. can filter and grid images. This can be interpreted by a 1-D eroded signal. For example, 1-D signal shown in Fig. 4a , where denotes position and denotes intensity. Note that is filtered by morphology operator , where is a line structure element and . The parameter is chosen based on the mean width of single valley on , . The result is shown in Fig. 4b. Local noise and peaks are removed after the operation. To identify the horizontal boundary between adjacent valleys on , erosion is done to expand valley bottoms on , where is a line structure element, and . The result is shown in Fig. 4c. The length of every local lowest points of the raw valley is expanded times. It is easy to identify the borders between two adjacent valleys on . We know that the spots in the microarray image are positioned along horizontal lines and are equidistant from each other both horizontally and vertically. Vertical grids can be located after horizontal gray profiles are filtered and eroded. In similar a manner, horizontal grids can be ascertained according to processed vertical gray profiles morphologically. The profile can be made certain according to the sum of pixel gray scale in one row or column. The largest sum of one profile could be considered first. There are two steps in gridding microarray fluorescent images supposing image rotation is not necessary. First, noise and weak signals are eliminated by morphological opening and closing in the horizontal and vertical directions. Second, gridding is done according to horizontal and vertical eroded profiles. The parameter is chosen based on , which is the radius of the spot and can be adjusted according to mean distance between adjacent spots and is approximately greater than or equal to at least. These are a priori information because we can adjust the diameter of the spot by using different scanner resolutions during digitalization. The length of in the filter should be greater than that in the eroding step. 4.Experiments and ResultsAn experiment was conducted in which the red laser is and (56-ICS-272, Melles, Griot), the green laser is and (DPGL-2050F+LDC-800, Photop Suwtech, Shanghai), the PMT is H7711-12 (Hamamatsu Photonics), and the analog-to-digital (A/D) card is PCI-6013 (NI Instruments). The experimental system scanned a protein chip supplied by United Gene Holdings Ltd. in Shanghai, which is labeled with IgG-Cy3 and IgG-Cy5 and has a mean diameter of each spot of about . The size of the chip is . The scanning step is and the frequency of the step is . It took for a full scan at . Compared with most commercially available microarray scanners, which acquire data at two wavelengths simultaneously with dual-channels and whose scan times for a full scan at to standard microscope slides ( , or ) are about 6 to . The speed of the experimental system is slow, but the backgrounds of two different fluorescent images are almost identical. The Cy3 image acquired is shown in Fig. 5a and the Cy5 image is shown in Fig. 5b. Then two-color image synthesized with the Cy3 and Cy5 images is shown in Fig. 5c. There are five spots, with arrows pointing to them in Fig. 5c, which are obviously imaging on both wavelength lasers. This means that hybridization on these spots is believable. The Cy3 and Cy5 fluorescent images have identical backgrounds because their imaging is in the same optical path and PMT. Fig. 5Fluorescent images: (a) Cy3 image, (b) Cy5 image, (c) Cy3-Cy5 image, (d) horizontal by eroded Cy3-Cy5 image, (e) vertical by eroded Cy3-Cy5 image, and (f) gridded Cy3-Cy5 image.  The Cy3-Cy5 image is filtered using morphological opening and closing. According to the preceding algorithm, the filter is divided into two steps. The first is horizontal profiles of the image operated by compound of opening and closing with structure element , which is a flat line . The second is vertical profiles of one are done by same compound operator whose is a vertical line . Noises and large lone points are eliminated. Gridding follows same the step in which eroding is done sequentially from the horizontal and vertical directions. Structure element of eroding is a line . The boundary of the spots is expanded times. Thus, it is easy to locate the grids of segmentations of the spots. The results of filter and gridding are demonstrated in Fig. 6 . A horizontal profile of the Cy3-Cy5 image, which is noisy and where several spots have low intensity, is shown in Fig. 6a. Those local peaks are eliminated after horizontal filtering. They are shown in Fig. 6b. Figure 6c shows result eroded that follows Fig. 6b. Borders between two adjacent spots on a row are distinct. Figures 6d to 6f report the results of the vertical profile and its filtered and eroded results. Thus, vertical grids can be located by eroded horizontal profiles. In the same theory, horizontal grids can be located by vertical profiles. Fig. 6Filtered and eroded profile of Cy3-Cy5 fluorescent images: (a) Cy3-Cy5 image horizontal profile, (b) filtered horizontal profile, (c) eroded horizontal profile, (d) Cy3-Cy5 image vertical profile, (e) filtered vertical profile, and (f) eroded vertical profile.  Table 1Principal parameters of the system for the experiment.
5.ConclusionThe results of this experiment show that the optical system provides a particular method to capture dual-wavelength fluorescence. Pulsed lasers are employed instead of cw lasers. Two different wavelength lights can pass through a common optical path because the volume holographic filters are cut off. The structure is different from those of most current commercial microarray scanners, in which bandpass filters are used and each kind of fluorescence is collected by one PMT corresponding to its wavelength. Here, two-color fluorescence can be collected in the same PMT. This point has a greater advantage than a multichannel system. It simplifies the system and reduces data normalization due to bias resulting from the different gains of multiple PMTs. A low scanning speed was demonstrated in the presented experiment, in which each fluorescence is collected by a single PMT with time sharing. But this is not an inherent drawback of the system; it can be improved by using faster PMTs and a higher speed step motor that drives the stage, or another scanning mode such as an oscillating mirror and an objective lens in one scanning direction. Another point is that two-color fluorescence could be acquired simultaneously by one PMT if two lasers work together with a common modulating pulse. The synthesis of a two-color fluorescence image can be realized straightforwardly in this way. It is useful to identify hybridization of spots and investigation about this is in progress. The spot gridding algorithm is fully automated and does not require any additional information about the microarray geometry. As an automatic method, it processes the microarray image with simple morphological eroding instead of the generally familiar mathematical morphology operation. The gridding is robust because these operations themselves are in essence filters. Fewer steps are required compared with other algorithms. With more hybridized spots in a microarry, more grids would be located as quickly as possible. Further work concerns the perfection of the optical system, the investigation of a scanning mode for a higher speed, and identification of foreground and background pixels in a grid. AcknowledgmentsThis work was supported by National Foundation Research Development Project of China under Grant No. 2005CB724300 and by Shanghai Education Council Foundation (05ZZ26, 05EZ46, T0501). ReferencesT. Kukar,
S. Eckenrode,
Y. Gu,
W. Lian,
M. Megginson,
J. Shi, and
D. Wu,
“Protein microarrays to detect protein-protein interactions using red and green fluorescent proteins,”
Anal. Biochem., 306
(6), 50
–54
(2002). 0003-2697 Google Scholar
L. Ramdas,
K. R. Coombes,
K. Baggerly,
L. Abruzzo,
W. E. Highsmith,
T. Krogmann,
S. R. Hamilton, and
W. Zhang,
“Sources of nonlinearity in cDNA microarray expression measurements,”
Genome Biol., 2
(11), 1
–7
(2000). Google Scholar
C. S. Brown,
P. C. Goodwin, and
P. K. Sorger,
“Image metrics in the statistical analysis of DNA microarray data,”
Proc. Natl. Acad. Sci. U.S.A., 98 8944
–8949
(2001). 0027-8424 Google Scholar
T. Kepler,
L. Crosby, and
K. T. Morgan,
“Normalization and analysis of DNA microarray data by self-consistency and local regression,”
(2000) Google Scholar
C. Kerr and
G. Churchill,
“Statistical design and analysis of gene expression microarrays,”
Genet. Res., 77 123
–128
(2001). https://doi.org/10.1017/S0016672301005055 0016-6723 Google Scholar
W. Huber,
A. Heydebreck,
H. Sültmann,
A. Poustka, and
M. Vingron,
“Variance stabilization applied to microarray data calibration and to the quantification of differential expression,”
Bioinformatics, 18 S96
–S104
(2002). 1367-4803 Google Scholar
R. Nagarajan and
C. A. Peterson,
“Identifying spots in microarray images,”
IEEE Trans. Nanobiosci., 1
(2), 78
–84
(2002). 1536-1241 Google Scholar
G. A. Rakuljic and
V. Leyva,
“Volume holographic narrow-band optical filter,”
Opt. Lett., 18
(5), 459
–461
(1993). 0146-9592 Google Scholar
R. Hirata Jr., J. Barrera,
R. F. Hashimoto,
D. O. Dantas, and
G. H. Esteves,
“Segmentation of microarray images by mathematical morphology,”
Real-Time Imag., 8
(6), 491
–505
(2002). 1077-2014 Google Scholar
|