1.IntroductionThe transport of calcium ions through the voltage gated channels, inducing release of calcium stores from the sarcoplasmic reticulum, and subsequent binding to troponin C are the essential steps for force generation in the myocyte. Recently, there have been several studies utilizing transgenic technology, which have elucidated important mechanisms concerning control of contractile function. For instance, in a phospholamban knockout model, enhanced inotropy is noted at the base line, though there is an attenuated response to β-adrenergic agonists. 1 Other studies have looked at processes which can produce contractile dysfunction, such as overexpression of tumor necrosis factor-α. 2 Essential to the understanding of these models would be an assessment of the role of intracellular calcium handling. Furthermore, the measurement of intracellular calcium in a whole heart model may be more physiological than isolated myocyte studies. The measurement of calcium transients in the whole heart can be limited by the poor tissue penetrance of fluorescence dyes. Brandes et al.; 3 4 have validated the use of indo-1 to quantify cytosolic calcium in the perfused rat heart. Other investigators have successfully used microinjection techniques of both aequorin, 5 and fura red 6 which avoids the problem of endothelial cell loading, which may account for a significant portion of total fluorescence. Recently, del Nido et al.; 7 used the fluorescent dye rhod-2 in the perfused rabbit heart. This has several advantages, including long excitation and emission wavelengths which allows for greater tissue penetration, and reduced interference from naturally occurring fluorescent compounds such as NAD(P)H. The changes in fluorescence upon calcium binding are high, with a 100-fold increase in fluorescence when rhod-2 binds calcium. The disadvantage of rhod-2 is that there is no shift of either excitation or fluorescence spectra on binding calcium, so that the commonly used ratio techniques to quantify fluorescence cannot be used. We have shown that fluorescence measurements (calcium sensitive) combined with absorbance measurements (insensitive to calcium, though they reflect rhod-2 concentration) is a way to ratio rhod-2. 7 8 The purpose of the present study was to validate the use of rhod-2 to measure intracellular calcium in the isolated perfused mouse heart, to determine the extent of endothelial cell contribution to fluorescence, the distribution of rhod-2 within subcellular organelles, and the response of rhod-2 measured intracellular calcium to positive inotropy. In particular, we wished to perform localization studies in conditions that mimic the normal experimental environment as closely as possible, as previous studies had studied localization in isolated myocytes, though the measured fluorescence was in perfused hearts. 7 We postulated that rhod-2 was predominantly cytosolic and these measurements were sensitive to inotropic interventions. 2..Materials and Methods2.1.The Isolated Perfused Mouse HeartMale mice (129/SV ter strain, mean weight 26.9±2.6 g) were used. Anesthesia was induced with 1.5–3.0 mg of intraperitoneal pentobarbital sodium, and the animal was anticoagulated with 100 units of heparin. The heart was removed from the chest and immersed in an oxygenated dish containing modified Krebs solution. The aorta was cannulated with a 23 gauge needle and sutured in place with 4-O suture. It was then transferred to the perfusion apparatus, and retrograde coronary perfusion with oxygenated perfusate begun. The modified Krebs solution consists of (mM): NaCl 112, KCl 4.7, Mg SO 4 1.2, Na-EDTA 0.5, NaHCO 3 28.0, glucose 5.5, pyruvate 5.0, CaCl 2 2.5, 50 μM octanoate and was oxygenated with 95 O 2 and 5 CO 2, and pH adjusted to 7.4. It was found that the addition of 50 μM octanoate led to more stable diastolic pressures for a significantly longer time (data not shown). Perfusate osmolarity was determined to be between 285 and 295 mosM (Wescor vapor pressure osmometer). To eliminate the effects of cathecholamine release by pacing esmolol (0.1 μM) (Du Pont, Wilmington, DE) was added to the perfusate. The height of the perfusion buffer was set so that the perfusion pressure was 55 mm Hg, and the temperature of the perfusate entering the heart was carefully set at 37°C. Perfusate flow was monitored with a glass flow meter which can detect flow rates of 0–4 mL/min. The heart was bathed in its own coronary effluent, which was also heated to 37°C. A rubber latex balloon on the end of a plastic cannula was inserted into the left ventricle through an incision in the left atrium. This was then connected to a Gould pressure recorder (Gould, Cleveland, Ohio) for measurement of left ventricular pressure. The left ventricular diastolic pressure was set at 0–5 mm Hg using a microsyringe. To ensure uniform physiological heart rate, all hearts were paced at 8 Hz using a stimulator with one lead inserted into the right ventricle and the other adjacent to the epicardium. 2.2.Measurement of Intracellular Calcium2.2.1.The FluorimeterThe left ventricular free wall of the heart, suspended in the water bath, was gently placed against a window through which spectroscopic measurements were obtained (Figure 1). To keep the heart in place the perfusion cannula above the heart was fixed, but no additional pressure was placed on the heart itself. During this maneuver, developed pressure, and coronary flow were monitored. Absorbance measurements for deoxymyoglobin were made to ensure the heart was not made ischemic. Figure 1System used to stabilize the heart in the water bath within the fluorimeter. The heart was immobilized by fixing the aortic perfusion line, though no additional pressure is put on the heart itself. (A) Represents a lateral perspective of the heart chamber, and (B) is the heart chamber viewed from above.  The excitation light beam was focused on the heart by a biconvex lens to provide a 2 mm excitation spot. Emission fluorescent light was collected with a biconvex lens positioned at 90° to the incident excitation light beam. The emission wavelength was selected by a motorized monochromator and detected by a cooled photomultiplier tube (Aminco SLM 8000, SLM Co., Springfield, IL). The incident beam was focused on the heart at an incident angle of 30°, and the emission light collected at 60° from the optical window surface, to minimize the reflected light from the air-window and window-tissue interfaces. For absorbance measurements which were used to quantify the extent of rhod-2 in the heart and to correct for motion, reflected excitation light was collected onto a flexible liquid light guide coupled to another photomultiplier tube. The light guide and focusing lens were positioned at 45° on a vertical plane. This plane was also selected to minimize the signal from light reflected from both the air-optical surface and also the window-tissue interface, and thus maximize the signal from the light backscattered from the heart itself. 2.2.2.Dye Loading and WashoutPrior to loading with rhod-2, base line fluorescence and absorbance measurements were taken. Excitation at 524 nm and emission at 589 nm were used for fluorescence measurements, and reflected absorbance was obtained with a spectrum of light from 500 to 600 nm. Analog pressure signals from the Gould monitor were digitized and stored simultaneously with fluorescence measurements. Rhod-2 (Molecular Probes, OR, 100 μg) was dissolved with dimethylsulfoxide (DMSO, 4 μL) and dH 2 O (200 μL), and prior to loading was mixed with 9 mL oxygenated Krebs solution. We have found that the rhod-2 had minimal effects on coronary flow and pressures when the quantity of DMSO was minimized. The rhod-2 was mixed in oxygenated Krebs, and loading was done through a parallel perfusion line, which was connected to the same reservoir so that the important perfusion pressure was not disrupted. It typically took about 5 min to reach peak fluorescence from the base line, the precise time being dependent on the coronary flow in each heart. Following loading, fluorescence (589 nm) was monitored continuously for a further 15–20 min [Figure 2(A)]. Fluorescence characteristically peaked early, and then declined, reaching a steady state with minimal washout at 15–20 min after loading. Towards the end of this period, to reduce the contribution of rhod-2 which has collected in the heart bath to total fluorescence, the bath was emptied, and filled with warmed Krebs solution which contained no rhod-2. Figure 2(A) Measurement of developed pressure and fluorescence during loading of rhod-2 and subsequent washout period. At the arrow, the water bath is washed out to remove any rhod-2 which has entered the heart bath through the coronary circulation during loading. Fluorescence measurements are begun after the washout period. (B) Example of calcium transients (solid line) and simultaneous pressure recordings (dashed line). (C) Example of calibration procedure of fluorescence signal. Maximal fluorescence (F max ), corrected for light scattering changes, is determined by tetanizing the heart with cyclopiazonic acid (10 μM) and calcium chloride (20 mM). The arrows indicate the point of F max . F max was corrected by multiplying the ratio of R524 pre-tetanization to R524 during tetanization.  2.2.3.Fluorescence and Absorbance MeasurementsAfter the washout period serial measurements of fluorescence alternating with absorbance were taken. 8 Fluorescence scans were taken at high time resolution to allow quantification of changes in fluorescence during the cardiac cycle [Figure 2(B)]. Quantification of the relative amount of rhod-2 in the heart using absorbance measurements was done by taking the ratio of absorbance at 524 nm (rhod-2 sensitive) to 589 nm (rhod-2 insensitive) which eliminated the effect of motion as both wavelengths would be equally affected by motion, though only 524 reflected the concentration of rhod-2. 7 8 These wavelengths (524, 589 nm) were chosen as these were isosbestic points not affected by changes in absorbance of myoglobin induced by oxygen desaturation. 8 In solution maximal rhod-2 absorbance is at 554 nm. However, this wavelength is affected by changes in oxygen saturation, the relative absorbance compared to 524 nm is decreased due to inner filter effects and it does not adequately correct for changes in scattering. 8 Dye absorbance (A rhod2 ) was calculated according to the formula where R524 is the reflectance intensity at the rhod-2 sensitive point of 524 nm, and R589 is the rhod-2 insensitive point, before ()0 and after () rhod2 loading.2.2.4.Calculation of [Ca 2+]iAt the end of the perfusion protocol, maximal fluorescence, used in the calculation of [Ca 2+]i was determined by tetanizing the heart with a bolus of calcium chloride (20 mM) without any energy substrate, and with cyclopiazonic acid (Sigma Chemical Co., 10 μM), which is a potent inhibitor of Ca 2+ -ATPase and thus blocks calcium uptake by the sarcoplasmic reticulum. 9 Fluorescence and pressure were monitored continuously, and the point of maximal fluorescence was taken as the point where pressure stabilized at a steady state [Figure 2(C)]. To account for changes in light scattering properties from the heart during tetanization, the maximal fluorescence was corrected by multiplying by the ratio of R524 pre-tetanization to R524 during tetanization. 8 Intracellular calcium was calculated using the formula where Kd is the dissociation constant for rhod-2 and calcium (determined by in vitro calibration with rhod-2 and myoglobin by del Nido et al.; Ref. 7, and confirmed by in vivo manganese quenching, Ref. 10) and is 710 nM, Ft= fluorescence at time t, F max = maximal fluorescence from tetanized heart, and the fluorescence from the heart assuming rhod-2 had no calcium bound is given by F0=Fb+a(F max −Fb), where Fb is the background counts from the heart prior to dye loading, and a=rhod-2 fluorescence in the absence of clacium/rhod-2 fluorescence in the presence of saturating calcium. For rhod-2 the value of a is approximately 0, thus for rhod-2, F0 was assumed to be equal to Fb.To account for changes in dye concentration, formula (2) needs to be modified to account for changes in absorbance [A rhod-2 , formula (1)] due to dye leakage. where At= dye absorbance at time t, A max is dye absorbance just prior to tetanizing the heart. A max is not determined when the heart has tetanized because of the marked influence of the shape change and desaturation of myoglobin on the reflectance spectrum.2.2.5.Fluorescence Microscopy and Confocal Fluorescence Microscopy of Rhod-2Hearts were isolated and perfused as described above, loaded with rhod-2, and then a carbodiimide compound (1-ethyl-3-(3-dimethylaminoproply)carbodiimide hydrochloride, EDC, 0.21 mM, Sigma Chemical Co.) was bolused through the aortic perfusion line to fix rhod-2. 11 Hearts were embedded and sectioned (4 μM). Fluorescence microscopy was performed with a Nikon Eclipse E800 with arc xenon lamp and filter sets Nikon G2A EX 510-560, DM 575, and BA 590. Confocal fluorescence microscopy was performed using a Nikon PCM200 and Ar–Kr Coherent Innova 70C laser with excitation at 488 nM and detection in two channels, one with no filter (green) and one filtered at 600 nM. Images were digitized (Matrox Meteor II) and viewed using software Simple PCI (Compix). Additional experiments were performed to determine if any mitrochondrial loading of rhod-2 could be visualized. In one experiment a heart was perfused for a prolonged washout period of 80 min. Normal experiments run for about 40 min. We postulated that prolonged washout of cytosolic rhod-2 may make mitochondrial deposition more evident. In another experiment a heart was perfused with digitonin which lyses cell membranes causing leakage of cytoplasmic contents. 8 We postulated that leakage of cytosolic rhod-2 would make any mitochondrial rhod-2 more evident. 2.2.6.Electron Microscope Localization of Rhod-2FluorescenceHearts were fixed using the same carbodiimide compound as described above. In a separate control experiment, the same fixing procedure was used, without prior loading of the heart with rhod-2. Subsequently the heart was fixed with 4 paraformaldehyde for 1 h and 30 min. The tissue was washed in three changes of phosphate buffered saline (PBS), and infiltrated with 2.3 M sucrose/PBS overnight at 4°C. Cryosections (approximately 30 μm thick) of the left ventricle of both samples were cut on a cryostat, and washed in three changes of PBS. Experimental and control tissue was incubated in a 1:100 dilution of primary antibody (1 mg/ml anti-tetramethylrhodamine rabbit IgG, Molecular Probes Inc. Eugene, OR) for 6 h at 4°C. In addition, both control and experimental tissue was incubated in PBS without primary antibody for 6 h at 4°C. The tissue was washed in three changes of PBS (5 min each change), and incubated overnight in PBS at 4°C. Both the control and experimental tissue, with and without exposure to primary antibody, was then incubated in a 1:100 dilution of 1 mg/ml goat anti-rabbit peroxidase conjugated antibody (Vector Laboratories Inc., Burlingame, CA) for 3 h at room temperature, followed by four 30 min washes in PBS. The samples were fixed with 2 glutaraldehyde/PBS for 5 min at room temperature, washed in three changes of PBS, and three changes of 100 mM Tris-HCl buffer pH 7.6. The tissue was incubated in 1 mg/ml diaminobenzidine (Sigma Chemical Co.), and 0.015 H 2 O 2 in 50 mM Tris-HCl buffer at pH 7.6 in the dark for 20 min at room temperature. The tissue was washed in three changes of 100 mM Tris-HCL buffer pH 7.6, fixed in a solution of 1 Os O 4 /PBS for 15 min at room temperature, washed in three changes of dH 2 O, dehydrated in a series of ethanol (50, 70, 80, 90, 100), and washed in two changes of 100 propylene oxide (PO). The tissue was infiltrated overnight in a 1:1 mixture of 100 PO and epon-araldite (EA). The infiltration continued the next day for 8 h in 100 EA. The EA resin was polymerized for 48 h at 60°C. Approximately 100 nm sections were cut on a Reichert-Jung Ultracut E ultramicrotome. The sections were picked up on 200 mesh Cu grids and not stained with heavy metals. The sections were viewed and photographed on a Hitachi 7100 at 50 keV. 2.2.7.Endothelial Cell Loading
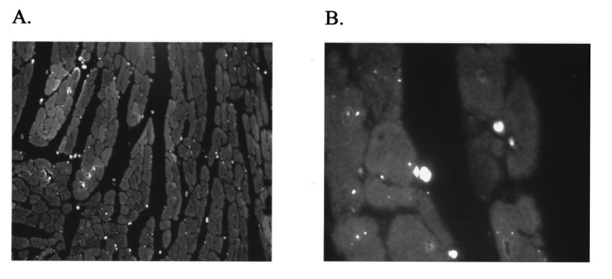
It has been suggested that a potential disadvantage with coronary perfused dye loading techniques is that endothelial cell loading is substantial, and would thus invalidate the calculation of myocyte calcium levels. 12 Bradykinin increases endothelial cell uptake of calcium, though it has no effect of myocyte uptake of calcium, so it can be used to determine if there is significant endothelial uptake of a fluorescent dye. During four experiments, after dye loading and washout, and after baseline measurements, fluorescence and pressure were continuously monitored during perfusion with bradykinin (Sigma Chemical Co., 3.0 μM) added to the perfusate for 5 min. In addition, fluorescent micrographs (as described above) were inspected for endothelial uptake. 3..Results3.1.Loading and Calcium TransientsAt a perfusate calcium of 2.5 mM, loading of rhod-2 resulted in a 6.2±1.9-fold increase in fluorescence over background fluorescence at the end of the 20–25 min washout period [Figure 2(A)]. Subsequently the washout rate over the next 40 min was 1.1±0.22/min. Before loading coronary flow was 1.7±0.1 mL, and after loading was 1.6±0.1 mL (p<0.005, N=19). Likewise, developed pressure was 52±5 mm Hg before loading, and after loading was 51±5 mm Hg (p<0.05). The mean ratio of the fluorescence transient amplitude to diastolic fluorescence values was 33±9 [Figure 2(B)]. 3.2.Fluorescence, Absorbance, CalibrationTo determine that the ratio of fluorescence over absorbance was a valid measure of fluorescence normalized for dye washout, hearts were perfused under constant conditions for up to 30 min (N=4), and repeated measurements of fluorescence alternating with absorbance were taken. These results indicated that values of fluorescence/absorbance were constant (p=NS, repeated measures ANOVA, with maximum variation 5±3) over this time. 8 At the end of the experiments a bolus of calcium chloride (20 mM) and cyclopiazonic acid (10 μM) was effect at tetanizing the heart (mean tetanized pressure 57±9 mm Hg), and resulted in an increase in the ratio of fluorescence to absorbance of 318±77 over the pre-tetanization measurements [Figure 2(C)]. 3.3.Fluorescent Micrographs and Fluorescent Confocal Micrographs of Rhod-2 LocalizationFigure 3 demonstrates a fluorescent micrograph and confocal fluorescent micrograph of rhod-2 fixed in mouse heart tissue. There is clearly homogeneous deposition of rhod-2. There is no evidence of selective mitochondrial uptake, which has a characteristic “punctate” pattern. 7 In Figure 4, after prolonged washout confocal images look similar to Figure 3, though the homogeneous fluorescence pattern is less obvious. There are multiple small areas without red fluorescence (appearing black) which may represent regions not containing rhod-2 such as mitrochondria. In Figure 5 after perfusion with digitonin there is a marked reduction in fluorescence intensity without evidence of selective rhod-2 uptake. There are areas of intense rhod-2 fluorescence, though these are clearly extracellular. Figure 3(A) Fluorescence micrograph (×100) and (B) fluorescent confocal image (×100) of rhod-2 fixed in the mouse heart, showing diffuse homogenous fluorescence. Both images are from the same field.  Figure 4Fluorescent confocal image (×100) of rhod-2 fixed in the mouse heart after 80 min washout. The homogeneous fluorescence as in Figure 3 is less obvious, and there are multiple small areas appearing black were fluorescence is absent. This may represent regions where rhod-2 is not present, such as mitochondria.  3.4.Electron Microscope Images of Rhod-2Electron microscope images of rhod-2 (Figure 6) were obtained in hearts perfused with rhod-2 and in controls without rhod-2. Rhod-2 perfused hearts, though not controls, demonstrated a dark speckled pattern predominantly in the cytosol. In Figure 6(C), a mitochondrion which has been opened up by the cryosectioning shows no evidence of rhod-2 deposition, though in the adjacent cytosol there is heavy rhod-2 staining. Also, in additional control experiments, rhod-2 perfused hearts were exposed to the same fixing protocol as described above, though the primary antibody step was omitted, and no cytosolic deposition was evident (data not shown). Figure 6Electorn microscopy of rhod-2 subcellular localization (approx. 40 K×). (A) Controls heart without rhod-2 (myo: myofibril, mito: mitochondrion). (B) Heart perfused with rhod-2. Arrow indicates dark speckled areas of rhod-2 staining. (C) Illustrates mitochondrion which has been opened up by cryosectioning. No rhod-2 staining is seen within this mitochondrion, though in the adjacent cytosol heavy rhod-2 staining is evident.  3.5.Endothelial Cell LoadingFluorescent micrographs demonstrated rhod-2 uptake in the inner aspect of blood vessel wall [Figures 7(A) and 7(B)]. However, fluorescence was not effected by bradykinin (mean fluorescence pre-bradykinin: 0.48±0.21 versus during bradykinin 0.47±0.22, p=NS ) indicating that the contribution of endothelial cell loading of rhod-2 to the total fluorescence signal was small and did not significantly affect calculations of intracellular calcium [Figure 7(C)]. Figure 7(A) and (B) Fluorescence micrographs of blood vessel walls demonstrating fluorescence from the inner aspect of the vessel wall [(A) ×20 and (B) ×100]. (C) Demonstrates the absence of any effect of bradykinin on fluorescence, indicating that endothelial uptake of rhod-2 is relatively small compared to total fluorescence. Arrows indicate beginning and end of bradykinin infusion. 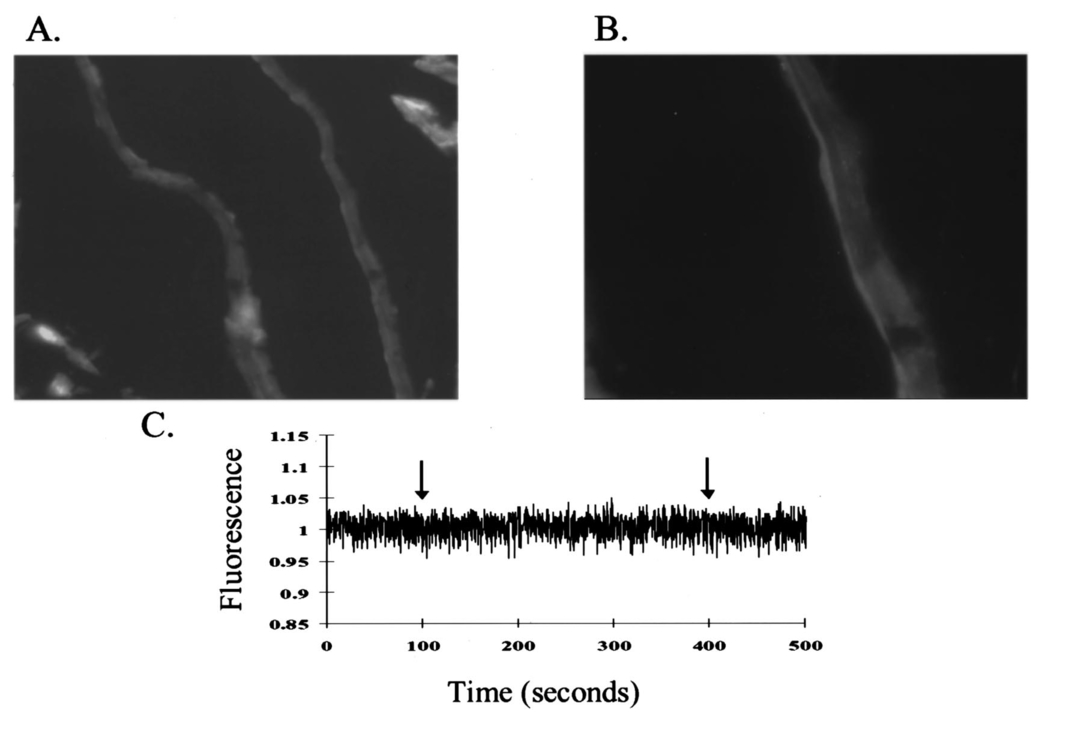 3.6.Calculated Values of Intracellular and Effects of High Perfusate CalciumHigh perfusate calcium significantly increased developed pressure and systolic and diastolic intracellular calcium (Table 1). Examples of pressure tracings, averaged calcium transients, and the pressure-calcium relationship before and with high perfusate calcium are presented in Figure 8. Figure 8(A) Examples of pressure tracings. (B) Averaged calcium transients over 8–10 cycles, and (C) the pressure-calcium relationship at perfusate calcium of 2.5 and 3.5 mM.  Table 1
4.DiscussionThis study demonstrates the measurement in the perfused mouse heart of intracellular calcium with rhod-2, using the combination of fluorescence and absorbance measurements. We demonstrate in the perfused mouse heart that rhod-2 can be loaded with minimal effects on contractile parameters, with excellent signal to noise characteristics, and that intracellular calcium levels can be quantified using ratios of fluorescence to absorption and a tetanizing procedure for determination of maximal fluorescence. To measure maximal fluorescence for rhod-2 saturated with calcium we have used cyclopiazonic acid, which is a potent inhibitor of Ca 2+ ATPase blocking calcium uptake by the sarcoplasmic reticulum, 9 with a concentrated bolus of calcium chloride which reproducibly tetanizes the perfused mouse heart. Previously digitonin was used to measure maximal fluorescence, however digitonin may cause rhod-2 and cytosolic proteins, such as myoglobin, to leak out of the cell affecting values of maximal fluorescence. 8 In this perfused mouse heart model, while endothelial uptake is demonstrated it appears small relative to total fluorescence. The fluorescence microscopy, confocal fluorescence microscopy, and electron microscopy data all support prominent cytosolic localization. These localization studies have been performed in an environment that closely mimics the normal experimental conditions. Furthermore, with high perfusate calcium there is a marked increase in intracellular calcium as measured with rhod-2. Subcellular localization of rhod-2 is an important issue. Rhod-2 has been used to monitor mitrochondrial calcium transients in isolated rabbit myocytes. 13 In contrast, del Nido et al.; 7 showed that rhod-2 was located in the cytosol of isolated myocytes using laser scan confocal microscopy. In the present study we extend these previous observations in isolated myocytes to the whole perfused mouse heart. Using a novel technique with a carbodiimide compound (EDC) to fix rhod-2 in the perfused mouse heart, we provide evidence supporting prominent cytosolic rhod-2 localization in this perfused heart preparation. Tymianski et al.; 11 have shown that this carbodiimide agent fixes calcium buffering BAPTA derivatives, while preserving cell morphology and antigenicity to immunocytochemical markers. Also, this carbodiimide compound only fixes de-esterified rhod-2, and not rhod-2 AM which is the acetyl methoxy ester form used for loading. In this study, after fixation with EDC, we used a double antibody technique to localize rhod-2 on electron microscope images, or directly visualized fluorescence with fluorescence microscopy or confocal microscopy. These results clearly demonstrate diffuse cytosolic deposition, and are not consistent with selective mitochondrial uptake. Nevertheless, we cannot exclude that a proportion of total fluorescence arises from within mitochondria. The localization of rhod-2 noted in prior studies in myocytes may be the result of different methodologies. The rhod-2 AM used for loading is cleaved by esterases to yield rhod-2 once it is within the cell. Studies which have shown that rhod-2 is located in the mitochondria have loaded myocytes at 4°C with longer incubation times. 13 At this low temperature, cytosolic esterase activity may be low, and rhod-2 with its positive charge can accumulate in mitochondria. These studies then warm incubate for several hours to allow washout of any cytosolic rhod-2, the result of which is predominant mitochondrial localization. However, in the present study we have loaded rhod-2 at 37°C for a short time of approximately 5 min, at which temperature cytosolic esterases may be active. Furthermore, fluorescence was recorded after a relatively short time interval (15–20 min). Consequently, the fluorescence and electron microscopy data support prominent cytosolic localization of rhod-2. This novel method of fixing a fluorescent dye with the carbodiimide compound should also be applicable to other calcium sensitive fluorescent dyes, and may help determine fluorescent dye localization under different experimental conditions. Other issues that relate to whole heart measurements of calcium transients include the contribution of motion to the measured fluorescence. Du et al.; 8 have recently shown that in this perfused mouse heart model, that the contribution of motion is 6 of the signal arising from NADH autofluorescence. The values of calculated intracellular calcium at a perfusate calcium of 2.5 mM are consistent with those previously obtained in the perfused mouse heart with aequorin. 14 Peak systolic intracellular calcium values of 770 nM, and diastolic values of 330 nM at the same perfusate calcium concentration used in the present study, are reported. However, the change in intracellular calcium values from diastole to peak systole at a perfusate calcium of 2.5 mM in the perfused mouse heart is lower than those previously obtained in the perfused rabbit heart with rhod-2 (systole 930±130 nM, and diastole 229±90 nM). 7 As both these studies used rhod-2, it appears that this difference may relate to the unique excitation contraction coupling characteristics of murine myocardium, which is relatively resistant to extracellular calcium, 15 and its high heart rate (approximately 8 Hz in vivo). The resistance to extracellular calcium is illustrated by the need to use a perfusate calcium of 2.5 mM by most investigators, 14 16 17 though even this high perfusate calcium generally produces developed pressures which are lower than would be expected with perfused hearts from larger mammals. 4.1.Potential LimitationsWhile we do not demonstrate mitochondrial deposition of rhod-2, we cannot exclude this. Limited penetration by the antibodies with the electron microscopy studies could result in failure to detect mitochondrial deposition. Nevertheless, none of our experiments demonstrate patterns consistent with selective mitochondrial uptake. The advantage of the localization techniques we have described herein is that the microscopy data are from hearts loaded with rhod-2 in the same manner as during normal experiments. During perfusion with high perfusate calcium there is a significant increase in calculated diastolic values. The explanation for this is unclear, though may relate to the need to perfuse with a relatively high perfusate calcium at the base line. Alternatively, this may be due to a fraction of fluorescence arising from within the mitochondria. In conclusion, rhod-2 can be used in the perfused mouse heart to measure cytosolic intracellular calcium during changes in inotropy. In this case the ratio of fluorescence to absorbance was made in keeping with the Chance notion of using dual wavelengths for quantitating optical data from biological media. 18 Rhod-2 measurement of calcium should be useful in analyzing the phenotype of mice in which contractility has been altered by genetic engineering. AcknowledgmentsThis research was supported by National Institutes of Health Grant Nos. HL-40354 and HL-03826 (G. A. MacG) HL-02847 (A. P. K.) and RR-03631 (Pittsburgh NMR Center for Biomedical Research), American Heart Association Grant in Aid Beginning No. B98452P (G. A. MacG), and National Science Foundation Grant No. MCB 8920118 to the Center for Light Microscope Imaging and Biotechnology. REFERENCES
W. Luo
,
I. L. Grupp
,
J. Harrer
,
S. Ponniah
,
G. Grupp
,
J. J. Duffy
,
T. Doetschman
, and
E. G. Kranias
,
“Targeted ablation of the phospholamban gene is associated with markedly enhanced myocardial contractility and loss of beta-agonist stimulation,”
Circ. Res. , 75 401
–409
(1994). Google Scholar
T. Kubota
,
C. F. McTiernan
,
C. S. Frye
,
S. E. Slawson
,
B. H. Lemster
,
A. P. Koretsky
,
A. J. Demetris
, and
A. M. Feldman
,
“Dialted cardiomyopathy in transgenic mice with cardiac-specific overexpression of tumor necrosis factor-α,”
Circ. Res. , 81 627
–635
(1997). Google Scholar
R. Brandes
,
V. M. Figuerdo
,
S. A. Camacho
,
A. J. Baker
, and
M. W. Weiner
,
“I. Quantization of cytosolic
[Ca
2+i]
in whole perfused rat hearts using Indo-1 fluorimetry,”
Biophys. J. , 65 1973
–1982
(1993). Google Scholar
R. Brandes
,
V. M. Figuerdo
,
S. A. Camacho
,
A. J. Baker
, and
M. W. Weiner
,
“II. Investigation of factors affecting fluorometric quantification of cytosolic
[Ca
2+]
in perfused hearts,”
Biophys. J. , 65 1983
–1993
(1993). Google Scholar
Y. Kihara
,
W. Grossman
, and
J. P. Morgan
,
“Direct measurement of changes in intracellular calcium transient during hypoxia, ischemia, and reperfusion of the intact mammalian heart,”
Circ. Res. , 65
(4), 1029
–1044
(1989). Google Scholar
Y. Wu
and
W. T. Clusin
,
“Calcium transient alternans in blood-perfused ischemic hearts: Observations with fluorescent indicator fura red,”
Am. J. Physiol. , 273 H2161
–H2169
(1997). Google Scholar
P. J. del Nido
,
P. Glynn
,
P. Buenaventura
, and
A. P. Koretsky
,
“Fluorescence measurement of calcium transients in perfused rabbit heart using Rhod-2,”
Am. J. Physiol. , 274 H728
–H741
(1998). Google Scholar
P. H. Backx
,
W. D. Gao
,
M. Azan-Backx
, and
E. Marban
,
“The relationship between contractile force and intracellular
[Ca
2+]
In intact rat cardiac trabeculae,”
J. Gen. Physiol. , 105 1
–19
(1995). Google Scholar
M. Tymianski
,
G. M. Bernstein
,
K. M. Abdel-Hamed
,
R. Sattler
,
A. Velumian
,
P. L. Carlen
,
H. Razavi
, and
O. T. Jones
,
“A novel use for a carbodiimide compound for the fixation of fluorescent and non-fluorescent calcium indicators in situ following physiological experiments,”
Cell Calcium , 21 175
–183
(1997). Google Scholar
B. H. Lorell
,
C. S. Apstein
,
M. J. Cunningham
,
F. J. Schoen
,
E. O. Weinberg
,
G. A. Peeters
, and
W. H. Barry
,
“Contribution of endothelial cells to calcium-dependent fluorescence transients in rabbit hearts loaded with indo 1,”
Circ. Res. , 67 415
–425
(1990). Google Scholar
D. R. Trollinger
,
W. E. Cascio
, and
J. J. Lemasters
,
“Selective loading of rhod-2 into mitochondria shows
Ca
2+
transients during the contractile cycle in adult rabbit cardiac myocytes,”
Biochem. Biophys. Res. Commun. , 236 738
–742
(1997). Google Scholar
T. G. Hampton
,
I. Amende
,
K. E. Travers
, and
J. P. Morgan
,
“Intracellular calcium dynamics in mouse model of myocardial stunning,”
Am. J. Physiol. , 274 H1821
–H1827
(1998). Google Scholar
W. D. Gao
,
N. G. Perez
, and
E. Marban
,
“Calcium cycling and contractile activation in intact mouse cardiac muscle,”
J. Physiol. (London) , 507.1 175
–184
(1998). Google Scholar
I. L. Grupp
,
A. Subramaniam
,
T. E. Hewett
,
J. Robbins
, and
G. Grupp
,
“Comparison of normal, hyopdynamic, and hyperdynamic mouse hearts using isolated work-performing heart preparations,”
Am. J. Physiol. , 265 H1401
–H1410
(1993). Google Scholar
T. Kameyama
,
Z. Chen
,
S. P. Bell
,
J. Fabian
, and
M. M. LeWinter
,
“Mechanoenergetic studies in isolated mouse hearts,”
Am. J. Physiol. , 274 H366
–H374
(1998). Google Scholar
B. Chance
,
“Rapid and sensitive spectrophotometry. III: A double beam apparatus,”
Rev. Sci. Instrum. , 22 634
–638
(1951). Google Scholar
|
||||||||||||||||||||||||


CITATIONS
Cited by 33 scholarly publications.
Calcium
Luminescence
Heart
Absorbance
Confocal microscopy
Microscopy
Tissues


