1.IntroductionMedical diagnostic and therapeutic techniques using light require knowledge of optical properties of tissue. In the past decade, significant research effort has gone into developing noninvasive measurement of blood glucose using near-infrared light.1 While it is fairly straightforward to build calibrations for estimating glucose in simple systems like glucose–water, serum, etc., calibrations for noninvasive glucose estimation pose considerable challenges.2 3 4 5 The difficulties arise due to the light being multiply scattered, the extent of which is dictated by the nature of the skin which varies dynamically due to changes in hydration and long term changes in thickness of the different layers of skin. To overcome the difficulties, an understanding of the interaction of light with skin is essential. In order to determine how light interacts with skin, the optical transport properties of absorption and scatter need to be determined. These properties aid in the design of a skin–instrument interface to optimally sample the tissue so as to maximize the glucose signal. In addition, they will help define the critical parameters used in constructing a reasonable skin tissue phantom (for example, made from a solution of Intralipid and water), which can serve as a model system for studying the problem of glucose estimation and other similar problems. Thus, the aim of this study was to obtain the optical properties of skin over the wavelength range of 1000–2200 nm. By measuring different individuals and different sites, an estimate of the mean optical properties and the extent of variation about this mean over the wavelength range of interest can be obtained. Skin is a heterogeneous medium made up of several distinct layers with spatially varying optical properties. Ideally, one would measure the optical properties of each layer. This task, however, is extremely complex since it would require separating and measuring layers of microscopic thickness. The measurements presented here represent lumped parameters for the absorption coefficient μa and the isotropic scattering coefficient μs ′ for the stratum corneum, the epidermis, and the dermis. Tissue optical property measurements in the near-infrared wavelengths are encumbered with difficulties owing to the necessity of extracting the tissues. It is important to keep in mind issues of sample freshness, blood drainage, and tissue hydration. Maintaining tissue viability under measurement conditions is also a major concern. The major assumption in this work is that in vitro skin samples are a reasonable representation of the in vivo situation. In this paper, we present in vitro values for the absorption coefficient μa and the isotropic scattering coefficient μs ′ for 22 skin samples collected from 14 subjects. The optical parameters measured in this study show how much μa and μs ′ vary within a small population. In addition, Intralipid solutions of different concentrations were investigated to find the concentration that will best approximate the optical characteristics of skin in the wavelength region of 1000–2200 nm. 2.Double Integrating Sphere Measurements of Tissue Optical PropertiesA double integrating sphere system is a convenient tool to measure the optical properties of skin or any material of interest, since it measures the diffuse reflectance Rd and the diffuse transmittance Td simultaneously. Figure 1 illustrates the double integrating sphere apparatus used to measure these parameters for the determination of the sample’s optical properties ( μa and μs ′ ). It is not within the scope of this paper to go into detail about integrating sphere technology, and the reader is referred elsewhere.6 7 The tissue sample is placed between two 15.2 cm diameter integrating spheres (IS-060-IG, Labsphere, North Sutton, NH) which are coated with a diffusely reflective material suitable for this wavelength region. The entrance and exit ports on the spheres are 3.81 cm in diameter. Internal baffles are located between the tissue sample and the detectors to prevent measurement of directly reflected or transmitted light. Figure 1Schematic of the double integrating sphere apparatus. The 1.9 μm InGaAs detectors collect data from 1000 to 1660 nm, and the 2.6 μm InGaAs detectors collect data from 1660 to 2200 nm.  Sample illumination between 1000 and 2200 nm is achieved using a 100 W tungsten halogen light source (OSRAM Co., Winchester, KY) coupled to a monochromator (slit width=2 mm, numerical aperture=0.128, Instruments S.A., Inc. Edison, NJ). The bandwidth of the monochromator was 20 nm with an average power of approximately 1 mW. Two mirrors ( ϕ=4 in., f=406 mm, Oriel Instruments, Stratford, CT) are used to reimage the exit slit from the monochromator onto the sample in order to achieve a reasonable spot size (nominal spot size was 2×5.6 mm ). The first mirror collimates the light leaving the monochromator exit slit and the second mirror focuses the light onto the sample. Each sphere contains both a 1.9 μm InGaAs detector ( ϕ=4 mm, EG&G, Montgomeryville, PA) fitted with a 1000 nm filter (Cascade Optical Coatings, Santa Ana, CA) and a 2.6 μm InGaAs detector ( ϕ=4 mm, EG&G, Montgomeryville, PA) fitted with a 1300 nm filter (Cascade Optical Coatings, Santa Ana, CA). The 1.9 and 2.6 μm detectors, respectively, collect light between 1000 and 1660 nm and 1660 and 2200 nm. Standard computer analog to digital acquisition records the detector signals. From diffuse reflectance, Rd and diffuse transmittance Td values, the absorption and the isotropic scattering coefficients are obtained using the inverse adding–doubling program provided by Professor Scott Prahl at the Laser Research Center at St. Vincent Hospital, Portland Oregon.8 This program is a numerical solution to the one speed radiative transport equation, which describes light propagation at steady state in a scattering medium.6 The program is an iterative process, which estimates the reflectance and transmittance from a set of optical parameters until the calculated reflectance and transmittance match the measured values. Inputs that must be provided into the program are values for the anisotropy coefficient g and the refractive index n of the sample. Values for g and n are shown in Figure 2. In tissues, light is forward scattering and values for g used here range from 0.8 to 0.9 and come from data obtained by Roggan et al.;9 The refractive index is an important parameter because it describes the speed of light in tissue and it governs how the photons migrate. The refractive index n of skin is approximated from the refractive index of a 70/30 mixture of water and protein, assuming that protein has a constant refractive index value of 1.5 over the entire wavelength region. The value for n of skin can be calculated using the following expression: where A=1.58, B=8.45×10⁻⁴, C=1.10×10⁻⁶, D=7.19×10⁻¹⁰, E=2.32×10⁻¹³, F=2.98×10⁻¹⁷, and the wavelength λ is in nanometers. Values for A–F were obtained by fitting values of n for water10 11 to a fifth order polynomial.3.Validation of the Experimental SetupMonodisperse polystyrene suspensions in water were used to validate the optical properties obtained from the double integrating sphere apparatus and the inverse adding–doubling algorithm. Because absorption is dominated by water in this wavelength region of 1000–2200 nm, μa was determined from the electromagnetic properties of water ( μa of polystyrene is negligible in this wavelength region due to its low absorbance and small concentration) In Eq. (2), k is the imaginary component of the refractive index of water,10 11 λ is the wavelength of light, and ϕw is the volume fraction of water. The isotropic scattering coefficient μs ′ was determined from the following linear relationship to the volume fraction of microsphere ϕm The values for scattering efficiency Q scat and the anisotropy coefficient g are calculated from the microsphere radius r and the refractive indices of polystyrene and water using Mie theory.12 Figure 3 shows the typical agreement between theory and experimental measurements for μa and μs ′ obtained from the integrating sphere apparatus. At wavelengths between approximately 1900 and 2050 nm, the inverse adding–doubling program was not able to converge on acceptable values for μa and μs ′. This lack of convergence occurred because the large absorbance due to the 1920 nm water band leads to an insufficient amount of light reaching the detectors in either sphere. This decrease in signal can be illustrated by comparing μa of water at 1440 and 1930 nm, where μa is 32 and 125 cm−1, respectively. To examine the impact of this difference in absorption on light transport, consider the collimated transmission of light through a 1 mm sample at two different μa values. Then, where I1 and I2 represent the transmitted intensities at 1440 and 1930 nm, respectively. Substituting the appropriate values for the corresponding absorption coefficients, it can be seen that the result is approximately a 4 order of magnitude decrease in the transmitted intensity and thus a tremendous reduction in the number of photons reaching the detector. Therefore, no experimental data will be reported in this region. The results conducted on polystyrene microspheres in water validate the experimental values for the μa and μs ′ measured by the apparatus from 1000 to 2200 nm.Figure 3The absorption coefficient μa and the isotropic scattering coefficient μs ′ of polystyrene microspheres in water over the wavelength region of 1000–2200 nm. The particle diameters and volume fractions are: (a) d=0.520 μm and ϕm=0.0125; (b) d=0.600 μm and ϕm=0.0128, and (c) d=0.816 μm and ϕm=0.0079. The solid lines represent that predicted by the electromagnetic theory (μa) or Mie scattering theory (μs ′), and the symbols are the experimentally measured values. Data were taken every 20 nm. Because the high degree of absorption between 1900 and 2050 nm causes an inability to converge on reasonable values, no experimental data are reported in this region. 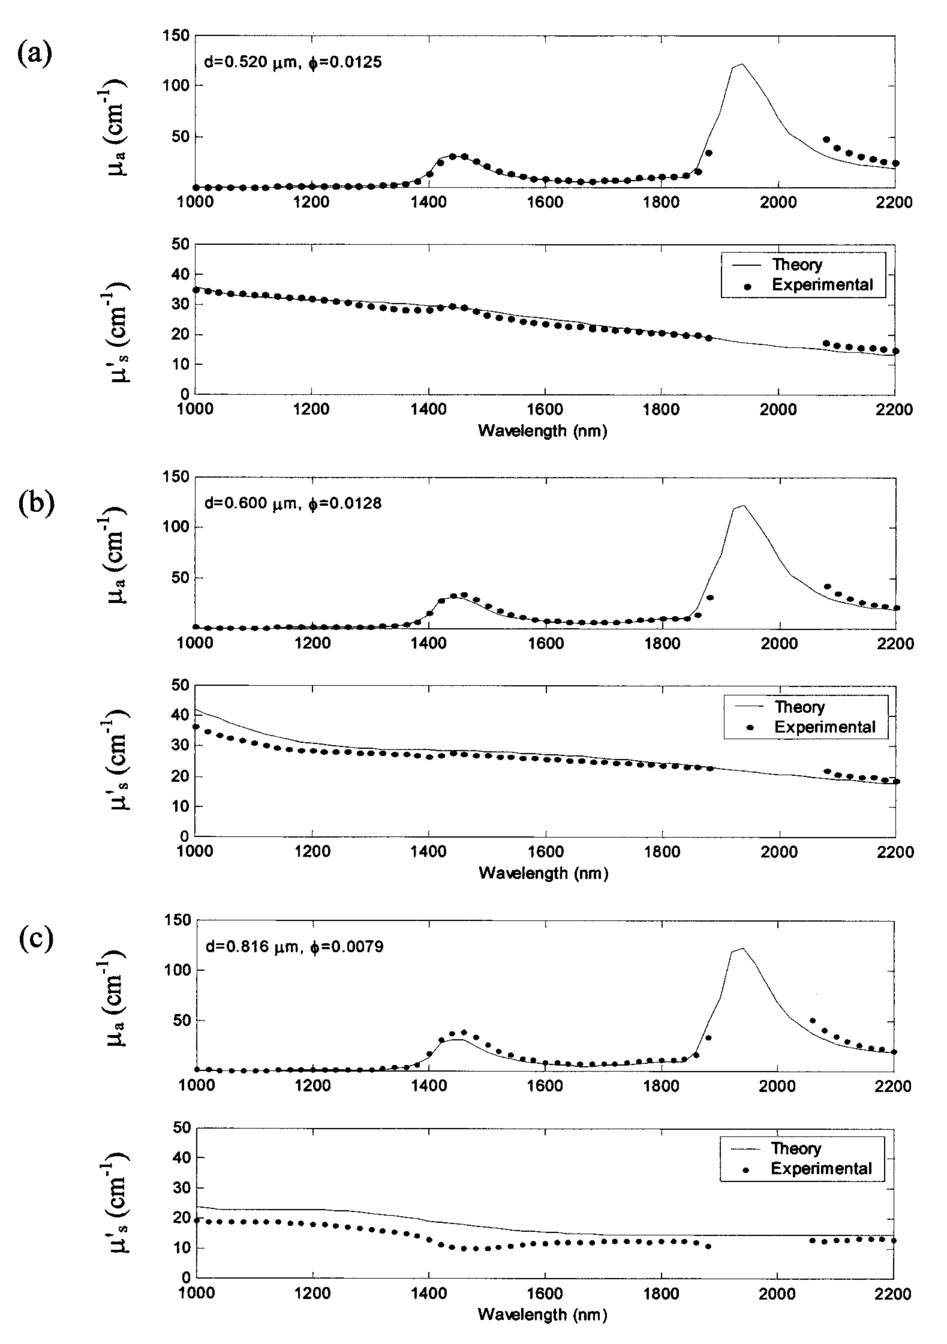 4.Tissue SpecimenMeasurements were conducted on 22 skin samples collected from 14 subjects. Table 1 is a summary of the skin tissue demographics. The thicknesses for the stratum corneum, epidermis, and dermis along with the comments section were determined from histological examination. The samples were obtained from either Phoenix Regional Medical Center (Phoenix, AZ) or Scottsdale Healthcare (Scottsdale, AZ) with prior patient consent. The tissue samples were wrapped in saline soaked gauze, transported to Instrumentation Metrics, Inc., and measured within 24 h of excision. All the skin samples were taken from tissue that would be otherwise destroyed following surgery. Human subject protocol guidelines of both hospitals were strictly followed and all procedures went through an Institutional Review Board approval. Table 1
After the skin samples were harvested from the patient, the subcutaneous fat was removed leaving an approximate 2-mm-thick sample. All samples contained a stratum corneum, epidermis, and dermis, which were determined from histology. The skin sample was usually large enough to cover the entire area of the sample port (2.5 cm in diameter). For situations in which the sample was too small (samples 16–20), the sample ports were reduced to 1.3 cm in diameter. Once at Instrumentation Metrics, Inc., the sample was placed between two glass plates and caliper measurements were taken to provide an accurate measurement of tissue sample thickness. The sample was then heated to 37 °C at which time three measurements on each side of the sample were taken in order to account for any inhomogeneities in the sample. Measurements were conducted at body temperature conditions since it was previously shown that differences exist in the optical properties when measurements are taken at different temperatures.13 14 It is also known that water absorption is highly sensitive to temperature in the near-infrared.15 Experimental data were collected at a resolution of 20 nm between 1000 and 1900 nm and 2040 and 2200 nm (a total of 52 wavelengths). Samples 1–6 were investigated with the 1.9 μm InGaAs detectors fitted with 1100 nm longpass filters, permitting information from 1100 nm onwards. The 1100 nm filter was then changed to a 1000 nm filter in order to collect data as low as 1000 nm for subsequent samples. The measured absorption coefficients μa for all 22 skin samples are found in Figure 4(a). Also plotted here is the theoretical μa of 70 water since the concentration of water in tissue is approximately 60–80. Because the major component of absorption in tissue is due to water, μa of skin is assumed to be similar to this value. Figure 4(b) is a plot of the isotropic scattering coefficient μs ′ for all 22 samples along with theoretical data. For soft tissues Jacques16 modeled the scattering coefficient as In this equation, m is a constant ranging from 2×10⁵ to 2×106 cm −1 , λ is the wavelength of light in nanometers, and λ0 is a reference wavelength of 1 nm. The experimental data for the skin samples show that the values for μs ′ stay in the range of 3–16 cm−1 over the entire wavelength region and are better modeled using a value of m equal to 2×105 cm −1 . Figure 4 nicely illustrates how the measured values of the optical properties follow the same trends.Figure 4(a) Plot of the experimentally measured absorption coefficient μa for 22 human skin samples (solid lines) and the theoretical absorption coefficient μa for 70 water (dotted line). (b) Plot of the isotropic scattering coefficient μs ′ for 22 human skin samples for both experimental data (solid lines) and Eq. (3) with m equal to 2×10⁵ or 2×10⁶ (dotted lines).  The mean and interpopulation standard deviations for the skin samples are plotted as a function of wavelength in Figure 5. All the data from the entire population studied here fall within 2.6 standard deviations for μa and 2.3 standard deviations for μs ′. Table 2 lists the optical properties for all the samples at four selected wavelengths of 1000, 1460, 1600, and 2200 nm. These wavelengths were chosen to include the endpoints (1000 and 2200 nm), information near the 1450 nm water band (large absorbance due to water) and the first overtone region (1600 nm). Figure 5The average (solid line) (a) absorption coefficient μa and (b) isotropic scattering coefficient μs ′ plotted with population standard deviations (dotted lines) of 22 human skin samples taken from 14 subjects. The data from the entire population falls within 2.6 standard deviations for μa and 2.3 standard deviations for μs ′. 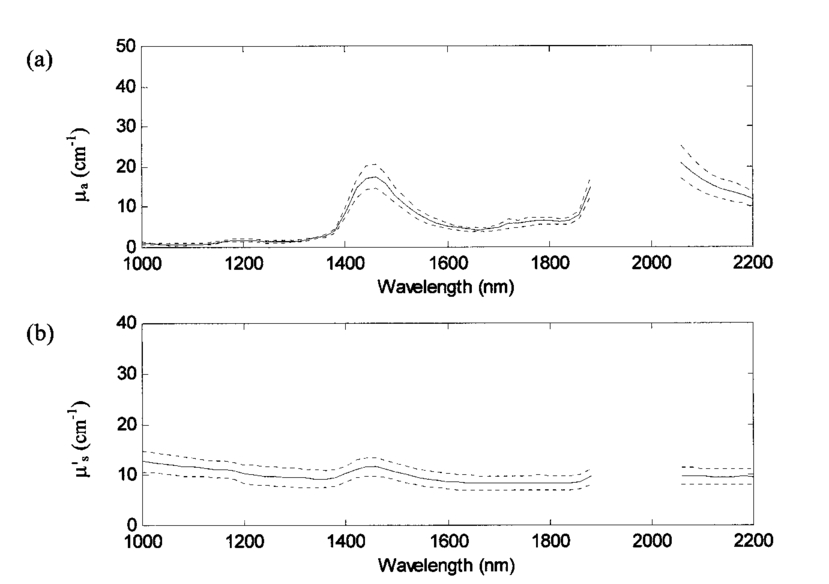 Table 2
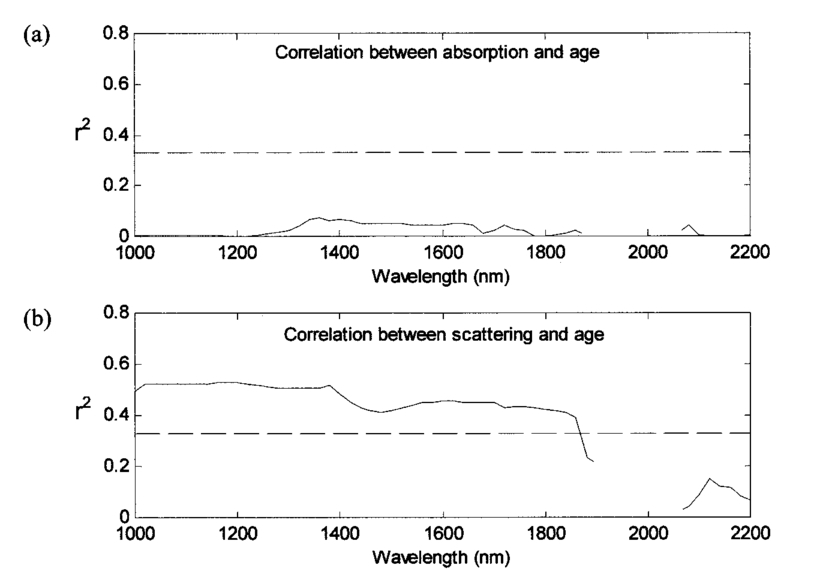
The availability of data from subjects of different ages allowed investigation into aging effects on the scattering and absorption coefficients of skin. The effect of aging on skin has been the topic of much research in the field of cosmetics. It is known that with age structural changes occur in skin.17 18 19 20 21 One would expect these changes to be manifested in the scattering coefficients, in which case we would see a significant correlation between age and the scattering coefficients. To see if these changes are indicated by the data collected, the squared correlation coefficient r2 was computed at each wavelength for μa and age and μs ′ and age. As can be seen from Figure 6 at a 95 significance level (indicated by the dotted line), age has negligible correlation with μa at all wavelengths and a significant correlation with μs ′ at wavelengths up to about 1800 nm. This lack of correlation beyond 1800 nm could be due to the lack of signal and higher noise in the measurement. Further, it was also found that the scattering coefficients were negatively correlated with age i.e., μs ′ decreased with increasing age. This negative correlation could be due to the reduction in density of cells.20 21 5.Skin Phantom ModelIntralipid is a fat emulsion that is typically used as a tissue simulating phantom in the therapeutic window (600–1000 nm) since it has optical properties similar to tissue when its concentration is diluted to 0.5 fat by volume.22 23 In this section solutions of Intralipid were investigated in the wavelength region of 1000–2200 nm in order to determine a concentration that has similar optical properties to skin. As discussed above, the inverse adding–doubling program requires input values for the anisotropy coefficient g and the refractive index n. The anisotropy coefficient was determined from Mie scattering theory12 where the phospholipid micelle (particle size) was assumed to have a uniform diameter of 0.36 μm. This value is the mean diameter of the Intralipid micelle measured by the manufacture (Fresenius Kabi Clayton R&D, Inc., Clayton, NC). The refractive index of Intralipid was calculated using a dispersion formula developed by Cauchy22 In this equation I=1.451, J=1.154×10⁴, and K=−1.132×10⁹ and λ is in nanometers.Because Intralipid is typically used as a nutritional supplement, the solution contains a small amount of glycerol (1.78 by volume). Glycerol has absorbance bands that are highly correlated to glucose absorbance bands.24 Therefore, it is desirable to work with glycerol free solutions. In this study, the optical coefficients of 2, 5, and 10 Intralipid solutions were measured for both glycerol and glycerol free to determine if glycerol affects the scattering or absorption characteristics. The experimental results show that the optical properties of the two solutions (glycerol and glycerol free) are within experimental error (Figure 7). Figure 7(a) Absorption coefficient μa and (b) isotropic scattering coefficient μs ′, as a function of wavelength for a 2 (solid line), 5 (dash-dot line), and 10 (dashed line) Intralipid solution and a 2 (solid line with symbol), 5 (dash-dot line with symbol), and 10 (dashed line with symbol) glycerol free Intralipid solution.  In order to develop an Intralipid phantom with similar transport characteristics to skin, the right combination of μa and μs ′ needs to be determined. Although a 1.5 Intralipid solution matches the μs ′ of skin over the entire wavelength region of 1000–2200 nm (data not shown for brevity), μa is too high when compared to the concentration of water in tissue (approximately 60–80). The major component of absorption in tissue is due to water and therefore, μa of skin is assumed to be similar to this concentration. Hence, the ratio of μa to μs ′ needed to be adjusted in order to obtain similar transport properties as skin. The similarity relations described by Flock et al.; were used23 This equation predicts that two mediums will yield similar values for diffuse reflectance Rd when the above equation holds. The relationship was derived from the diffusion approximation (i.e., μs ′≫μa ) and therefore is not exact in this wavelength region, especially around the 1450 and the 1920 nm water bands. Figure 8 is a plot of μs ′/μa for Intralipid concentrations ranging from 1 to 4 along with the minimum and maximum skin measurements. Experimentally measured data from the 2 Intralipid solution were used to calculate values for the other concentrations. At wavelengths less than 1900 nm, a 2 Intralipid concentration will provide a reasonable tissue-simulating phantom. At wavelengths greater than 2100 nm, an Intralipid solution between 2 and 4 will provide a reasonable tissue-simulating phantom. If only one concentration is practical, a 2 solution should provide the best correlation to skin over the entire wavelength region. This result is also corroborated by Hazen et al.; who report that the diffuse reflectance measurements of a 2 Intralipid solution have similar reflectance spectra to a noninvasive human arm measurement.246.DiscussionWe found that the deviations in optical properties for human skin samples studied here are fairly small. The experimentally measured optical properties for our entire population fall within 2.6 standard deviations for μa and 2.3 standard deviations for μs ′ (Figure 5). In the wavelength range of 1000–2200 nm, we found that values for μs ′ fall between 3 and 16 cm−1. These results show that the range of μs ′ for skin is much smaller than previously reported values for soft tissue.16 Because soft tissue includes more than one tissue type, these results are reasonable since only skin was investigated here. The values for μa closely resemble 70 of water. It should also be noted that the skin samples were wrapped in saline soaked gauze, which may have affected the values for μa. From these measured optical properties, it was determined that Intralipid could be used as a skin tissue phantom over the wavelength range of 1000–2200 nm provided a solution of approximately 2 is used. The results also reveal an inverse correlation between μs ′ and age from 1000 to 1800 nm possibly due to the reduction of cell density with age. Although the data studied here come from a small population (22 samples from 14 subjects), the results can be used for sensitivity studies to aid in the developmental design of suitable interfaces for noninvasive measurements. AcknowledgmentsThe authors wish to acknowledge the assistance of Holger Fuchs, Frank Grochocki, and Glenn Kees for their improvements to the experimental design. They would like to thank Matthew Welch for preparing the Intralipid samples. Much appreciation goes to Ken Meissner for his helpful suggestions. REFERENCES
S. Pan
,
H. Chung
, and
M. A. Arnold
,
“Near-infrared spectroscopic measurements of physiological glucose levels in variable matrices of protein and triglycerides,”
Anal. Chem. , 68 1124
–1135
(1996). Google Scholar
H. Zeller
,
P. Novak
, and
R. Landgraf
,
“Blood glucose measurement by infrared spectroscopy,”
Int. J. Artif. Organs , 12 129
–135
(1989). Google Scholar
G. W. Small
,
M. A. Arnold
, and
L. Marquardt
,
“Strategies for coupling digital filtering with partial least-squares regression: Application to the determination of glucose in plasma by Fourier transforms near-infrared spectroscopy,”
Anal. Chem. , 65 3279
–3289
(1993). Google Scholar
M. J. McShane
,
G. L. Cote
, and
C. Spiegelman
,
“Variable selection in multivariate calibration of a spectroscopic glucose sensor,”
Appl. Spectrosc. , 51 1559
–1564
(1997). Google Scholar
S. A. Prahl
,
M. J. C. van Gemert
, and
A. J. Welch
,
“Determining the optical properties of turbid media by using the adding-doubling method,”
Appl. Opt. , 32 559
–568
(1993). Google Scholar
J. W. Pickering
,
S. A. Prahl
,
N. van Wieringen
,
J. F. Beek
,
J. Sterenborg
, and
M. J. van Gemert
,
“Double integrating sphere system for measuring the optical properties of tissue,”
Appl. Opt. , 32 399
–410
(1993). Google Scholar
A. Roggan
,
J. Beuthan
,
S. Schrunder
, and
G. Mueller
,
“Diagnostik und Therapie mit dem Laser,”
Phys. Bl. , 55 25
–30
(1999). Google Scholar
P. Ray
,
“Broadband complex refractive indices of ice and water,”
Appl. Opt. , 11 1836
–1844
(1972). Google Scholar
T. L. Troy
,
D. L. Page
, and
E. M. Sevick-Muraca
,
“Optical properties of normal and diseased breast tissues: prognosis for optical mammography,”
J. Biomed. Opt. , 1 342
–355
(1996). Google Scholar
J. Laufer
,
R. Simpson
,
M. Kohl
, and
M. Cope
,
“Effect of temperature on the optical properties of ex vivo human dermis and subdermis,”
Phys. Med. Biol. , 43 2479
–2489
(1998). Google Scholar
K. H. Hazen
,
M. A. Arnold
, and
G. W. Small
,
“Temperature-insensitive near-infrared spectroscopic measurements of glucose in aqueous solutions,”
Appl. Spectrosc. , 48 447
–483
(1994). Google Scholar
C. H. Daly
and
G. F. Odland
,
“Age-related changes in the mechanical properties of human skin,”
J. Invest. Dermatol. , 73 84
–87
(1979). Google Scholar
G. L. Grove
,
R. M. Lavker
,
E. Hoelsle
, and
A. M. Kligman
,
“Use of nonintrusive tests to monitor age-associated changes in skin,”
J. Soc. Cosmet. Chem. , 32 15
–26
(1981). Google Scholar
W. Andrew
,
R. H. Behnke
, and
T. Sato
,
“Changes with advancing age in the cell population of human dermis,”
Gerontologia (Basel) , 10 1
–19
(1964). Google Scholar
T. Miyahara
,
A. Murai
,
T. Tanaka
,
S. Shiozawa
, and
M. Kameyama
,
“Age related differences in human skin collagen: solubility in solvent, susceptibility to pepsin digestion, and the spectrum of solubilized polymeric collagen molecules,”
J. Gerontol. , 37 651
–655
(1982). Google Scholar
H. J. van Staveren
,
C. J. M. Moes
,
J. van Marie
,
S. A. Prahl
, and
M. J. C. van Gemert
,
“Light scattering in Intralipid-10 in the wavelength range of 400–1100 nm,”
Appl. Opt. , 30 4507
–4514
(1991). Google Scholar
S. T. Flock
,
S. L. Jacques
,
B. C. Wilson
,
W. M. Star
, and
M. J. C. van Gemert
,
“Optical properties of Intralipid: a phantom medium for light propagation studies,”
Lasers Surg. Med. , 12 510
–519
(1992). Google Scholar
|
||||||||||||||||||||||||||||||||||||||||||||||||||||||||||||||||||||||||||||||||||||||||||||||||||||||||||||||||||||||||||||||||||||||||||||||||||||||||||||||||||||||||||||||||||||||||||||||||||||||||||||||||||||||||||||||||||||||||||||||||||||||||||||||||||||||||||||||||||||||||||||||||||||||||||||||||||||||||||||||||||||||||||||||||||||||||||||||||||||||||||||||||||||||||||||||||||||||||||||||||||||||||||||||||||||||||||||||||||||||||||||||||||||||||||||||||||||||||||||||||||||||||||||||||||||||||||


CITATIONS
Cited by 373 scholarly publications and 86 patents.
Skin
Optical properties
Tissues
Absorption
Scattering
Tissue optics
Water


