1.IntroductionHemoglobin concentration is one of the important blood substances. The hemiglobinocyanide method is often used to determine hemoglobin concentrations. This method requires reagent and blood lysis. A few techniques for hemoglobin measurement in whole blood without using reagents and blood lysis have been tried. Schmalzel et al.; developed an optical hemoglobinometer that directly measures the hemoglobin concentration in whole and undiluted blood.1 The device uses an infrared light emitting diode (813 nm) to illuminate a capillary tube where the accuracy appears to be <1 g/dL. Kuenstner and co-workers measured hemoglobin content with a standard error of 0.43 g/dL using a single term second derivative ratio of log(1/T) data at 1740 and 1346 nm.2 They measured the spectra of human hemoglobin in the near infrared region from 1000 to 2500 nm and explained why hemoglobin concentration might be measured in unlysed blood using near infrared spectroscopy.3 In addition, they presented near infrared spectroscopic measurements of hemoglobin concentration in whole blood for noninvasive hemoglobinometry. They used several wavelengths.4 The best result was obtained with a set of 1626, 1628, and 1638 nm (SEP: 0.32 g/dL). Valyi-Nagy and co-workers determined the relationship between reference hemoglobin data and values of the second derivative of the log(1/TF) spectra. Hemoglobin concentrations were determined by multiple linear regression (MLR) using three- and four-term linear summation equations. The best standard error of cross-validated (SECV) performance was 1.25 g/dL with a four-term model over the range from 5.9 to 20 g/dL.5 To reduce vulnerability of the spectral interference by other blood components, the absorption spectrum is measured over a certain range of wavelengths and the multivariate analysis is applied. Among the multivariate analysis techniques, partial least squares regression (PLSR) has been widely used. Previous studies have shown that the PLSR technique is a useful tool.6 7 In general, data preprocessing techniques such as the first and second derivatives and digital Fourier filtering may have to be used to minimize unwanted spectral features such as baseline variations before calibration.8 9 10 11 Predictions in the multivariate analysis can be influenced to a great extent, depending on what types of data preprocessing techniques are used. So far, no systematic comparison has been made to address the effects of preprocessing. In addition, blood samples containing a variety of particles induce scattering. It is not known whether scattering of a sample may induce any unpredictable influence such as pathlength variation with respect to the wavelength in absorption spectroscopy. In this study, we applied PLSR for predicting hemoglobin concentrations based on absorption spectra measured over the band of a certain wavelength instead of using absorbance at several discrete wavelengths. Absorption spectra of whole blood samples whose total hemoglobin concentrations ranged between 6.6 and 17.2 g/dL were measured from 500 to 800 nm. Two types of transmission measurements were studied: conventional transmission spectroscopy defined in this study as the collection of collimated radiation exiting the sample as seen in any spectrophotometer, and total transmission spectroscopy using an integrating sphere to collect all scattered light that passes through the sample. Whole blood contains diverse components, which induce light scattering. Usually a spectrophotometer measurement does not capture scattered light due to the limited size of the detector which is not near the sample. Total transmission was measured by placing an integrating sphere just behind the sample in order to study the influence of scattered light. Two issues were investigated for reagentless determination of the total hemoglobin concentration: the effect of data preprocessing and the influence of the transmission measurement method. 2.Materials and Methods2.1.Acquisition of Blood SamplesWhole blood specimens that contained EDTA were obtained from 95 outpatients. Hemoglobin values were measured by the hemiglobinocyanide method (HiCN) with Sysmex SE8000 (Kobe, Japan). Blood was diluted with a solution of potassium ferricyanide and potassium cyanide. Absorbance was measured at 540 nm and then compared to that of a standard solution. Measured hemoglobin concentrations ranged from 6.6 to 17.2 g/dL. The precision of this reference method was about 1. 2.2.Measurement of Conventional Transmission and Total Transmission SpectraA whole blood sample (26 μL) was put into a Hellma quartz SUPRASIL cuvette (Rijswijk, The Netherlands) with a pathlength of 0.1 mm that had detachable windows. Conventional transmission spectra at the 500–800 nm band were measured at 1 nm intervals by a Varian Cary 5G spectrophotometer (Melbourne, Australia) which is equipped with a R928 photomultiplier tube (PMT) detector and a visible lamp. The spectral bandwidth was 2 nm. Two scans were averaged for each sample and air was used as a reference. Acquisition of a single scan took 27 s. Samples were scanned at room temperature. Total transmission spectra were acquired by a diffuse reflectance accessory (DRA) of the Cary 5G spectrophotometer. The DRA had an integrating sphere attached to the backside of the cuvette to collect all light scattered through the sample. 2.3.Data AnalysisSeventy out of a total of 95 spectra from 95 individuals were randomly chosen as the calibration set and the remaining 25 spectra were used as the prediction set for univariate analysis and multivariate analysis. 2.3.1.Univariate analysisR2, the standard error of calibration (SEC) and the standard error of prediction (SEP) were computed. R2 is the coefficient that indicates the goodness of fit for a linear regression model and is calculated taking the squares of the correlation coefficient between absorbance and concentration. SEC is the square root of the mean of the squared differences between measured and predicted values using the calibration set. SEP is the square root of the mean of the squared differences between measured and predicted values using the prediction set. 2.4.2.Multivariate analysis (PLSR analysis)Before applying the PLSR model, spectra were exposed to various preprocessing methods. They were (1) Mean centering: the mean spectrum of all the spectra in the calibration set is calculated and is subtracted from each spectrum. (2) Variance scaling: each spectral data point is divided by the standard deviation of all calibration spectra. (3) Autoscaling: autoscaling is mean centering followed by variance scaling. (4) Multiplicative scatter correction (MSC): each spectrum is normalized according to the average spectrum of calibration set. This is calculated by the regression of each spectrum with respect to the average spectrum and by removing the slope and offset effects. (5) Standard normal variate (SNV): this normalizes spectra by computing and removing the mean value of each spectrum, and then scaling to the variance. (6) Normalize: normalization of spectra is accomplished by dividing each absorbance at each wavelength by the sum of the absorbance spectrum. (7) Savitsky–Golay 1st (SG 1st): a simple polynomial is fitted to a window containing a center data point and (n−1)/2 points on either side. A window width is selected and the point in the center of the window is replaced with the 1st derivative of the polynomial estimate of that point. We used five point SG 1st preprocessing. Preprocessing and PLSR model analysis were performed with the multivariate analysis program of SChemo™ developed by the authors. The optimal number of factors was determined by the one-in-one-out cross validation and F test with a significance level of 5. The whole spectrum (500–800 nm) and a partial spectrum (500–650 nm) were used for data analysis. According to the univariate analysis, the region above 650 nm had a lower correlation with the concentrations. The 500–650 nm region was used to check whether the region of 650–800 nm would or would not contain meaningful information for the multivariate calibration. For each algorithm/preprocessing technique, the performance level in terms of the SEP was compared. 3.ResultsFigure 1(a) showed conventional transmission spectra of the whole blood samples in the calibration set acquired by the Cary 5G spectrophotometer and the scatter plots between hemoglobin concentration and absorbance at 542 and 577 nm. These wavelengths correspond to absorption peaks of oxyhemoglobin. Total transmission spectra obtained using the DRA are illustrated in Figure 1(b). The spectra in Figure 1 showed a similar absorption shape of oxyhemoglobin peaks. Freshly drawn blood was used to acquire the spectra. Figure 1(a) Conventional transmission spectra of whole blood in the calibration set and the scatter plot of absorbance at 542 and 577 nm vs hemoglobin concentrations. Visible-NIR absorption spectra were measured by the Cary 5G spectrophotometer. (b) Total transmission spectra of whole blood in the calibration set and the scatter plot of absorbance at 542 and 577 nm vs hemoglobin concentrations. Transmission including scattered radiation was measured by the diffuse reflectance accessory of Cary 5G spectrophotometer.  Significant baseline variation was observed with conventional transmission spectra as shown in Figure 1(a). On the other hand, the baseline difference among spectra was reduced noticeably with the total transmission spectra [Figure 1(b)]. It appeared that some baseline variation observed in Figure 1(a) might be caused by the scattering effect in blood. The same feature was generally observed in all 95 spectral data. Total transmission spectra appeared to be related to hemoglobin values at first glance, which was verified in the univariate analysis. The results of the univariate analysis are shown in Figure 2. Total transmission spectra produced better results compared with those of conventional transmission spectra as expected and showed lower SECs and SEPs and higher R2 ’s. Figure 2(a) shows R2, SEC, and SEP at each wavelength in the region of 500–800 nm computed from conventional transmission spectra: R2 ranged from 0.37 to 0.83, SEC; 1.25–2.37 (g/dL) and SEP; 1.32–2.57 (g/dL). Wavelengths longer than 650 nm had a value of R2 lower than 0.4 where SEP had an inversely proportional shape with respect to the absorbance spectrum of hemoglobin. Figure 2(b) shows the results of total transmission spectra: R2 ranged from 0.21 to 0.97, SEC; 0.53–2.66 (g/dL) and SEP; 0.68–3.66 (g/dL). For the total transmission spectra, wavelengths shorter than about 580 nm showed a consistent value of SEP, about 0.75 g/dL. Figure 2(a) R2, SEC, and SEP in the region of 500–800 nm for total hemoglobin determination in whole blood from conventional transmission spectra. R2 ranged from 0.37 to 0.83, SEC; 1.25–2.37 (g/dL) and SEP; 1.32–2.57 (g/dL). (b) R2, SEC, and SEP in the region of 500–800 nm for total hemoglobin determination in whole blood from total transmission spectra. R2 ranged from 0.21 to 0.97, SEC; 0.53–2.66 (g/dL) and SEP; 0.68–3.66 (g/dL).  It was not sufficient to predict total hemoglobin with absorbance at a single wavelength. The results of PLSR analysis based on many wavelengths are summarized in Tables 1 and 2. The optimal number of factors, SEC, R2 of the calibration set, SEP, R2 and the mean percent error (MPE) for predictions were compared. Multivariate analysis based on 500–800 nm (Table 1) showed better prediction results than those based on 500–650 nm (Table 2) for both conventional and total transmission spectra. According to the correlation graphs, the wavelength region longer than 650 nm had lower correlation coefficients. However, the multivariate analysis including 651–800 nm showed more robust calibration and better prediction. This region might provide additional information for multivariate analysis to compensate for the errors induced by instrument drift, light scattering, sample pathlength, etc. Table 1
Table 2
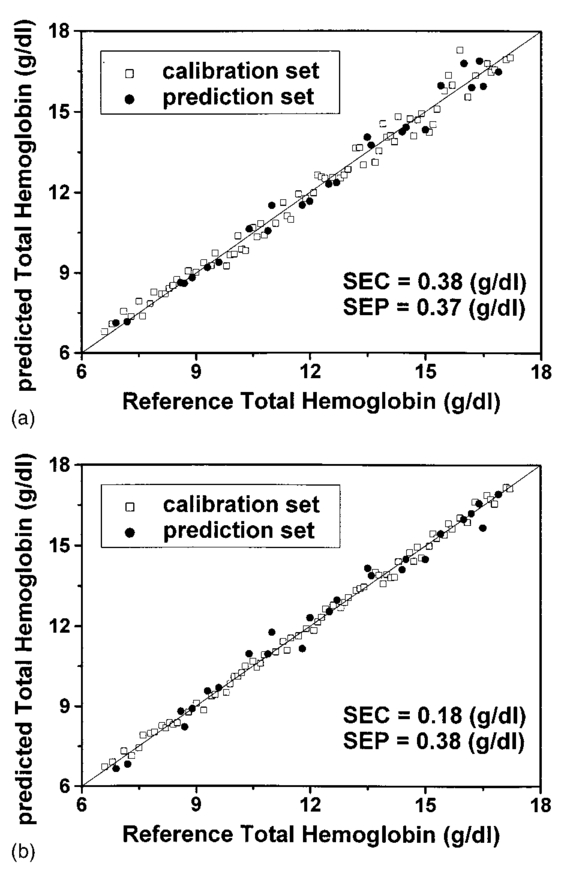
As shown in Tables 1 and 2, the preprocessing methods of MSC, SNV, and normalize produced more errors compared with other methods. MSC, for example, was designed to compensate for the scattering effect. On the contrary, MSC generated much a higher prediction error. In Figure 3 where data were preprocessed by MSC, all spectra looked indistinguishable in terms of hemoglobin concentrations. There seemed to be little correlation between absorbance and concentration. SNV and normalize also showed the same tendency as MSC. When absorption spectra were obtained under a well-controlled environment, information regarding hemoglobin concentrations became indistinguishable from one another after going through the processes of scattering correction, normalizing, etc. This is shown as poor PLSR results of the MSC, SNV, and normalization in Tables 1 and 2. Figure 3MSC preprocessed spectra of the calibration set and the scatter plot of absorbance at 542 and 577 nm vs hemoglobin concentration (a) using conventional transmission measurement and (b) using total transmission measurement.  For the best prediction in Table 1 (mean centering, 500–800 nm), the PLSR for total transmission spectra required six factors compared to three factors for conventional transmission spectra. To the contrary, for mean centering in 500–650 nm (Table 2), the PLSR for both types of spectra needed two factors. It appeared that additional factors for 500–800 nm were needed to explain low noisy baselines in 650–800 nm. According to the univariate analysis, wavelengths longer than 650 nm generally have lower R2 in total transmission spectra than in conventional transmission spectra (Figure 2). Lower R2 made the PLSR for total transmission spectra need more factors than that for conventional transmission spectra. For the multivariate analysis of 500–650 nm summarized in Table 2, the optimal number factors are smaller with total transmission measurement. Figure 4 presents reference and predicted values of hemoglobin for the two best calibration models. For both cases, the prediction data set fell close to an ideal line with little deviation. The precision of the reference method was about 1 and, in clinics, the acceptable precision for determination of hemoglobin concentration is up to 7.12 According to our results, the MPE values were within an acceptable precision. The data are shown in Table 1 (values of about 3). 4.DiscussionLight transmitted through whole blood scatters into different directions. It was expected that collection of scattered as well as transmitted radiation using an integrating sphere would provide more accurate results. Total transmission spectra showed less baseline variations than transmission spectra. For univariate analysis, total transmission spectra generated better prediction than conventional transmission spectra did. For multivariate analysis, on the other hand, comparable accuracy in terms of SEPs could be achieved for both conventional and total transmission spectra. It appears that baseline variations seen in conventional transmission spectra can be adequately handled with proper PLSR analysis. For multivariate analysis, the best results in terms of SEPs in our particular study were achieved when measured spectra were preprocessed by mean centering. Mean centering was appropriate since it merely shifted the levels of spectra without altering relative intersample relationships. Variance scaling gave comparable results compared with raw spectra with no pretreatment. MSC and some others produced even worse results compared with the no pretreatment case. We observed that various degrees of accuracy in prediction could be obtained, depending on what types of preprocessing techniques were applied. Absorption spectra may be affected not only by the concentration of a target component, but also by other sources. They could be pathlength variations caused by wavelength, selective absorption, electronic drift, etc. Often they are not correlated with the target component. This study proves that in vitro total hemoglobin prediction based on visible-near infrared (vis-NIR) spectroscopy measurement/PLSR prediction can be a viable tool. However, careful selection of data preprocessing and multivariate statistical analysis should be made in order to reduce undesirable influences other than a target concentration for reagentless determination of hemoglobin concentration of whole blood. When one has to use only a few wavelengths in the prediction instead of exploring many wavelengths, total transmission measurement is recommended as transmission measurement setup. REFERENCES
J. L. Schmalzel
,
J. M. Steinke
,
V. T. Randal
, and
A. P. Shepherd
,
“An opitcal hemoglobinometer for whole blood,”
Am. J. Physiol. , 257
(4/2), H1306
–H1311
(1989). Google Scholar
J. T. Kuenstner
,
K. H. Norris
, and
W. F. McCarthy
,
“Measurement of hemoglobin in unlysed blood by near-infrared spectroscopy,”
Appl. Spectrosc. , 48
(4), 484
–488
(1994). Google Scholar
J. T. Kuenstner
and
K. H. Norris
,
“Spectrophotometry of human hemoglobin in the near infrared region from 1000 to 2500 nm,”
J. Near Infrared Spectrosc. , 2 59
–65
(1994). Google Scholar
J. T. Kuenstner
and
K. H. Norris
,
“Near infrared hemoglobinometry,”
J. Near Infrared Spectrosc. , 3 11
–18
(1995). Google Scholar
I. Valyi-Nagy
,
K. J. Kaffka
,
J. M. Jako
,
E. Gonczol
, and
G. Domjan
,
“Application of near infrared spectroscopy to the determination of haemoglobin,”
Clin. Chim. Acta , 264 117
–125
(1997). Google Scholar
E. V. Thomas
and
D. M. Haaland
,
“Comparison of multivariate calibration methods for quantitative spectral analysis,”
Anal. Chem. , 62 1091
–1099
(1990). Google Scholar
S. Pan
,
H. Chung
,
M. A. Arnold
, and
G. W. Small
,
“Near-infrared spectroscopic measurement of physiological glucose levels in variable matrices of protein and triglycerides,”
Anal. Chem. , 68
(7), 1124
–1135
(1996). Google Scholar
H. Chung
,
M. A. Arnold
,
M. Rhiel
, and
D. W. Murhammer
,
“Simultaneous measurement of glucose and glutamine in aqueous solutions by near-infrared spectroscopy,”
Appl. Biochem. Biotech. , 50 109
–125
(1995). Google Scholar
B. W. Wabuyele
and
P. B. Harrington
,
“Fuzzy optimal associative memory for background prediction of near-infrared spectra,”
Appl. Spectrosc. , 50
(1), 35
–42
(1996). Google Scholar
K. H. Hazen
,
M. A. Arnold
, and
G. W. Small
,
“Temperature-insensitive near-infrared spectroscopic measurement of glucose in aqueous solutions,”
Appl. Spectrosc. , 48
(4), 477
–483
(1994). Google Scholar
|
||||||||||||||||||||||||||||||||||||||||||||||||||||||||||||||||||||||||||||||||||||||||||||||||||||||||||||||||||||||||||||||||||||||||||||||||||||||||||||||||||||||||||||||||||||||||||||||||||||||||||||||||||||||||||||||||||||||||||||||||||||||||||||||||||||||||||||||||||||||||||||||||||||||||||||||||||||||||||||||||||


CITATIONS
Cited by 11 scholarly publications and 4 patents.
Blood
Calibration
Absorbance
Absorption
Error analysis
Spectroscopy
Light scattering


