1.IntroductionSolid tumors are characterized by a heterogeneous arrangement of vasculature and intermittent fluctuations in blood flow that can result in inadequate supply of oxygen and nutrients to tumor cells.1 Consequently, the microenvironment of solid tumors is often characterized by the presence of intermittent and chronic hypoxia. Tumor hypoxia has been linked to biologically aggressive malignant disease and an overall poor patient outcome in the clinical setting.2 3 Understanding the physiology of tumor circulation and the responses of tumor cells to the effects of hypoxia is, therefore, of significant biological and clinical interest. Molecular events that occur in response to tumor hypoxia, e.g., upregulation of the hypoxia-inducible transcription factor 1-alpha (HIF-1α) and subsequent stimulation of angiogenesis, can be characterized by analyzing their spatial relation to other parameters that determine tissue oxygenation, such as the presence of blood vessels and perfusion, on a micro- and macroscopic scale. Histological sections from tumors can be stained with multiple fluorochrome-labeled monoclonal antibodies (MAb), so that tissue structure and function can be analyzed in their spatial context. Hence, study of the complex physiology and biology of solid tumors in sufficient detail and accuracy requires imaging of large areas/volumes with high resolution. Commercially available microscopes are suitable for imaging small fields of view (FOVs) with resolutions in the submicron range. However, since biopsies from human tumors are often >1 cm across, they cannot be imaged in a single microscopic FOV. Traditionally, this problem has been solved by using a computer-controlled stage to acquire individual FOVs and then “tiling” these as image arrays to form a composite of the object (see Figure 1). The tiling process is time consuming, requires accurate tile alignment to produce an artifact-free image and requires trained personnel to select areas of interest. The confocal scanning laser MACROscope® (CSLM), designed and patented4 at the University of Waterloo (Waterloo, Ontario, Canada), is a raster scanning system that uses galvanometric mirrors to scan a focused laser spot across the specimen. The CSLM was initially designed for quality control reflection and optical beam induced current imaging (OBIC) of solar cells and porous silicon.5 6 Subsequent modifications included design of a chromatically corrected objective lens for fluorescence imaging and further adaptation into a cDNA reader.7 In this initial feasibility study, we have used the CSLM to image triple-labeled sections from a cervical carcinoma xenograft, ME180, and obtain spatially coregistered images of blood vessels, tissue hypoxia, and the expression of HIF-1α. These images were compared to tiled images obtained using a standard epifluorescence microscope equipped with a computerized microscope stage and a digital charge coupled device (CCD) camera. 2.Materials and Methods2.1.CSLM OverviewThe component that distinguishes the MACROscope from its microscopic counterparts is the objective lens. To be able to scan over wide areas and to obtain a fluorescence image of a tissue section, an equally wide objective lens must be used. The laser scan lens (LSL) casing is approximately 8 cm in diameter and 15 cm in length, and contains seven lens elements, making it much larger than conventional microscope objectives. It is a telecentric f-theta lens with a numerical aperture (NA) of 0.2 and is chromatically corrected from 450 to 750 nm. The focused spot size is 4 μm, corresponding to a lateral (x–y) resolution of 2 μm, and an axial (z) resolution of 50 μm. The size of the scan area can be adjusted from 1 mm×1 mm to 20 mm×20 mm, thus allowing the user to zoom in on areas of interest. In laser scanning systems, light emitted from the specimen is traditionally amplified by a photomultiplier tube (PMT) that integrates the signal over time. Thus, if the scan rate across the specimen is constant, the pixel size will also be constant. In lenses such as microscope objectives that are not designed for f-theta operation, a beam pivoted about the objective’s entrance pupil will be translated by f⋅tan(θ) in the focal plane, where f is the focal length of the objective (see Figure 2). However, in microscopy, θ is generally small due to a small FOV and f⋅tan(θ)≅f⋅θ, thus a constant scan rate will produce a constant pixel size in the image. To obtain scanned images over large areas, large scan angles must be used (±5° is the maximum range in the MACROscope) so this approximation does not hold, and a conventional lens would give a tan(θ) dependence to the pixel size across the field, resulting in geometric image distortion. Figure 2Operation of the telecentric f-theta scan lens. A beam pivoted about the entrance pupil by an amount θ will be translated off axis by an amount f×θ in the focal plane when a lens is f-theta designed. The displacement for a non-f-theta lens is f×tan(θ).  To raster scan the excitation laser across the specimen, a single mirror placed at the entrance pupil of the LSL and pivoting in both the x and y directions would work ideally. Unfortunately, it is difficult to control the motion of such a mirror accurately.8 A much easier solution that was implemented in the MACROscope is to use two closely spaced mirrors, with the LSL entrance pupil located between them. This approximates the single mirror configuration well and is much easier to implement. A schematic diagram of the MACROscope is shown in Figure 3. There are three excitation wavelengths currently available provided by a helium–neon laser (633 nm), a frequency doubled Nd:YAG laser (532 nm) and an argon ion laser (488 nm). The laser energy incident on the specimen is ≅0.5 mW for each wavelength. The selected laser beam is expanded and collimated to a diameter of 1 cm by beam expanders immediately in front of the lasers (not shown). The light is then transmitted along a common optical path by dichroic beam splitters (DBSs), which reflect or transmit light based on wavelength. The excitation beam is directed onto a 70 transmitting, 30 reflecting beam splitter (BS) and then passed through a 2× beam expander (BE) where the full 2 cm diam scanning beam emerges. The beam is then incident on the two scanning mirrors and through the LSL. Figure 3Schematic setup of the confocal macroscope. M—Mirror, DBS—dichroic beam splitter, BE—beam expander, SM—scanning mirror, BS—beam splitter, FW—filter wheel, PMT—photomultiplier tube, LSL—laser scan lens.  Fluorescence emitted by the sample is collected and re-collimated by the objective lens, de-scanned by the mirrors and sent through the beam splitter. The light passes through a filter wheel, which transmits the fluorescence and blocks any unwanted back reflections. Finally, the beam is focused through a pinhole to produce the confocal effect, then into a photomultiplier tube. The use of a PMT for light detection provides extremely sensitive imaging capabilities with a fast response. The output of the PMT is piped into a frame grabber on a personal computer, which also controls the motion of the scanning mirrors. The scan rate, scan size, and sampling frequency are all selectable by the user through the interface program. For example, if one chose a 4 mm×4 mm area, with a resolution of 2048×2048 pixels, the pixel side length would correspond to approximately 2 μm. The pixel dwell time is also selectable by the user, and is generally on the order of 20 μs/pixel, so a 2048×2048 pixel scan can be completed in approximately 160 s. 2.2.Tumor Identification and Sample PreparationME180 cervical carcinoma cells, obtained from the American Type Culture Collection, were injected into the gastrocnemius muscle of a 8–9 week old female severe combined immunodeficient (SCID) mouse. After the tumor reached a size of approximately 9 mm in diameter, the nitroimidazole hypoxia marker EF59 was injected via a lateral tail vein (200 μL of a 10 mM stock solution to give a total body concentration of 100 μM). Three hours later, the tumor was excised and placed in a vial containing OCT tissue embedding medium (Sakura Finetek, Torrance, CA) and immediately frozen in liquid nitrogen. Whole sections were then cut using a cryostat and were fixed in 3.7 paraformaldehyde in phosphate-buffered saline (PBS) for 5 min. All incubations were done at room temperature, except where stated otherwise. Next, the anti-HIF-1α monoclonal antibody (Affinity Bioreagents, Golden, CO) at 1:600 dilution was incubated overnight at 4 °C, followed by incubation with a donkey-antimouse Cy3 conjugated secondary antibody (Jackson Immunoresearch, West Grove, PA). Blood vessels were labeled using an anti-CD31 antibody (BD Pharmingen, San Diego, CA) at 1:500 dilution for 1 h, followed by incubation with a donkey-antirat Cy2 conjugated secondary antibody (Jackson). Finally, tissue-bound EF5 was labeled using a 1:120 dilution of the ELK3-51 MAb directly labeled with Cy5 (generously provided by Dr. Koch, University of Pennsylvania) for 1 h. The sections were washed in PBS three times for 3 min between labeling steps. 2.3.Image Acquisition and ProcessingTriple-labeled sections from the ME180 cervical carcinoma xenografts were imaged using the CSLM and a standard epifluorescence microscope imaging system. The scan area of the CSLM was set to 8 mm×8 mm with a resolution of 2048×2048 pixels. Focusing the CSLM was done manually by adjusting the z distance to the LSL. A continual x-axis scan produced a real-time fluorescence emission histogram. The optimal focus was found by minimizing the full width at half maximum (FWHM) of the emission peaks (see Figure 4). To compensate for the relatively weak HIF-1α signal, the scan rate was slowed from 20 to 30 μs/pixel for Cy3 excitation (532 nm). Cy2, Cy3, and Cy5 fluorescence was collected using band pass filters centered at 545±45, 605±45, and 705±30 nm, respectively. Figure 4Focusing of the CSLM. Defocused (A) and properly focused (B) fluorescence intensity image profile across the x axis of the CSLM. Optimal focus is obtained when the FWHM of the peaks is minimized. 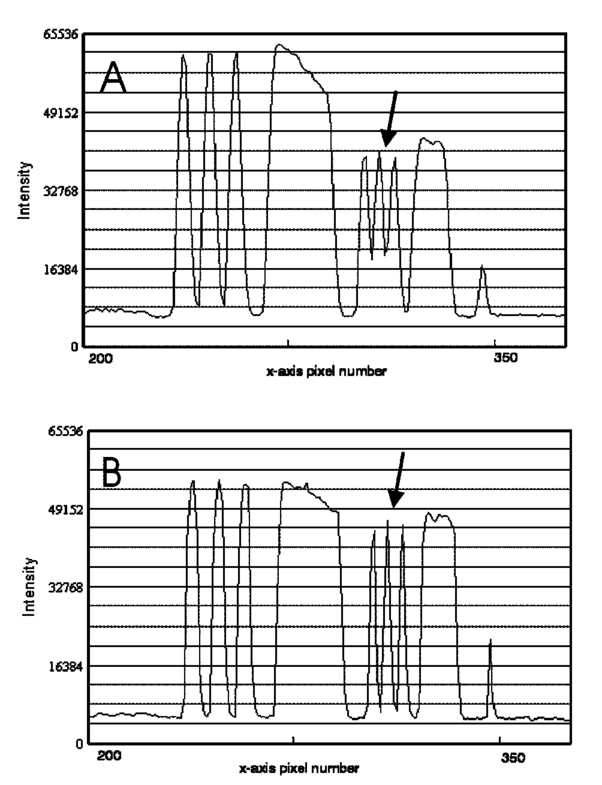 To compare the quality of images created using the CSLM, the same slides were imaged using a commercial epifluorescence imaging system (MCID 5+, Imaging Research, St. Catharines, Ontario, Canada). This system consisted of an Olympus BX50 fluorescence microscope linked to a Xillix MicroImager (Xillix Corp., Richmond, British Columbia, Canada) and a motorized stage (Ludl Biopoint, Hawthorne, NY). Using a 10×, 0.3 NA apochromat objective lens, sections were imaged and the emitted fluorescence was collected using appropriate filter cubes. Image integration times were set to 3 s per field, and the field of view was 0.78 mm×0.78 mm, for a total of 84 tiled images. The image of the vasculature was obtained by exciting the Cy2-tagged anti-CD31 MAb at 480±10 nm, and the fluorescence emission was collected using a 520 nm long pass filter. The HIF-1α expression was imaged by exciting the Cy3-tagged anti-HIF-1α MAb at 535±25 nm with fluorescence collection using a 610±38 nm band pass filter. Tissue hypoxia (EF5) was visualized by exciting the Cy5-tagged ELK3-51 MAb at 620±30 nm, and detected by a 700±38 nm band pass filter. Images captured using the MCID and the CSLM software were exported as 8-bit TIFF files. Processing was done using Adobe PhotoStop 5.0 (Adobe Systems Inc., San Jose, CA). Images obtained using the MCID system were contrast enhanced for presentation. Subsequently, images from both systems were converted to a red–green–blue (RGB) format and false colored. Selected regions of the HIF-1α (Cy3) fluorescence images were converted to binary images to extract nuclear structures from the background. Images were binarized by brightness thresholding at a level corresponding to three times the average background, as determined in four corner regions of the image. This was followed by median filtering (the filter width was set to 2 pixels) to remove nonspecific single-pixel fluorescence. 3.ResultsWe have imaged frozen and fixed sections from a ME180 cervical carcinoma xenograft, triple stained for blood vessels, tissue hypoxia, and the transcription factor HIF-1α. Figures 5(A)–5(C) contain a representative set of images of the vasculature, tissue hypoxia, and the transcription factor HIF-1α, generated using the MCID system. Panels (D)–(F) of Figure 5 contain the corresponding images obtained using the CSLM. The MCID software allows tiling with and without automated image alignment that compensates for microscope stage positioning artifacts. At high resolutions, this feature is essential for proper alignment of image features. Without alignment, tiling of the entire specimen took approximately 12 min per fluorophore; with alignment, this was increased to 28 min per fluorophore. Image acquisition on the CSLM took approximately 3 min for Cy2 and Cy5. For Cy3, the pixel dwell time was increased by 50, resulting in an acquisition time of approximately 4.5 min. Hence, imaging of a typical tumor section, as shown in Figure 5, was approximately three to eight times faster using the CSLM compared to the MCID system. Figure 5Fluorescence images of triple labeled tumor cut sections. Fluorescence images of the ME180 tumor vasculature (A) and (D), hypoxia (B) and (E), and HIF-1α (C) and (F) generated using the epifluorescence microscope (A)–(C) and the CSLM (D)–(F).  One of the reasons for the choice of imaging tissue hypoxia, blood vessels, and a nuclear transcription factor was to compare the resolving capability of the CSLM to that of a standard microscope. The hypoxia marker EF5 is a cell-based stain that labels entire areas with the specimen. On cross sections blood vessels are, essentially, structures composed of either a single or multiple cells, while HIF-1α is expressed almost exclusively in the cell nucleus. Visual inspection of the blood vessel images [Figures 5(A) and 5(D)] and the images of tissue hypoxia [Figures 5(B) and 5(E)] obtained using the CSLM and the MCID systems indicates that images of cellular and tissue-based features are of comparable quality in terms of resolution and contrast. At low magnification, images of the HIF-1α fluorescence [Figures 5(C) and 5(F)] obtained with the MCID and the CSLM also appear to be of comparable visual quality. To study the subcellular localization of HIF-1α fluorescence, the CSLM scan area was decreased to 4 mm×4 mm while maintaining the resolution of 2048×2048 pixels, effectively cutting the pixel size from 4×4 to 2 μm×2 μm [Figure 6(C)]. Figure 6(A) shows the same region in the MCID-generated HIF-1α image, generated using a 10× objective. It is obvious that the MCID image has higher resolution and captures more detail than the CSLM-generated image. Further processing of images to obtain quantitative information involved generation of binary images by setting a threshold on pixel brightness. The resulting binary images [Figures 6(B) and 6(D)] can be analyzed to determine the fraction of HIF-1α-positive cells and the spatial HIF-1α expression patterns. Despite the lower spatial resolution, the number and location of HIF-1α-positive nuclei in the binary HIF-1α image obtained with the CSLM and with the MCID system were similar. 4.DiscussionIn this study, we have used a confocal MACROscope to generate images of entire frozen tumor sections labeled with multiple fluorescence markers. The image acquisition speed of the CSLM and its capability to resolve tissue features has been compared to that of the MCID epifluorescence microscope imaging system. In the current configuration, the CSLM can generate images up to eight times faster than the MCID system and resolve features at the size scale of individual cells. Thus, the CSLM is a useful optical instrument for multiparameter fluorescence imaging of cells and tissues. The ability to image multiple parameters quickly is important since it can significantly increase throughput, especially in applications where large areas of tissue sections are analyzed, as in three-dimensional reconstruction of entire tumors. In the MACROscope three separate excitation wavelengths are available but, at present, there is only one PMT detector, thus individual fluorophores are imaged sequentially. By adding two more PMTs, this system can be converted to allow simultaneous acquisition in three fluorescence channels. This modification would further decrease the acquisition times, so that a triple-stained section could be imaged at a typical resolution (2048×2048 pixels) in 3–4 min. In comparison, the MCID system takes approximately 36 min to obtain a three-color image (without the alignment, thus allowing for image registration artifacts), and 84 min with tile alignment. The MACROscope used here was also limited to exciting a single fluorescent dye for each laser source. A new system currently under development will incorporate multispectral imaging to allow the user to image two or more fluorophores with a single laser source and allow the simultaneous detection of more than three parameters in a single section. We are currently considering two methods for multispectral imaging in the range from 450 to 750 nm. The first involves the use of a transmission grating or linear variable filter to record the spectrum of a single pixel onto a back-thinned linear CCD array. This configuration would give a spectral resolution of 1–2 nm (CCD pixel size ×spectral dispersion of the grating). However, a longer pixel integration time (i.e., pixel dwell time) may be required to accumulate enough signal with theCCD, thus significantly increasing image acquisition times. Since the speed of the system is one of its major advantages, a faster option for spectral imaging is also being investigated using PMT based detection. This setup is expected to retain the image acquisition speed and high sensitivity of a PMT, with a spectral resolution of 10 nm. The costs of implementing these techniques are similar for each method discussed, but PMTs appear to be better suited to the CSLM architecture. Currently we are using the CSLM to characterize biological consequences of tumor hypoxia in cervical carcinoma xenografts and in patient tumors, using double- and triple-labeled tumor sections. In future studies we plan to utilize its high imaging throughput capability to reconstruct tumor volumes in 3D from multiple-labeled serial tumor sections. AcknowledgmentsThis work was supported by the Canadian Institute for Photonics Innovation and by the National Cancer Institute of Canada, using funds raised by the Terry Fox run. The MACROscope was funded by the Canada Foundation for Innovation. The authors would like to thank Dr. A. E. Dixon and Dr. S. Damaskinos of the University of Waterloo and Biomedical Photometrics, Inc. (Waterloo, Ontario, Canada) for access to the MACROscope technology and advice. REFERENCES
M. W. Dewhirst
,
“Concepts of oxygen transport at the microcirculatory level,”
Semin. Radiat. Oncol., 8 143
–150
(1998). Google Scholar
M. Hockel
,
K. Schlenger
,
B. Aral
,
M. Mitze
,
U. Schaffer
, and
P. Vaupel
,
“Association between tumor hypoxia and malignant progression in advanced cancer of the uterine cervix,”
Cancer Res. , 56 4509
–4515
(1996). Google Scholar
A. W. Fyles
,
M. Milosevic
,
R. Wong
,
M. C. Kavanagh
,
M. Pintilie
,
A. Sun
,
W. Chapman
,
W. Levin
,
L. Manchul
,
T. J. Keane
, and
R. P. Hill
,
“Oxygenation predicts radiation response and survival in patients with cervix cancer,”
Radiother. Oncol. , 48 149
–156
(1998). Google Scholar
A. C. Ribes
,
S. Damaskinos
,
H. F. Tiedje
,
A. E. Dixon
, and
D. E. Brodie
,
“Reflected-light photoluminescence and OBIC imaging of solar cells using a confocal scanning laser MACROscope®/microscope,”
Sol. Energy Mater. Sol. Cells , 44 439
–450
(1996). Google Scholar
A. C. Ribes
,
S. Damaskinos
,
A. E. Dixon
,
K. A. Ellis
,
S. P. Duttagupta
, and
P. M. Fauchet
,
“Confocal imaging of porous silicon with a scanning laser MACROscope®/microscope,”
Prog. Surf. Sci. , 50 295
–304
(1995). Google Scholar
E. K. Seto
,
S. Damaskinos
,
A. E. Dixon
,
W. L. Diehl-Jones
, and
C. A. Mandato
,
“Imaging electrophoretic gels with a scanning beam laser MACROscope®,”
Electrophoresis , 16 934
–940
(1995). Google Scholar
E. M. Lord
,
L. Harwell
, and
C. J. Koch
,
“Detection of hypoxic cells by monoclonal antibody recognizing 2-nitroimidazole adducts,”
Cancer Res. , 53 5721
–5726
(1993). Google Scholar
|


CITATIONS
Cited by 4 scholarly publications.
Tumors
Luminescence
Hypoxia
Tissues
Microscopes
Confocal microscopy
Image resolution


