1.IntroductionUltrasonic cavitation (USC) is a potent mechanism for physical and biological effects (see, for example, Ref. 1). During USC, the ultrasound pressure wave causes pulsation of cavities or bubbles in liquid media or biological tissue. The ultrasonic energy is concentrated near pulsing bubbles, which can result in highly nonlinear generation of violent forces and high velocity-gradient fluid flows. Initiation of cavitation by moderate amplitudes in most biological media, which are exceptionally clean and sterile, requires augmentation of the natural nucleation in the form of gaseous inhomogeneities. Because active ultrasonic cavitation bubbles derived from nuclei are small, e.g., less than 3 μm diam resonance size for 2.5 MHz ultrasound, the effects generated by a single cavity are highly localized. However, proliferation of cavities subsequent to nucleation can occur by growth and fragmentation of larger bubbles, which can yield extensive cavitation activity and effects. For example, rapid proliferation of thousands of bubbles from a few initial nuclei has been shown to occur for a rotating tube exposure system and to yield high levels of lysis in cell suspension.2 Cavitational bioeffects range from transient membrane permeabilization (sonoporation) of cells to homogenization of tissue. If controlled and directed, these bioeffective phenomena have a potential for development of new applications for medical therapeutic purposes. Medical applications of nonthermal bioeffects associated with USC are limited due to unpredictable conditions of nucleation in vivo. Present applications utilize low frequency (e.g., 20 kHz) probes which are invasive and poorly targeted. Ultrasonic liposuction involves infusion of fluids and fragmentation of fatty tissue by cavitation at the probe tip.3 Phacoemulsion of the eye lens also appears to involve cavitation.4 Extracorporeal shockwave lithotriptsy utilizes low frequency (i.e., about 100 kHz) focused ultrasound shockwaves to break up kidney stones, which apparently includes cavitation activity.5 At higher frequencies, for which ultrasound can be precisely controlled and accurately targeted, thresholds for cavitational effects are high, and results unpredictable in mammalian tissues. For example, the phenomenon represents a problem for ultrasound therapy based on heating, due to random disruption of carefully planned heating regimens.6 Applications of high frequency USC to medical therapy will therefore require new methods to control and direct the cavitation process. Essentially, this means controlled creation and placement of cavitation nuclei within tissue. Several methods of cavitation nucleation control have been considered and tested. A simple method is to place a macroscopic gas bubble within an exposure chamber or tissue for exposure to ultrasound. In a study of sonoporation of erythrocytes by shockwaves in vitro, this method was very effective in regulating the nucleation and resulting effects.7 This method has been applied in vivo for enhancing cancer chemotherapy8 and for tumor ablation with cancer gene therapy.9 An alternative cavitation nucleation agent can be provided by an ultrasound contrast agent, such as Albunex® or Optison™ (Mallinckrodt, Inc.), which consist of suspensions of stabilized air or perfluorocarbon-filled bubbles, respectively. The gas bodies are a few microns in diameter and pass through the circulation without producing significant embolization. Under suitable conditions (e.g., high concentration, or special rotating chambers) cavitation, as indicated by the hemolysis assay, can be produced by moderate amplitude ultrasound with these contrast agents.10 11 Another promising nucleation agent is micron-sized perfluoropentane droplets in suspension, which performed as well as retained air or added contrast agent in studies of cavitation nucleation in whole blood with lithotripter shockwaves.12 Propagation of high intensity, focused laser beams can produce optical breakdown of any transparent medium. In aqueous media or other fluids, this photodisruption phenomenon results in production of a detectable microbubble under suitable conditions of wavelength, energy, and pulse duration. Photodisruptive laser nucleation (PLN) generates an acoustic shockwave which can be used to deduce bubble properties.13 14 Bubble sizes are estimated to be of the order of microns, tens of microns, and hundreds of microns near optical breakdown threshold energies for fs, ps, and ns laser pulses, respectively. An interesting application of PLN has been to the study of bubble acoustics. Good agreement has been found with theory for laser-generated bubbles under free oscillation even for the difficult problem of the asymmetric pulsation of a bubble near a boundary.15 For example, when a Nd:YAG laser generating 30 ps pulses at 1064 nm was focused into water, elongated bubbles, roughly 30×100 μm were generated together with spreading shockwaves.16 Ultrashort (e.g., 300 fs) pulses generate bubbles less than 50 μm in diameter, and as small as a few microns in diameter near the threshold for photodisruption.14 PLN can be produced in any transparent material, accompanied by local physical damage. These mechanical effects are dependent on the absorbed laser pulse energy, with the breakdown threshold dependent upon pulse duration. In biological media, this damage is controlled and directed for medical application.17 The application of photodisruptive lasers in ophthalmology (treatment of secondary cataracts, capsulotomy, etc.) is a well known and wide spread medical application.18 However, significant effort has also been directed toward development of laser applications based on photodisruption in dermatology (e.g., tattoo removal),19 in hair removal,20 and in neurosurgery.21 22 Photodisruption has been limited in these applications by the requirement that the optical intensity at the target tissue exceed 1012 W/cm 2 , which is needed for optical breakdown. The optical breakdown threshold in general, and in tissue in particular, follows a square root dependence on pulse width.23 Ultrashort pulse laser sources (picosecond or less) may allow for the creation of breakdown in scattering or absorbing tissues, as the relatively low threshold fluences may be reached even with large scattering or absorption losses. The existence of both laser-induced and ultrasound-induced cavitation phenomena presents intriguing possibilities for their combination. Although acoustical behavior of laser generated bubbles has been investigated, the interaction of the PLN bubbles with ultrasound has apparently not been studied previously. In this study we examined the hypothesis that single PLN cavities precisely placed within a region subject to a pre-existing (or subsequently established) ultrasonic field could serve to nucleate USC, under conditions for which USC is inhibited by a dearth of nuclei, and result in the synergistic enhancement of biological effects. Ultrasonic enhancement of the PLN effects of a single microscopic cavity are hypothesized to result from proliferation of cavities and bubbles to yield widespread vigorous ultrasonic cavitation activity. For this purpose a bioeffects research apparatus was created to allow coincident application of focused laser and ultrasound beams to a small flow chamber. Cavitation activity was characterized by reception of acoustic emissions, and by the hemolysis test for cavitation activity.2 The results confirm the possibility of synergistic enhancement of biological effects by the photodisruptive laser nucleation of ultrasonic cavitation. 2.MethodsA special exposure apparatus was constructed for this research to accommodate both laser and ultrasound exposure. The setup is illustrated in Figure 1. A flow-through chamber was placed in an 8 L water bath, with vertical flow provided upward through the chamber by a syringe pump. The room temperature (about 22 °C) water in the bath was degassed before use to minimize bubble formation in the bath. The chamber, illustrated in Figure 2, consisted of an 8 mm thick transparent rectangular plastic block (12 mm by 12 mm) with a 6 mm diam cylindrical hole oriented horizontally for transmission of ultrasound beam, a 2×3 mm window cut into the 6 mm hole for transmission of the laser beam, and vertically oriented 1.3 mm (inner diameter) (i.d.) plastic tubes entering and leaving the top and bottom of the chamber to allow target fluid flow. Figure 1Illustration of the experimental setup from the side. The ultrasound beam was perpendicular to the page in this view. Samples were collected in a tube (s). 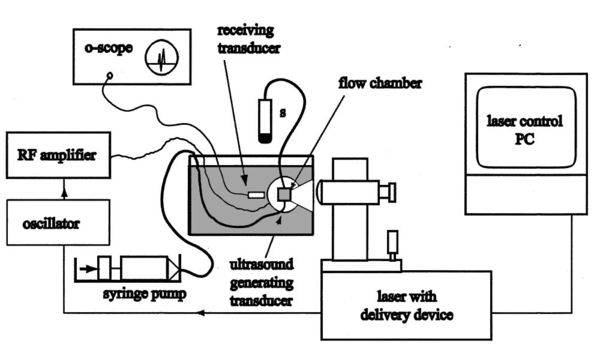 Figure 2Illustration of the exposure chamber from the top. The flow of fluid was vertically upward out of the page for this view.  The laser was a complete clinical system manufactured for use in ophthalmic investigations (Intelligent Surgical Lasers model QC2000). The console consisted of a laser engine, power supply, and control electronics, a PC with a menu-driven s-ware interface, and an integrated slit lamp delivery system. The laser engine began with a diode-pumped, actively mode-locked Nd:YLF oscillator. The MHz train of picosecond pulses was then directed into a Nd:YLF regenerative amplifier. A Pockels cell gated the injected pulses into and out of the amplifier, producing a 1.05 μm wavelength fundamental mode, 30 ps pulse duration, kHz pulse train with energies up to a few hundred mJ. Two energy detectors in combination with a polarizer and rotatable waveplate enabled automatic control of the pulse energy. Turning mirrors steered the beam through an articulating arm into a translatable beam delivery system, which decoupled motion of the delivery system from the laser engine. In the delivery system, the beam was expanded and focused though a large diameter objective ( f.1.=40 mm, f#=0.9 ), producing a focused spot size in air of approximately 10 μm. Calibration of the pulse energy was performed by simply measuring the average power delivered to a power meter at the delivery objective and comparing this pulse energy against the laser system pulse energy monitor readout. No attempt was made to determine the pulse contrast. Prepulsing of the amplifier was observed with a photodetector at amplitude approximately 100× below the gated pulse amplitude. It was assumed that variation in the apparent breakdown threshold due to prepulsing was not important because the goal of the laser breakdown was to produce cavitation nuclei (rather than to determine the true threshold energy). The delivery device contained an in-line microscope and manual positioning controls which allowed for positioning of the beam focus in the target. The delivery system was arranged such that the laser beam was focused through an optically flat cover glass window into the chamber, perpendicular to the axis of the cylindrical ultrasound transmission channel, at a depth of approximately 2–3 mm. The laser beam then defocused toward the rear of the chamber and passed out into the bath. A focused ultrasound beam was directed approximately along the axis of the cylindrical chamber to cross the laser focal zone at a right angle. To facilitate transmission of the ultrasound under near-free-field conditions, acoustically transparent windows made of 12 μm thick polyvinyl chloride were used on the ends of the cylindrical chamber. The ultrasound beam passed through the chamber, defocused in the bath, and was terminated at a block of ultrasound absorbing material (SOAB rubber, BF Goodrich). The liquid flow was directed upward, perpendicular to the laser and ultrasound beams. The 2.1 mL/min flow from 1.3 mm i.d. tubes (about 25 mm/s) produced good flushing of the chamber, which would clear within a few seconds. The air-backed ultrasound transducer was 3.75 cm in diameter with a radius of curvature of 3.75 cm. The piezoelectric ceramic had a fundamental thickness resonance at about 770 kHz, but was operated for this experiment at 2.5 MHz. At 2.5 MHz, the wavelength in water is about 0.6 mm, which allowed tight focusing into the flow chamber. The transducer was electrically excited by a signal generator (Model 3314A, Hewlett-Packard Co., Santa Clara, CA) and amplifier (Model 350L, Electronic Navigation Industries, Rochester, NY). The ultrasound field was measured with a calibrated hydrophone with 0.4 mm sensitive spot (model 805, Sonic Technologies, Hatboro PA). The half power focal diameter and length were 1.3 and 8.6 mm, respectively. The spatial peak exposure levels utilized in this study are listed in Table 1 in terms of the peak positive, peak negative, and mean amplitudes. The influence of finite amplitude distortion on the initially sinusoidal pressure wave is evident in the pressure values, but does not represent a strongly shocked wave (the highest ratio of peak-positive to peak-negative pressure amplitude was about 2.5). All results are specified in terms of the mean pressure amplitude for each exposure level. Table 1
An ultrasound receiving transducer (6 mm diam, 1 MHz Gamma series, KB-Aerotech, Lewiston, PA) was aimed at the position of the intersecting laser and ultrasound beams. This receiver was oriented with its axis in the plane of the intersecting beams, and placed about 3 cm away. Signals emitted by the laser photodisruption were received by this sensor, which provided a useful triggering signal and diagnostic information on the consistency of the optical breakdown. It should be noted that the finite bandwidth of the sensor, and reverberation of the acoustic emissions within the flow chamber, distorted this signal in complex ways from the faithful representation of the emissions. The receiver, which was placed just outside the ultrasound beam at a position of minimal pickup, was also utilized for alignment of the laser and ultrasonic foci. With the ultrasound beam operating at a high pressure amplitude, and the laser focus producing a visible photodisruption flash, the laser focus was moved in space to maximize the acoustical signals received. Figure 5The percentage of cells lysed by the combined treatment of laser with 500 Hz PRF and continuous 2.5 MHz ultrasound at the indicated mean pressure amplitudes. With the laser off, the result at 7.4 MPa declined to the ultrasound-off level.  The level of hemolysis in dilute blood cell suspensions flowing through the exposure chamber was assessed, which is an established and biologically relevant means to gage cavitation activity. Canine whole blood was collected by sterile venipuncture into blood collection tubes with EDTA anticoagulant (Vacutainer no. 6457, Becton-Dickinson and Co., Franklin Lakes, NJ). All animal procedures were performed under the guidelines and with the approval of the University Committee on the Use and Care of Animals. Several tubes were pooled for use in the experimentation, with an hematocrit of about 54. The whole blood cells were washed once in phosphate buffered saline (PBS), and diluted in degassed PBS to a final cell concentration of 0.109 (about a 500-fold dilution of whole blood). This dilution was convenient for the hemolysis measurements for cavitation activity assessment and also allowed penetration of the laser beam into the chamber. Higher concentrations, e.g., whole blood, would prevent laser breakdown for this system by attenuating the laser beam primarily through optical scattering. It should be noted that in highly scattering tissues, the use of longer wavelength near-infrared ultrashort pulses can produce photodisruption and cavitation nucleation. A recent report of the precision micromachining of subsurface features in ex vivo human sclera and dermis using a 1700 nm wavelength, 150 fs laser source demonstrates this potential.24 In some experiments, 5 bovine serum albumin was added to the medium. All the cell suspensions were briefly degassed by vacuum to reduce extraneous bubble formation and the population of naturally occurring cavitation nuclei. This served to elevate the ultrasonic cavitation threshold to simulate in vivo conditions of low nucleation, for which cavitation thresholds are greater than 5 MPa in the low MHz frequency range.6 During exposure, approximately 1 mL specimens were collected in about 30 s after passage of the dead volume of the tubing. Each specimen was centrifuged and the absorbance of the supernatant measured using a spectrophotometer set to 414 nm to determine free hemoglobin. This instrument was zeroed with PBS, and calibrated using a blood sample hemolyzed in water. Data are presented as the mean of four repeated experimental measurements with standard error bars, and the two-sided t-test was used for statistical comparisons between data means. 3.ResultsTypical PLN emissions detected by the receiver are shown in Figure 3 for a laser energy of 75 μJ. The form of the received signal was an initial pulse, followed after an interval by a second, similar pulse. In PBS, the signal was variable as illustrated in Figures 3(a), 3(b), and 3(c). The smaller amplitude signals also had a shorter interval between pulses than the larger amplitude signals. Addition of 5 BSA to the PBS produced much more uniform signals, as shown in Figure 3(d). The double pulse with albumin was of relatively high amplitude and long interval. Figure 3Signals obtained from the ultrasonic receiver for laser photodisruption in the exposure chamber. Traces (a), (b), and (c) were all generated for the same laser energy and PRF, and represent the range of variability seen in this signal. Trace d was obtained under identical conditions but with 5 BSA added to the medium. The trigger in trace d was from the laser pulse, rather than from the received signal, which shows the delay caused by propagation of the acoustical signal to the receiver. 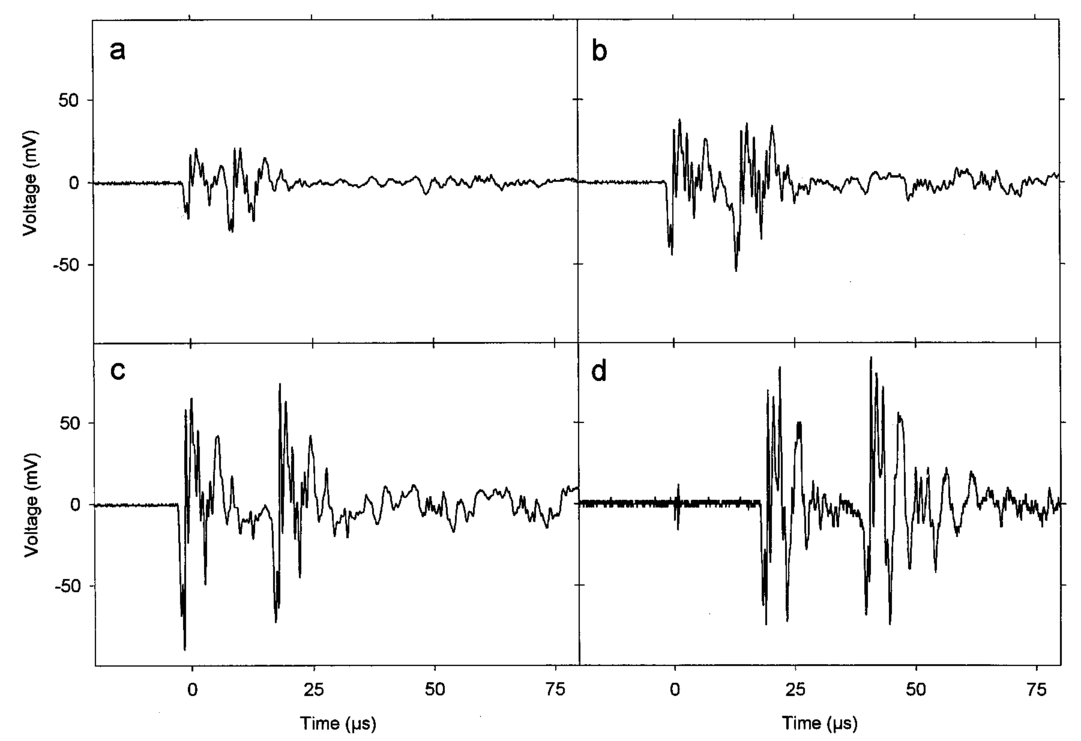 When continuous ultrasound exposure was delivered across the laser beam at the photodisruption point, USC emissions were detected in addition to the PLN emissions for 75 μJ pulses. The USC emissions were strongly dependent on ultrasonic amplitude, and began to appear intermittently above a pressure amplitude of about 3–4 MPa. The signals received for laser PLN at a 500 Hz rate in the blood cell suspension are shown in Figure 4(a) for 5.3 MPa and Figure 4(b) for 7.4 MPa ultrasound. The relatively large, constant background signal was due to pickup of the ultrasound beam by the receiver. The repetitive bursts consisted of the initial PLN emission with an initially growing USC emission signal which peaked and declined into the background noise before the next PLN pulse. Both the amplitude and duration of the USC emissions increased with the ultrasound pressure amplitude. Added albumin appeared to reduce the variability in the response as shown in Figure 4(c), compared to Figure 4(b) under identical conditions without BSA. In Figure 4(c), the initial PLN emissions are clearly distinguished from the subsequent USC emission burst. Figure 4Signals representing the ultrasonic cavitation emissions generated by the photodisruptive laser nucleation at 500 Hz PRF in cell suspensions: (a) 5.3 MPa, (b) 7.4 MPa, and (c) 7.4 MPa with added protein. Note the much longer time span compared to Figure 3. 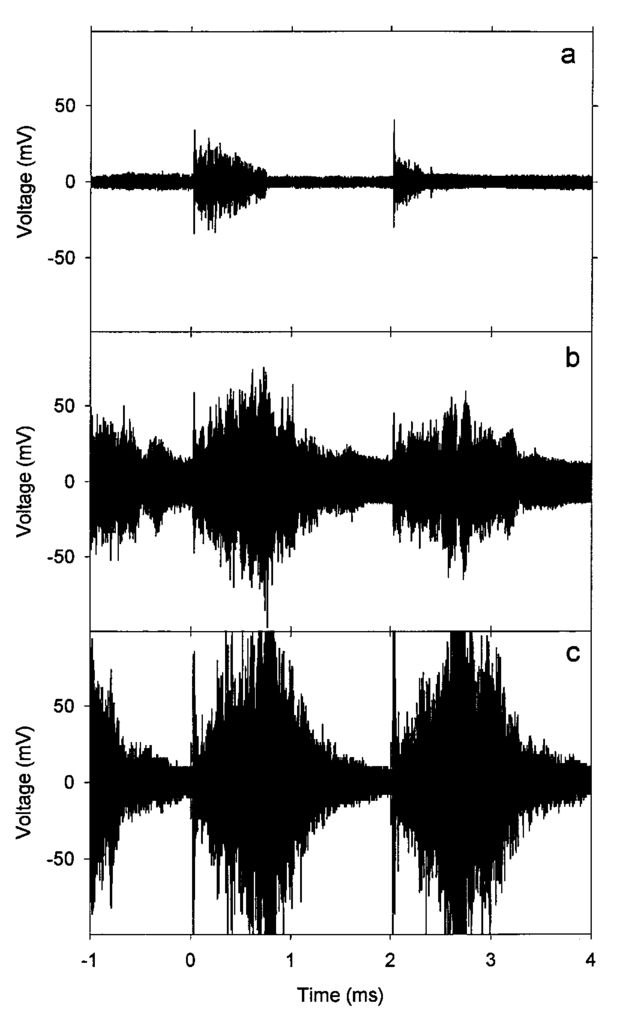 The percentage of cells lysed by the combined treatment increase dramatically with ultrasound amplitude as shown in Figure 5. The control results for ultrasound exposure without the laser, and for laser exposure without the ultrasound were not statistically distinguishable from the background-level hemolysis result without either treatment (i.e., sham exposure). An apparent threshold for the effect occurs at about 4.3 MPa (i.e., between the ineffective 3.3 and 5.3 MPa exposure which had statistically significant hemolysis at P<0.02, relative to the combined results of the three controls). Hemolysis approaches 100 at the highest pressure amplitude. For 7.4 MPa ultrasound exposure with the laser beam blocked, the hemolysis dropped to background levels, which demonstrates photodisruptive laser nucleation of ultrasonic cavitation. The USC emission initiated by PLN increases for a brief time course before declining to the background. At 7.4 MPa pressure amplitude the USC emissions lasted about 1 ms for a laser pulse repetition frequency (PRF) of 500 Hz. Results for variable laser PRF are shown in Figure 6. The hemolysis increases with increasing PRF, asymptotically approaching 100. At 1 KHz PRF, the USC would presumably be nearly continuous, since the 1 ms duration emissions would overlap. Figure 6Results for variable laser PRF for 7.4 MPa ultrasound. With the ultrasound off for 500 Hz PRF, the result declines to the background level without laser nucleation. 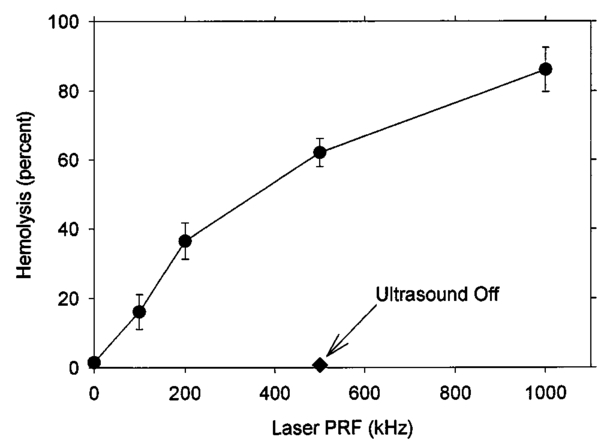 An important factor in PLN nucleation of USC should be the PLN bubble size and duration, which depends on the amount of absorbed laser energy. An experiment was conducted to determine the dependence of hemolysis on laser energy. This experiment employed burst mode ultrasound exposure to provide information on the nucleation process and the persistence of the nuclei. Since the focus is about 3.75 cm from the ultrasound transducer, an ultrasound burst triggered from the laser arrived about 25 μs after the PLN pulse (assuming 1500 m/s for the speed of sound), which separates the laser and ultrasound exposures. For random ultrasound burst generation, the PLN arrived during the ultrasound burst about 80 of the time. The results are shown in Figure 7 for triggered and random burst mode ultrasound at 7.4 MPa with 0.8 ms bursts and 1 kHz laser PRF. For each laser energy, the triggered mode produces much less hemolysis than the random mode, indicating a distinct advantage for simultaneous PLN and ultrasound exposure. Figure 7Hemolysis results for different laser pulse energies for 0.8 ms ultrasound bursts triggered by the laser (circles) or generated at random with respect to the laser pulses (squares). The laser PRF was 1 kHz, and the ultrasonic amplitude was 7.4 MPa. 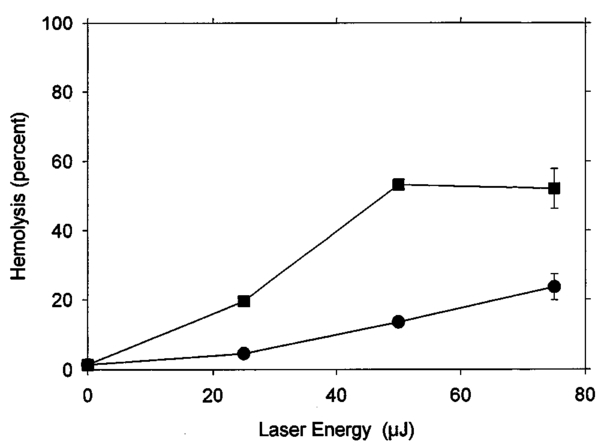 As noted above, the addition of the protein albumin to the medium seemed to regulate the nucleation process and provide more consistent PLN emissions. A test was conducted to determine the influence this factor might have on observed hemolysis. The results for random and triggered burst mode ultrasound with and without added albumin is shown in Figure 8 for the intermediate 50 μJ laser energy. The increase in hemolysis with added protein is particularly large for the triggered ultrasound bursts, indicating that the albumin-stabilized bubbles persisted until the ultrasound burst arrived. 4.DiscussionThe PLN emission signals, though not faithful representations of the acoustic waves, provide useful information about the consistency of PLN. In PBS, the signals are variable as shown in Figure 3. The amplitude and duration of the emission from each laser pulse likely reflects the size and persistence of the PLN bubble, with the initial pulse due to the PLN, and the final pulse due to collapse of the bubble.14 The periods between pulses for the wave forms shown in Figures 3(a), 3(b), and 3(c) are about 8.2, 12.7, and 15.6 μs, respectively. The maximum radius Rm may be estimated from the Rayleigh formula In this equation, the period between emission pulses is 2Tc, the density ρo=103 kg m −3 , ambient pressure po=105 Pa, and vapor pressure pv=2.3×10³ Pa. The maximum radii corresponding to the periods noted above are 44.6, 69, and 84.8 μm. This bubble-size variation may be due to bubble interactions, such as photodisruption near the previous bubble, bubble coalescence, or other microscopic conditions. Another source of variability is the statistical nature of optical breakdown at pulse widths above approximately 1 ps.13 14 One may expect that the same experiment performed with fs pulses of the same energy would result in markedly reduced radii and emission intervals. Addition of protein in the form of 5 BSA appears to regulate this signal, and to maximize it [see Figure 3(d)]. It seems likely that the relatively large albumin molecules serve to seed the optical breakdown process. The period for this wave form is about 20.8 μs, which implies a maximum radius of 113 μm according to Eq. (1).When the PLN occurred with ultrasound, the observed emissions include emissions from cavitation activity. The persistence of the PLN bubble until the ultrasonic wave arrived was important for the nucleation. The calculated PLN bubble durations were less than the 25 μs delay before the ultrasound arrived. A small gas bubble is expected to persist after the collapse,25 which likely was involved in the nucleation of ultrasonic cavitation. These emissions were in the form of a burst of variable duration (see Figure 4). The finite duration for this cavitation burst is consistent with other observations of cavitation in focused ultrasonic fields.26 The self-limiting bursts of cavitation in a focused field was first noted by Willard,27 and the bursts have been called “Willard events.” With combined PLN and ultrasound, hemolysis was greatly enhanced to 62.2, for 7.4 MPa ultrasound. The controls (combined results of sham, no-laser or no-ultrasound controls, which were statistically indistinguishable) had a background hemolysis of 1.4. This represents a nominal enhancement ratio of 44. However, this represents a minimum enhancement ratio since the background hemolysis of 1.4 (0.5 standard error) was a property of the cell suspension. The laser photodisruption produced lysis by itself: if the flow was stopped with the ultrasound off but laser on, the suspension gradually cleared, which indicated hemolysis. The percentage of laser-induced hemolysis in the flowing medium can be estimated by assuming the cells within the PLN bubble volume are lysed and calculating the fraction of the flow-through chamber occupied by the PLN bubbles. Due to the slow flow, the bubbles volumes would overlap along the flow, and presumably hemolyse all cells within that cylinder. The percentage of the PLN area, about 3×10⁻⁴ cm 2 (for 100 μm radius), within the area of the chamber, about 0.48 cm2, is 0.06. Hemolysis this small would not be detectable above the background, as noted in the experimental results. This estimate implies an enhancement of about 1000-fold (0.06 compared to 62) when ultrasound and laser are simultaneously applied. The combined bioeffect appeared to be a nearly all-or-none event dependent on photodisruptive laser nucleation of the ultrasonic cavitation. The ultrasonic threshold for PLN nucleation in this system was about 4.3 MPa (see Figure 5), which is well below the normally expected threshold in vivo.6 No threshold was evident in our data for the laser energy to produce PLN, but the hemolysis decreased with decreasing pulse energy, and a threshold presumably would exist at the photodisruption threshold. Hemolysis measurements were made in increments of 25 μJ, starting at zero pulse energy. Determination of the approximate breakdown threshold in PBS was performed by observing the plasma spark through the low power microscope integrated into the delivery system, and yielded a value of 18 μJ, consistent with our results. Increasing the laser PRF from a low value resulted in hemolysis increasing asymptotically toward 100 (see Figure 6). This behavior is expected from the exposure characteristics and flow rate. The hemolysis effect would presumably occur within the ultrasonic focus, which occupied only about 3 of the chamber volume (based on the half-power dimensions). Many cavitation bursts would be needed to approach 100 lysis, even if the cavitation bursts generated some mixing. Since the flow rate of 2.1 mL/min would only refill the chamber every few seconds, the laser PRF would provide the needed number of bursts. The regular asymptotic shape of the curve traced by the data in Figure 6 indicate a simple addition of the effects of each burst delivered per volume of suspension, with no extra nucleation caused, for example, by recirculation of cavitation-associated bubbles. This feature indicates an important degree of controllability for USC nucleated by PLN. The addition of albumin regulated the cavitation nucleation process, giving more consistent emission and larger hemolytic yields. Again, this likely results from stabilization of the PLN bubble, which renders it better suited for cavitation nucleation. For example, albumin stabilizes bubbles in the ultrasound contrast agent Albunex, which also serves as a cavitation nucleation agent.28 The ultrasonic nucleation entity appeared to be unstable and often disappeared within the approximate 25 μs delay before ultrasound exposure in the triggered burst mode compared to random bursts (see Figure 8). When albumin was added, the differential was eliminated between triggered and random bursts, and both results were increased, probably due to the longer persistence of the PLN bubble. 5.ConclusionThe hypothesis that photodisruptive laser nucleation of bubbles could be utilized for subsequent nucleation of ultrasonic cavitation was confirmed. The combined PLN and ultrasound produced USC emissions and resulted in large hemolytic effects, while laser or ultrasound exposure alone did not significantly increase free hemoglobin above the sham level. The presence of albumin regulated the process and enhanced the effects, which is a feature of the results favorable to the utilization of this process under in vivo conditions (when serum and protein are always present). AcknowledgmentsThe authors thank Robert Greco, Unit for Laboratory Animal Medicine, for drawing the canine blood samples. This research was supported by PHS Grant No. CA42947 (D. L. Miller, PI) awarded by the National Institutes of Health, DHHS), NSF STC Grant No. 8920108 through the Center for Ultrafast Optical Science, and by the Center for Biomedical Engineering Research (G.J.R.S., PI) of the University of Michigan. REFERENCES
D. L. Miller
and
A. R. Williams
,
“Nucleation and evolution of ultrasonic cavitation in a rotating exposure chamber,”
J. Ultrasound Med. , 11 407
–412
(1992). Google Scholar
N. Lawrence
and
W. P. Coleman
,
“The biologic basis of ultrasonic liposuction,”
Dermatol. Surg. , 23 1197
–1200
(1997). Google Scholar
A. Holst
,
W. Rolfsen
,
B. Svensson
,
K. Ollinger
, and
B. Lundgren
,
“Formation of free radicals during phacoemulsification,”
Curr. Eye Res. , 12 359
–365
(1993). Google Scholar
K. Jochle
,
J. Debus
,
W. J. Lorenz
, and
P. Huber
,
“A new method of quantitative cavitation assessment in the field of a lithotripter,”
Ultrasound Med. Biol. , 22 329
–338
(1996). Google Scholar
K. Hynynen
,
“The threshold for thermally significant cavitation in dog’s thigh muscle in vivo,”
Ultrasound Med. Biol. , 17 157
–165
(1991). Google Scholar
D. L. Miller
,
A. R. Williams
,
J. E. Morris
, and
W. B. Chrisler
,
“Sonoporation of erythrocytes by lithotripter shockwaves in vitro,”
Ultrasonics , 36 947
–952
(1998). Google Scholar
F. Prat
,
J. Y. Chapelon
,
F. A. El Fadil
,
T. Theillere
,
T. Ponchon
, and
D. Cathignol
,
“In vivo effects of cavitation alone or in combination with chemotherapy in a peritoneal carcinomatosis in the rat,”
Br. J. Cancer , 68 13
–17
(1993). Google Scholar
S. Bao
,
B. D. Thrall
,
R. A. Gies
, and
D. L. Miller
,
“In vivo transfection of melanoma cells by lithotripter shock waves,”
Cancer Res. , 58 219
–221
(1998). Google Scholar
A. A. Brayman
,
M. Azadniv
,
C. Cox
, and
M. W. Miller
,
“Hemolysis of Albunex-supplemented 40 hematocrit human erythrocytes in vitro by 1 MHz pulsed ultrasound: acoustic pressure and pulse length dependence,”
Ultrasound Med. Biol. , 22 927
–938
(1996). Google Scholar
D. L. Miller
,
R. A. Gies
, and
W. B. Chrisler
,
“Ultrasonically induced hemolysis at high cell and gas body concentrations in a thin-disc exposure chamber,”
Ultrasound Med. Biol. , 23 625
–633
(1997). Google Scholar
D. L. Miller
,
O. D. Kripfgans
,
J. B. Fowlkes
, and
P. L. Carson
,
“Cavitation nucleation agents for nonthermal ultrasound therapy,”
J. Acoust. Soc. Am. , 107 3480
–3486
(2000). Google Scholar
T. Juhasz
,
G. A. Kastis
,
C. Suarez
,
Z. Bor
, and
W. E. Bron
,
“Time-resolved observations of shock waves and cavitation bubbles generated by femtosecond laser pulses in corneal tissue and water,”
Lasers Surg. Med. , 19 23
–31
(1996). Google Scholar
J. Noack
,
D. X. Hammer
,
G. D. Noojin
,
B. A. Rockwell
, and
A. Vogel
,
“Influence of pulse duration on mechanical effects after laser-induced breakdown in water,”
J. Appl. Phys. , 83 7488
–7495
(1998). Google Scholar
W. Lauterborn
and
K. Ebeling
,
“High-speed holography of laser induced breakdown in liquids,”
Appl. Phys. Lett. , 31 663
–664
(1977). Google Scholar
A. Vogel
,
S. Busch
, and
U. Parlitz
,
“Shock wave emission and cavitation bubble generation by picosecond and nanosecond optical breakdown in water,”
J. Acoust. Soc. Am. , 100 148
–165
(1996). Google Scholar
B. D. Zelickson
,
D. A. Mehregan
,
A. A. Zarrin
,
C. Coles
,
P. Hartwig
,
S. Olson
, and
J. Leaf-Davis
,
“Clinical, histologic and ultrastructural evacuation of tattoos treated with three laser systems,”
Lasers Surg. Med. , 15 364
–372
(1994). Google Scholar
C. Dierickx
,
M. B. Alora
, and
J. S. Dover
,
“A clinical overview of hair removal using lasers and light sources,”
Dermatol. Clin. , 17 357
–366
(1999). Google Scholar
J. P. Fischer
,
J. Dams
,
M. H. Gotz
,
E. Kerker
,
F. H. Loesel
,
C. J. Messer
,
M. H. Miemz
,
N. Suhm
, and
J. F. Bille
,
“Plasma-mediated ablation of brain tissue with picosecond laser pulses,”
Appl. Phys. B: Lasers Opt. , B58 493
–499
(1994). Google Scholar
J. F. Bille
,
W. Schlegel
, and
V. Sturm
,
“Stereotaktische Laser-Neurochirurgie,”
Phys Unserer Zeit , 24 280
–286
(1993). Google Scholar
F. H. Loesel
,
M. H. Niemz
,
J. F. Bille
, and
T. Juhasz
,
“Laser-induced optical breakdown on hard and soft tissue and its dependence of the pulse duration: Experiment and model,”
IEEE J. Quantum Electron. , 32 1717
–1722
(1996). Google Scholar
Z. S. Sacks
,
G. J. R. Spooner
,
R. M. Kurtz
,
T. Juhasz
, and
G. Mourou
,
“Subsurface photodisruption in scattering biological tissues,” in,”
Proc. SPIE , 4162 20
–29
(2000). Google Scholar
C. C. Church
,
“A theoretical study of cavitation generated by an extracorporeal shock wave lithotripter,”
J. Acoust. Soc. Am. , 86 215
–227
(1989). Google Scholar
E. A. Neppiras
,
“Acoustic cavitation,”
Phys. Rep. , 61 159
–251
(1980). Google Scholar
G. W. Willard
,
“Ultrasonically induced cavitation in water: a step-by-step process,”
J. Acoust. Soc. Am. , 25 669
–686
(1953). Google Scholar
D. L. Miller
and
R. M. Thomas
,
“Ultrasound contrast agents nucleate inertial cavitation in vitro,”
Ultrasound Med. Biol. , 21 1059
–1065
(1995). Google Scholar
|
||||||||||||||||||||||||||||||


CITATIONS
Cited by 9 scholarly publications and 1 patent.
Ultrasonography
Cavitation
Ultrasonics
Pulsed laser operation
Laser energy
Laser damage threshold
Blood


