
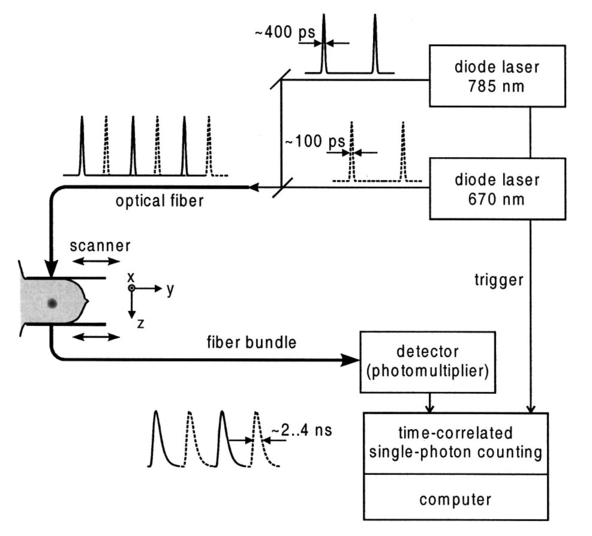
1.IntroductionSpectral imaging techniques using visible and near-infrared radiation have been investigated for their potential to detect abnormal regions (lesions) deeply embedded within normal tissue. If successful, these techniques offer a variety of functional imaging modalities in addition to density imaging, while they avoid ionizing radiation hazards. One of the most challenging areas in which to apply diffuse optical imaging of deep tissue is the human female breast.1 2 3 4 5 6 It is clear that any new imaging or spectroscopic modalities which can improve diagnostics of breast tumors or can add new knowledge about the physiological properties of the tumors and surrounding tissue will have significance in medicine. Conventional transillumination using continuous wave (cw) light was used for breast screening several decades ago. However, because of the high amount of scattering of tissue, this method resulted in poor resolution.7 8 In the late 1980s, time-resolved imaging techniques were proposed to enhance the spatial resolution by detecting photons with very short time of flight within the tissue.9 10 11 12 13 In this technique a short laser pulse impinges upon the tissue. The photons transmitted experience dispersion in their pathlengths, resulting in temporal dispersion of their time of flight (TOF). To evaluate the performance of such time-resolved transillumination techniques, we used random walk theory (RWT) on a lattice. Many physical and biological media are characterized by elements of randomness in both space and time. The diffusion of light in highly turbid media such as tissue falls into this category. RWT is a powerful mathematical method by which to describe such stochastic processes. Details of the mathematical construct of RWT are presented elsewhere.14 Our evaluation of time-resolved imaging showed that the strong scattering property of tissue prevents high-quality imaging of abnormalities.15 Hence, devising theoretical constructs to separate the effects of scattering from absorption was proposed. This would allow one to map the optical coefficients as spectroscopic signatures of an abnormal tissue embedded in thick, otherwise normal, tissue. With this approach, accurate quantification of the size and optical properties of the target becomes a critical requirement for the use of optical imaging at the bedside. To relate the light intensity to the size, optical properties, and location of abnormal targets in the tissue, we have taken advantage of some features of our theoretical framework. The early time response is most dependent on scattering perturbations, whereas late time behavior is most dependent on absorptive perturbations, thus allowing one to separate the influence of scattering and absorption perturbations on the observed image contrast. Our analysis differs from previous work based on perturbation theory applied to the diffusion approximation of the transport equation, because we model increased scattering in the abnormal target as a time delay. The second interesting feature of our methodology is that the contrast from scattering inside the inclusion is proportional to the cross section of the target (in the z direction),16 17 instead of depending on the target’s volume as modeled in a perturbation analysis (see, e.g., Ref. 18). Several research groups intend to implement their theoretical expressions in a general inverse algorithm for optical tomography, i.e., to reconstruct three-dimensional maps of spatial distributions of the tissue’s optical characteristics19 20 21 22 23 24 25 26 27 and thereby quantify optical characteristics, positions, and sizes of abnormalities. Unlike these approaches our method is a multistep analysis of the collected data. From images observed at different times of flight, we construct the time-dependent contrast functions, fit our theoretical expressions to experimental data, and compute the optical properties of the background and those of the abnormality along with its size. A more detailed outline of our data analysis was published earlier.16 17 By utilizing our method for different wavelengths, one can obtain diagnostic information (for example, estimates of blood oxygenation inside a tumor) from corresponding absorption coefficients that cannot be obtained directly from other imaging techniques. An alternative theoretical model, applied recently to analysis of time-resolved optical data,6 is based on formulas for the Fourier amplitude of the photon density which were obtained from the diffusion model for the case of a spherical inhomogeneity inside an infinite turbid medium.28 Several research groups have already successfully used multiwavelength measurements, using frequency-domain techniques, to calculate physiological parameters (oxygenation, lipid, and water content) of breast tumors (diagnosed with other modalities) and normal tissue (e.g., see, Refs. 29 30 31). We have verified our methodology by applying it to two transillumination and fan geometry data sets provided by collaborators at University College, London. The data were obtained from an experimental phantom that had optical properties, thickness, and characteristics of the embedded, relatively small, abnormal target that were similar to those measured in a human breast.32 For both data sets, our approach yields values for the inclusion optical parameters that are close to the nominal ones, and provides reasonable estimates of the inclusion’s position and size.17 33 To improve the performance of our algorithm, we have extended our analysis to nonlocalized abnormalities and successfully applied the RWT approach to quantification of the optical characteristics and dimensions of larger inclusions (with increased scattering and/or absorption) that were realized in the tissue-like phantoms of our collaborators at Politecnico di Milano.16 An important point in our theoretical construct is the assumption of quadratic dependence of the scattering contrast amplitude on the size of the inclusion. Analysis16 of time-resolved contrast functions obtained from experiments18 for three similar, purely scattering inclusions that differ only in size provided strong support for such a relationship. Having successfully analyzed several independent phantom data sets, we demonstrated the robustness of our algorithm and have shown that the accuracy of our model does not depend on any particular experimental design. The next important step in the development of our RWT-based tissue quantification methodology is an analysis of real clinical data with tumors embedded inside normal tissue. This article is organized as follows. In Sec. 2 we present the theoretical model used to analyze time-resolved experimental data for tissue-like turbid media. In Sec. 3 an experimental setup for in vivo transillumination breast measurements, using an optical mammograph of the Physikalisch-Technische Bundesanstalt (PTB), is briefly described. Analysis of the time-resolved data within our theoretical framework for two patients with breast tumors is presented in the Sec. 4. Estimates of the optical characteristics of the tumors and surrounding tissue are provided. Section 5 contains a summary and a short discussion of future directions. 2.Theoretical ModelRandom walk theory of photon migration in a turbid medium is based on two assumptions: the tissue continuum is replaced by a cubic lattice with a step size inversely proportional to the scattering coefficient, and photons can move isotropically between adjacent lattice points. Relationships between dimensionless RWT parameters and the corresponding physical variables, necessary to analyze experimental data, are well established (see, Ref. 14): where μs (0)′ is the transport-corrected background scattering coefficient (μs (0)′=μs (0)(1−g) and g is the scatter anisotropy factor), μa (0) is the background absorption coefficient, c is the speed of light in the medium (mm/ps), Δt is the photon time delay (ps), r¯ is the distance variable (mm), d is the lateral displacement between the source and the detector (mm), and T is the thickness of the slab (mm).Our analysis of breast transillumination data used a model-based calculation of intensity and the point spread function (PSF) of migrating photons visiting different sites at different planes inside a finite slab. The intensity, pn, is defined as the probability that a photon inserted into the tissue at site r 0 =(0,0,0) is detected on its nth step (i.e., a given time) at the point of exit r=(x,0,N): 34 The PSF, Wn, is defined as the probability that a photon inserted into the tissue visits a given site s=(s1,0,s3) and is detected afterward on its nth step:15 35 where andIt is worth noting that analysis of experimental data on edge response functions for a number of tissue-like phantoms substantiates the RWT formulas for the widths of the time-resolved PSFs which correspond to spatial resolution.15 36 37 38 To simplify the notations in all further equations we omit the dependencies of pn and Wn on the coordinates of the points of photon insertion and exit. This is justified since the relative positions of the source and detector are the same during scanning, and the tissue slab is assumed to be quasiuniform, except for an abnormality. To deduce the optical properties of the background “normal” tissue we simply use sets of functions pn. 15 16 In the next step, comparison of the time-dependent contrast observed in time-resolved transillumination experiments and predictions of RWT, using the sets of functions pn and Wn gives an estimate of the size and optical properties of the target.15 16 Within the random walk model framework, for a relatively small (size di≪T, where T is the slab thickness), abnormally absorbing inclusion we represent the inclusion by a set of Na 3 independent absorbers located on a cubic lattice with spacing 16 17 RWT formulas for the absorptive component of time-resolved contrast, i.e., the relative perturbation in intensity detected due to an absorbing inclusion are as follows: where x¯ is a shift of the source–detector axis relative to the center of inclusion, z¯ is a depth of the inclusion, n=μs (0)′cΔt is the number of steps corresponding to the time delay Δt and η eff is the effective absorptivity of an elementary absorber given by where Δμa=μa−μa (0) is the absorption perturbation inside the inclusion with respect to the background. The exponential factor introduced on the right-hand side of the equation for η eff is important when there is considerable additional absorption in the inclusion that reduces the effective photon intensity inside the inclusion compared to the unperturbed “zero” value of the intensity.Taking into account that and di 2=V2/3, where V is the inclusion volume for small inclusions with small but nonzero Δμa (i.e., τ=ΔμaV2/3μs (0)′/2⩽1) we obtain The exponential correction factor for nonlocalized absorptive inclusions was recently verified by a set of Monte Carlo simulations and phantom measurements of the mean time spent by photons inside an inclusion (Δt). 39Increased scattering inside an inclusion results in an additional time delay,16 17 so, for a purely scattering inclusion the contrast is given by Csc(x¯,z¯,Δt) depends linearly on the slope of the PSF [i.e., the time derivative W˜(x¯,z¯,Δt)] of the PSF. Hence, as has been shown theoretically,16 17 the largest contrast Csc(x¯,z¯,Δt) corresponds to the smallest available time delays Δt, where even a small increase in the delay Δt has a considerable effect on the number of photons detected. On the other hand, for Δt>Δt max [Δt max corresponds to the maximum value (over time) of the amplitude of the spatial PSF], the contribution by Csc(x¯,z¯,Δt) is negligible (this latter part of the data is used to estimate the perturbation due to a change in absorption).3.Experimental SetupRecently a scanning laser pulse mammograph6 has been developed at the Physikalisch-Technische-Bundesanstalt in Berlin (see Figure 1) and set up at the Robert Roessle Hospital to record time-resolved optical mammograms of patients. The breast is slightly compressed between two glass plates. A scan of the whole breast in a step size of 2.5 mm takes only a few minutes, and can be done in mediolateral as well as in craniocaudal projections. Collinear geometry of a source–detector pair was realized in the measurements. Our first goal was to quantify the optical parameters at two wavelengths and thereby estimate blood oxygen saturation of the tumor and surrounding tissue under the assumption that the principal chromophores that contribute to absorption are oxy- and deoxyhemoglobin and water.40 41 It should be mentioned that recent experimental data42 43 provide evidence of a non-negligible contribution by lipids in breast tissue absorption of near-infrared light, especially for older women (the lipid component of the breast tissue increases with age). However, in the current analysis (with data available at only two wavelengths) it is impossible to properly take into account the variation in lipid absorption. We analyzed the data sets, obtained at two wavelengths (670 and 785 nm) for two patients (No. 9, age 57 and No. 11, age 84) with invasive ductal carcinoma. In the first case (patient No. 9, the thickness of the slightly compressed breast was T=71 mm), 1980 time-resolved intensity distributions were measured at each wavelength. For the second patient (patient No. 11, the thickness of the slightly compressed breast was T=82 mm) 1216 time-resolved intensity distributions at each wavelength were recorded. The data collection times amounted to 5 min (patient No. 11) and 8 min (patient No. 9). Both tumors can easily be seen in the corresponding optical images shown in Figures 2(a) and 2(b). These images were obtained from reciprocal values of the total integrals of the distributions of the photon’s time of flight, normalized to a selected “bulk” area, as described in Ref. 6. The centers of the tumors are located at x=−20 mm, y=20 mm and x=−50 mm, y=2.5 mm, respectively. The dimensions of the tumors estimated from histology after subsequent surgery were 40 mm × 35 mm × 30 mm (patient No. 9) and 25 mm × 15 mm × 15 mm (patient No. 11). 4.Data AnalysisCollected in vivo data were processed in three stages. First of all, due to the relatively long duration of the laser pulse (∼400 ps at 785 nm) and due to dispersion in the detection fiber bundle the time response function of the device is relatively broad, and the raw intensity TOF distributions should be deconvolved. This procedure is especially important for estimates of the scattering coefficients since they are very sensitive to the short time delay data where, on the steeply rising part of the time-of-flight distributions, relatively large experimental errors due to noise are present. To reduce the influence of this high frequency noise, we have used a low-pass filtering. The filter was constructed from a comparison of the spectrum of the raw data with the expected frequency dependence of the signal spectrum (assuming random walk or diffusion formulas). As an example, a comparison of the time-resolved data with the filtered and deconvolved TOF distribution is presented in Figure 3(a) for one of the 1216 source–detector axis positions (patient No. 11, λ=670 nm). Figure 3Data processing of typical time-resolved intensity distributions. (a) Deconvolution of raw time resolved data (patient No. 11, λ=670 nm, scan position x=−1.0 cm, y=0.5 cm). (b) Curve fitting of the deconvolved distribution (values μs ′=1.06 mm −1 and μa=0.0024 mm −1 obtained). 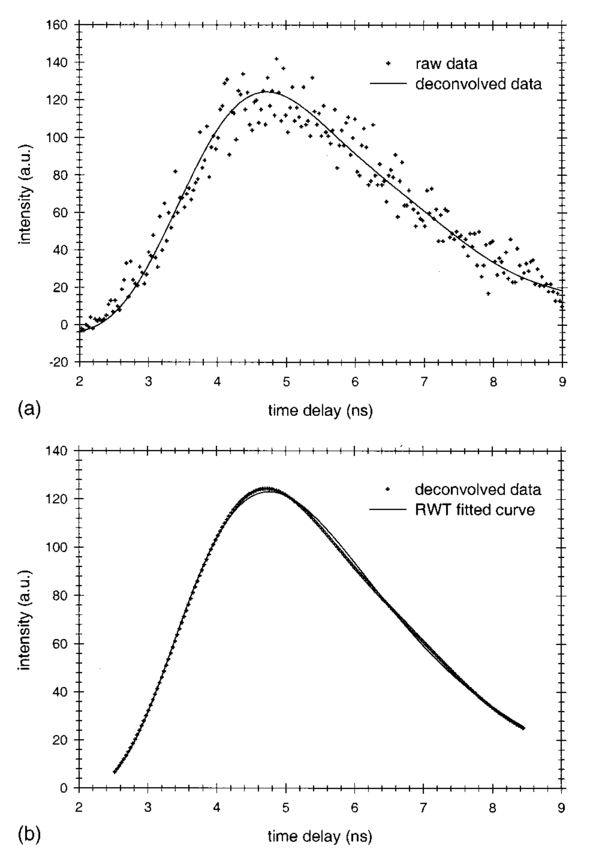 Then curve fitting, based on the Levenberg–Marquardt algorithm,44 was used to approximate the deconvolved curves with the RWT pathlength distributions in uniform turbid media [Eq. (2)]. Scattering and absorption coefficients of the media, the amplitude scale, and time zero (origin of the time axis) were used as fitting parameters. The curve fit for the example of Figure 3(a) (patient No. 11, λ=670 nm) is shown in Figure 3(b). In this article we do not discuss corrections that may be required to take into account a so-called “edge effect” due the decreasing thickness of the compressed breast close to its edges. Several recipes to calculate these corrections were suggested in the literature.5 6 Both tumors analyzed here, however, happened to fall into the regions of the two-dimensional (2D) scans, in which the breast tissue filled the entire space between the glass plates. The background optical properties of breast tissue and the time-zero offset were estimated by averaging optical coefficients over more than 100 source–detector positions. In the next step, a 2D set of time-resolved contrast functions was constructed using measured intensity distributions corrected in the manner described above. The maximum contrast spot was assumed to be the center of the abnormality. The shorter time delays provided slightly better spatial resolution. Similar estimates of the tumor center position can be obtained from the integral optical images, presented in Figures 2(a) and 2(b). Two linear contrast scans, both passing through the center of the abnormality, were calculated for different time delays. This procedure has also been described previously.16 Curve fitting of these functions with the theoretical formula for absorptive contrast [Eq. (6)] has been used to smooth the curves, calculate the absorptive component of the contrast, and estimate the lateral size of the inclusion. The results of the curve fitting are illustrated in Figure 4, which contains one of the x-direction linear scans of patient No. 11. Figure 4Contrast scan along the x axis through the center of the tumor [time of flight Δt=5 ns, patient No. 11; see Eq. (6)].  The important point is that the current optical mammograph used in this set of measurements does not permit a unique estimate of the depth of the abnormality. Independent scans with different relative source–detector positions that involve oblique angle source–detector geometry are needed to overcome this limitation.6 17 Some preliminary experimental results show that these additional scans do provide information on the abnormality’s depth.6 However, to estimate the optical parameters and size of the inclusion from the data available, an additional assumption about the depth of the abnormality must be made. We assume here that the depth of the tumor is z¯=18 mm for patient No. 11 (this assumption is substantiated by the histology findings) and z¯=53 mm for patient No. 9 (i.e., the tumor is close to the lower surface of the breast judging from the additional line scans with lateral offsets between the source and detector). In both cases use of the assumed values for z¯ results in reasonable estimates of the tumor optical parameters (see below). For both patients at both the wavelengths considered the contrast amplitude decreases with an increase in the time delay, indicating that the tumors show a higher amount of scattering compared to surrounding tissue. To estimate the time delay Δτ inside the abnormality and the corresponding scattering perturbation Δμs ′ from Eq. (7), we determined the dependency of the contrast amplitude on the time derivative of the PSF. For calculation of these derivatives the time-zero offset that was obtained from analysis of the background optical properties described above was used. This correction does not noticeably change the results for the tumor absorption coefficient which is determined by contrast functions for relatively large time delays. Scattering perturbations, which are determined from the short time delay data, are expected to be sensitive to the choice of time zero, and this was found to be the case. In all cases considered the relationship between contrast amplitude and the PSF derivative proved to be close to linear for Δt<Δt max which is in agreement with Eq. (8). This is illustrated in Figures 5 and 6 for the data obtained from patient Nos. 9 and 11, respectively. In Figure 5, the relationship between the contrast amplitude and the PSF derivative is presented for λ=670 and 785 nm. The smaller slope for the infrared data, compared to the red data, implies less scattering perturbation at the longer wavelength. Figure 6 shows the variation of the average slope with assumed inclusion depth, z¯, for λ=670 nm. The slope, and hence the corresponding estimate of the scattering perturbation, is not very sensitive to the estimate of z¯ (variation of z¯ in the range of 15–20 mm results in a change of the slope between ±15 relative to its mean value). Figure 5Dependence of tumor contrast (patient No. 9) on the derivative of PSF for λ=670 and 785 nm [see Eq. (8)]. 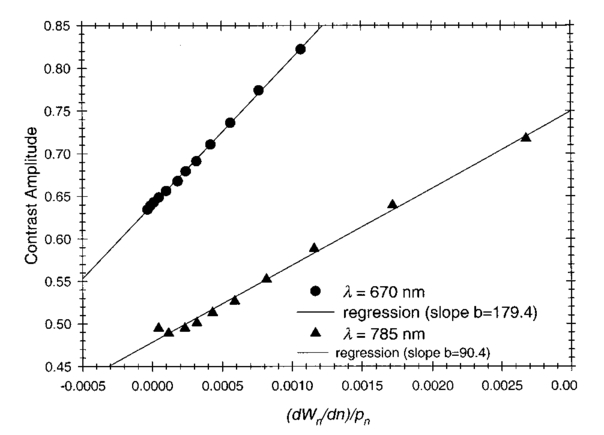 Figure 6Dependence of tumor contrast (patient No. 11) on the derivative of PSF for assumed tumor depths of z¯=15, 18, 20 mm (λ=670 nm).  The calculated average slopes of the contrast amplitude as a function of the PSF derivative, in combination with estimated or assumed dimensions of the tumor, are used to evaluate the scattering perturbation, due to the tumor, according to Eqs. (7) and (8). Comparison of the time-resolved contrast amplitudes for relatively large time delays Δt>Δt max with theoretical expression (6) provides an estimate of the magnitude of absorptive perturbation. Estimated optical parameters of the tumor and the background tissue are summarized in Tables 1 and 2 for patient Nos. 9 and 11, respectively. Two major problems were encountered during our analysis of these experimental data. Because of the large thickness of the breast of patient No. 11, the trailing edges of the time-of-flight distributions were not completely recorded at λ=785 nm, and the results obtained by the data analysis described above were less accurate than for the three other cases (patient No. 11, λ=670 nm and patient No. 9, both wavelengths). Furthermore, from the short time delay data of patient No. 9 in contrast to those of patient No. 11 we were unable to estimate the size of the tumor, and an additional assumption that tumor size is di=26 mm was made. Table 1
Table 2
The next step after calculation of the optical parameters of the tumor and surrounding tissue at different wavelengths is evaluation of the blood oxygen saturation and relative blood volume in malignant and normal tissue, parameters that might be of some relevance for tumor diagnosis. This can be achieved using the absorption spectra of major chromophores (oxy- and deoxyhemoglobin45 and water46), known to be most important to absorption of red and infrared light in human tissue. As was mentioned in Sec. 3, a more strict analysis would require also taking into account the contribution of lipids in breast tissue absorption. Here ε HbO 2 and εHb are the molar extinction coefficients of oxy- and deoxyhemoglobin, c HbO 2 and c Hb are the corresponding concentrations, μaH 2 O is the absorption coefficient, and κ H 2 O is the volume fraction of water in the tissue; μa,lip is the absorption coefficient and κ lip the volume fraction of lipids in the tissue. The oxygen saturation S O 2 is given byIn order to estimate the oxygen saturation and relative blood volume from absorption coefficients determined at only two wavelengths, we have to assume the volume fraction, κ H 2 O , of water. For the sake of simplicity, we neglect here lipid absorption in our preliminary estimates since its likely contribution does not exceed the current uncertainty in the true volume fraction of water. Only by increasing the number of wavelengths used to ⩾4 can we really take into account the contribution of lipids, as well as that of water. Assuming for now κ H 2 O =30, we obtained our estimates of the tumor/tissue oxygenation as S O 2 (tumor)=0.60 (patient No. 9) and 0.47 (patient No. 11) and S O 2 (tissue)=0.67 (patient No. 9) and 0.61 (patient No. 11). It follows that both tumors are hypoxic. Whether this is generally true for the particular type of tumor (invasive ductal carcinoma) cannot be deduced because of the limited data presented here. Furthermore, in both tumors the relative blood volume was found to increase by about a factor of 2 in comparison with surrounding tissue, which can be explained by increased vascularization. 5.Summary and Future DirectionsFour sets of in vivo time-of-flight measurements (wavelengths of λ=670 and 785 nm) on two, tumor-bearing human female breasts were investigated using the random walk theoretical methodology previously substantiated by analysis of experimental data from several tissue-like phantoms. Assessment of the in vivo data, as expected, proved to be more challenging than the phantom data. Along with intrinsic complications, such as inhomogeneity of the normal and malignant breast tissue, edge effects (not considered here) due to the decrease in thickness of compressed breasts close to their edges and limited signal-to-noise ratios as well as the finite width of the instrumental response function of the clinical device have to be taken into account. To sum up the results of this investigation, the time-resolved contrast functions within the random walk framework were used to estimate in vivo optical parameters of the tumor and surrounding tissue for two patients with invasive ductal carcinoma at wavelengths of λ=670 and 785 nm for the first time. In one case we were able to also evaluate the dimensions of the tumor. Assuming a relative content of water in the tissue of 30, preliminary estimates of tumor/tissue oxygenation and the blood volume were made from these data which showed noticeable de-oxygenation of the tumors relative to the surrounding tissue, combined with a higher volume of blood. As mentioned above, in the case of patient No. 11 the results are less reliable due to insufficient raw data. The results reported encouraged us to continue analysis of actual time-resolved measurements of the human breast using our quantitative method to assess its capability to detect tumors and/or to provide spectroscopically identifiable physiological parameters (e.g., oxygenation, density, or water content) of tumors detected by other imaging modalities, particularly for treatment monitoring in clinical trials. The optical mammograph used in this study does not allow one to record mammograms in fan geometry. Hence the depth of the abnormality cannot be estimated from the data and has to be assumed a priori or taken from other (surgical) information. An upgraded version of the optical mammograph will enable records of optical mammograms in fan geometry and at three or more wavelengths to provide sufficient information for tumor localization and spectroscopy. REFERENCES
A. Alveryd
et al.;,
“Lightscanning versus mammography for the detection of breast cancer in screening and clinical practice,”
Cancer , 65 1671
–1677
(1990). Google Scholar
S. Nioka
,
M. Miwa
,
S. Orel
,
M. Schnall
,
M. Haida
,
S. Zhao
, and
B. Chance
,
“Optical imaging of human breast cancer,”
Adv. Exp. Med. Biol. , 361 171
–179
(1994). Google Scholar
T. L. Troy
,
D. L. Page
, and
E. Sevick-Muraca
,
“Optical properties of normal and diseased breast tissues: Prognosis for optical mammography,”
J. Biomed. Opt. , 1 342
–355
(1996). Google Scholar
J. C. Hebden
,
S. R. Arridge
, and
D. T. Delpy
,
“Optical imaging in medicine I. Experimental techniques,”
Phys. Med. Biol. , 42 825
–840
(1997). Google Scholar
M. A. Franceschini
,
K. T. Moesta
,
S. Fantini
,
G. Gaida
,
E. Gratton
,
H. Jess
,
W. W. Mantulin
,
M. Seeber
,
P. M. Schlag
, and
M. Kaschke
,
“Frequency-domain techniques enhance optical mammography: Initial clinical results,”
Proc. Natl. Acad. Sci. U.S.A. , 94 6468
–6473
(1997). Google Scholar
D. Grosenick
,
H. Wabnitz
,
H. Rinneberg
,
K. Th. Moesta
, and
P. Schlag
,
“Development of a time-domain optical mammograph and first in vivo application,”
Appl. Opt. , 38 2927
–2943
(1999). Google Scholar
M. Cutler
,
“Transillumination as an aid in the diagnosis of breast lesions,”
Surg. Gynecol. Obstet. , 48 721
–728
(1929). Google Scholar
B. Monsees
,
J. Destouet
, and
D. Gersell
,
“Light scan evaluation of nonpalpable breast lesions,”
Radiology , 163 467
–470
(1987). Google Scholar
B. Chance
et al.;,
“Comparison of time-resolved and unresolved measurements of deoxyhemoglobin in brain,”
Proc. Natl. Acad. Sci. U.S.A. , 85 4971
–4975
(1988). Google Scholar
D. T. Delpy
,
M. Cope
,
P. van der Zee
,
S. Arridge
,
S. Wray
, and
L. Wyatt
,
“Estimation of optical pathlength through tissue from direct time of flight measurements,”
Phys. Med. Biol. , 33 1422
–1442
(1988). Google Scholar
M. Patterson
,
B. Chance
, and
B. C. Wilson
,
“Time resolved reflectance and transmittance for the non-invasive measurement of tissue optical properties,”
Appl. Opt. , 28 2331
–2336
(1989). Google Scholar
R. Nossal
,
R. F. Bonner
, and
G. H. Weiss
,
“Influence of pathlength on remote optical sensing of properties of biological tissues,”
Appl. Opt. , 28 2238
–2244
(1989). Google Scholar
D. A. Benaron
and
D. K. Stevenson
,
“Optical time-of-flight and absorbance imaging of biological media,”
Science , 253 769
–771
(1993). Google Scholar
A. H. Gandjbakhche
and
G. H. Weiss
,
“Random walk and diffusion-like models of photon migration in turbid media,”
Prog. Opt. , 34 333
(1995). Google Scholar
A. H. Gandjbakhche
,
R. Nossal
, and
R. F. Bonner
,
“Resolution limits for optical abnormalities deeply embedded in tissues,”
Med. Phys. , 21 185
–191
(1994). Google Scholar
V. Chernomordik
,
D. Hattery
,
A. Pifferi
,
P. Taroni
,
A. Torricelli
,
G. Valentini
,
R. Cubeddu
, and
A. H. Gandjbakhche
,
“A random walk methodology for quantification of the optical characteristics of abnormalities embedded within tissue-like phantoms,”
Opt. Lett. , 25 951
–953
(2000). Google Scholar
A. H. Gandjbakhche
,
V. Chernomordik
,
J. C. Hebden
, and
R. Nossal
,
“Time-dependent contrast functions for quantitative imaging in time-resolved transillumination experiments,”
Appl. Opt. , 37 1973
–1981
(1998). Google Scholar
M. Morin
,
S. Verreault
,
A. Mailloux
,
J. Frechette
,
S. Chatigny
,
Y. Painchaud
, and
P. Beaudry
,
“Inclusion characterization in a scattering slab with time-resolved transmittance measurements: Perturbation analysis,”
Appl. Opt. , 39 2840
–2852
(2000). Google Scholar
R. L. Barbour, H. L. Graber, Y. Wang, J.-H. Chang, and R. Aronson, “A perturbation approach for optical diffusion tomography using continuous-wave and time-resolved data,” in Medical Optical Tomography: Functional Imaging and Monitoring, G. Mueller, B. Chance, R. R. Alfano, S. R. Arridge, J. Beuthan, E. Gratton, M. Kaschke, B. R. Masters, S. Svanberg, and P. van der Zee, Eds., SPIE Institute Series Vol. IS11 (SPIE, Bellingham, WA, 1993), pp. 87–120.
M. A. O’Leary
,
D. A. Boas
,
B. Chance
, and
A. G. Yodh
,
“Experimental images of heterogeneous turbid media, by frequency-domain diffusing-photon tomography,”
Opt. Lett. , 20 426
–428
(1995). Google Scholar
H. B. Jiang
,
K. D. Paulsen
,
U. L. Osterberg
,
B. W. Pogue
, and
M. S. Patterson
,
“Optical image reconstruction using frequency-domain data: Simulations and experiments,”
J. Opt. Soc. Am. A , 13 253
–266
(1996). Google Scholar
E. B. de Haller
,
“Time-resolved transillumination and optical tomography,”
J. Biomed. Opt. , 1 7
–17
(1996). Google Scholar
T. O. McBride
,
B. W. Pogue
,
E. D. Gerety
,
S. B. Poplack
,
U. L. Osterberg
, and
K. D. Paulsen
,
“Spectroscopic diffuse optical tomography for the quantitative assessment of hemoglobin concentration and oxygen saturation in breast tissue,”
Appl. Opt. , 38 5480
–5490
(1999). Google Scholar
B. Chance
and
R. R. Alfano
,
“Optical tomography and spectroscopy of tissue: Theory, instrumentation, model, and human studies. II,”
Proc. SPIE , 2979 176
–283
(1997). Google Scholar
S. R. Arridge
and
J. C. Hebden
,
“Optical imaging in medicine. II. Modeling and reconstruction,”
Phys. Med. Biol. , 42 841
–854
(1997). Google Scholar
M. J. Eppstein
,
D. E. Dougherty
,
T. L. Troy
, and
E. Sevick-Muraca
,
“Biomedical optical tomography using dynamic parametrization and Bayesian conditioning on photon migration measurements,”
Appl. Opt. , 38 2138
–2150
(1999). Google Scholar
S. R. Arridge
,
“Optical tomography in medial imaging,”
Inverse Probl. , 15 R41
–R93
(1999). Google Scholar
D. A. Boas
,
M. A. O’Leary
,
B. Chance
, and
A. G. Yodh
,
“Scattering of diffuse photon waves by spherical inhomogeneities within turbid media: Analytic solution and applications,”
Proc. Natl. Acad. Sci. U.S.A. , 91 4887
–4891
(1994). Google Scholar
B. J. Tromberg
,
O. Coquoz
,
J. Fishkin
,
T. Pham
,
E. R. Anderson
,
J. Butler
,
M. Cahn
,
J. D. Gross
,
V. Venugopalan
, and
D. Pham
,
“Non-invasive measurements of breast tissue optical properties using frequency-domain photon migration,”
Philos. Trans. R. Soc. London, Ser. B , 352 661
–668
(1997). Google Scholar
B. J. Tromberg
,
N. Shah
,
R. Lanning
,
A. Cerussi
,
J. Espinoza
,
T. Pham
,
L. Svaasand
, and
J. Butler
,
“Non-invasive in vivo characterization of breast tumors using photon migration spectroscopy,”
Neoplasia , 2 26
–40
(2000). Google Scholar
S. Fantini
,
S. A. Walker
,
M. A. Franceschini
,
M. Kaschke
,
P. M. Schlag
, and
K. T. Moesta
,
“Assessment of the size, position, and optical properties of breast tumors in vivo by noninvasive optical methods,”
Appl. Opt. , 37 1982
–1989
(1998). Google Scholar
J. C. Hebden
,
D. J. Hall
,
M. Firbank
, and
D. T. Delpy
,
“Time-resolved optical imaging of a solid tissue-equivalent phantom,”
Appl. Opt. , 34 8038
–8047
(1995). Google Scholar
A. H. Gandjbakhche
,
G. H. Weiss
,
R. F. Bonner
, and
R. Nossal
,
“Photon pathlength distributions for transmission through optically turbid slabs,”
Phys. Rev. E , 48 810
–818
(1993). Google Scholar
A. H. Gandjbakhche
,
R. F. Bonner
,
R. Nossal
, and
G. H. Weiss
,
“Absorptivity contrast in transillumination imaging of tissue abnormalities,”
Appl. Opt. , 35 1767
–1774
(1996). Google Scholar
J. C. Hebden
and
A. H. Gandjbakhche
,
“Experimental validation of an elementary formula for estimating spatial resolution for optical transillumination imaging,”
Med. Phys. , 22 1271
–1272
(1995). Google Scholar
V. Chernomordik
,
A. H. Gandjbakhche
, and
R. Nossal
,
“Point spread functions of photons in time-resolved transillumination experiments using simple scaling arguments,”
Med. Phys. , 23 1857
–1861
(1996). Google Scholar
E. M. Sevick
,
B. Chance
,
J. Leigh
,
S. Nioka
, and
M. Maris
,
“Quantitation of time-resolved and frequency-resolved optical spectra for the determination of tissue oxygenation,”
Anal. Biochem. , 195 330
–351
(1991). Google Scholar
S. Zhou
,
Y. Chen
,
Q. Zou
,
S. Nioka
,
X. Li
,
L. Pfaff
,
C. M. Cowan
, and
B. Chance
, Proc. SPIE , 3597 571
–579
(1999). Google Scholar
R. Cubeddu
,
A. Pifferi
,
P. Taroni
,
A. Torricelli
, and
G. Valentini
,
“Noninvasive absorption and scattering spectroscopy of bulk diffusive media: An application to the optical characterization of human breast,”
Appl. Phys. Lett. , 74 874
–876
(1999). Google Scholar
R. Cubeddu
,
C. D’Andrea
,
A. Pifferi
,
P. Taroni
,
A. Torricelli
, and
G. Valentini
,
“Effects of the menstrual cycle on the red and near-infrared optical properties of the human breast,”
Photochem. Photobiol. , 72 383
–391
(2000). Google Scholar
G. M. Hale
and
M. R. Querry
,
“Optical constants of water in the 200-nm to 200-μm wavelength region,”
Appl. Opt. , 12 555
–563
(1973). Google Scholar
|
||||||||||||||||||||||||||||||||||||


CITATIONS
Cited by 51 scholarly publications.
Tumors
Tissue optics
Breast
Absorption
Scattering
Optical properties
Photons


