1.IntroductionOptical spectroscopic and imaging techniques have the potential to provide cost-effective approaches for noninvasive real time detection of pre-cancers in epithelial tissues of many organ sites. For example, the promise of fluorescence spectroscopy in vivo has been demonstrated in the cervix,1 oral cavity,2 3 and esophagus,4 and reflectance spectroscopy has successfully been applied for detection of pre-cancers in the bladder,5 6 colon,6 oral cavity,6 and esophagus,6 and multi-spectral fluorescence imaging has been used in the lung.7 Further development of these optical methods depends on our understanding of the relationship between optical signals and tissue morphology and biochemistry, with specific emphasis on changes occurring during carcinogenesis. Creation and analysis of tissue phantoms has proven to be a useful tool in understanding the optical properties of tissues and in developing new diagnostically useful algorithms for detection of epithelial pre-cancer.8 9 10 11 12 However, most tissue phantoms currently used in biomedical optics research either represent only the bulk properties of epithelial tissue, for example, suspensions of polystyrene beads and Intralipid solutions,9 10 11 12 or contain only some components of human epithelium, for example, cell monolayers placed atop a gel containing mixtures of BaSO 4 and human blood.8 These phantoms do not adequately mimic the scattering phase function or fluorescent properties of human epithelium. Therefore, they do not adequately represent human tissues that include epithelium, which consist of many interacting components. Tissues that include epithelium have two main layers: epithelium composed of several layers of epithelial cells and stroma consisting mostly of extracellular matrix (ECM) proteins, fibroblasts, and blood vessels. Epithelial and stromal layers are involved in a continuous communication process which is essential for normal function of epithelial tissue.13 14 15 During carcinogenesis, the cross talk between the epithelium and stroma breaks down.13 14 Altered epithelial–stromal interactions play a major role in such pathological processes as angiogenesis and tumor invasion.14 Thus, epithelial tissue is a dynamic structure with complex multi-component composition. To better understand the optical characteristics of this dynamic structure, especially in connection with biochemical events underlying development of cancer, it is essential to study the optical signatures of the individual components as well as the interaction of these components. Advances in the field of tissue engineering16 17 18 19 provide a new route for creation of biologically relevant tissue phantoms. Recently, engineered human lung tissue was successfully applied to study effects of epithelium on collagen density and contraction using two-photon laser scanning microscopy.20 Here, we introduce three-dimensional tissue phantoms which can help to understand the optical properties of the individual components of epithelial tissue as well as the optical signature associated with the dysplasia to carcinoma sequence. Our approach, is to create phantoms based on a step by step reconstruction of epithelial tissue (Figure 1). Our plan is to begin with the stromal layer which predominantly consists of a network of collagen bundles, and then progressively increase the model complexity by successively adding stromal and blood cells to the collagen network and epithelial cells on the top of the collagen matrix. In the framework of this model, different stages of epithelial cancer will be simulated using cell lines characteristic of normal, pre-cancerous and cancerous epithelium. In this paper, we present initial results of modeling the stromal layer and its interactions with the epithelial layer. Phantoms consisting of a collagen matrix alone and in the presence of embedded cervical epithelial cells were created. The microstructure and fluorescent properties of the phantoms were studied and were compared with optical properties of cervical epithelial tissue. 2.Methods2.1.Collagen Gels and Collagen Gels with Embedded CellsNormal epithelial cervical cells from primary culture (CrEC-Ec) were obtained from Clonetics. The cells were received in culture medium and were washed three times in phosphate (PBS) buffer immediately before experiments. Type I collagen from rat tail tendon (Roche Molecular Biochemicals) was dissolved in sterile 0.2 acetic acid (v/v) to a final concentration of 3 mg/ml. To dissolve lyophilized collagen, acetic acid was added to a bottle with the lyophilisate and the bottle was left standing without stirring overnight at room temperature. To prepare collagen gels, 7 parts of collagen solution in 0.2 acetic acid were mixed on ice with 0.89 parts of sterile 10X PBS and 1 part of sterile 0.2 M HEPES, pH 7.3. The pH of the mixture was adjusted to 7.4 using 2 M NaOH. Then the solution was divided into different vials. Subsequently, 1.11 parts of PBS buffer were added to the vials to prepare a collagen gel alone and 1.11 parts of cell suspension in PBS were added to prepare collagen gels with embedded cells and the samples were mixed thoroughly. Then the vials were placed in an incubator at 37 °C where the gelation process was completed in about 20 min. The final concentration of cells in the gels was adjusted using different concentrations of cells in the PBS suspensions. The prepared collagen gels were stored in PBS buffer. 2.2.Cervical BiopsiesThree normal cervical biopsies were obtained from the Cooperative Human Tissue network. A frozen biopsy was cut in two pieces. One part of the biopsy was immediately transferred to a cold cryostat microtome chamber for frozen sectioning. The biopsy was placed on a cryostat chuck and covered with OCT embedding medium. After the OCT medium was frozen, a Tissue-Tek Microtome (Miles Inc.) was used to prepare 20, 40, 60, 80, and 100-μm-thick sections for microscopic measurements. The other part of the biopsy was thawed in PBS buffer for about 10–20 min. Then the epithelial and the stromal layers were identified by visual examination of the biopsy. Two samples were cut from the biopsy using a scalpel: a piece containing both the epithelial and the stromal layers and a piece of the underlying stromal layer alone. Macroscopic fluorescence measurements were performed on the freshly thawed samples and on the samples stored in PBS buffer at 4 °C for 3 h and overnight. 2.3.Fluorescence and Transmittance MicroscopyA Zeiss Axiovert 100 M inverted microscope was used to characterize microstructure of the collagen gels and cervical biopsies. Transmittance and epifluorescence images were obtained from the same spots on the sample using a 60× oil immersion objective. A filter cube with a 380 nm bandpass excitation filter and a 420 nm long-pass emission filter was used to collect fluorescence images. The microscope was coupled to a low light charge coupled device camera (Hamamatsu Photonics) and image acquisition was computer controlled by KS-400 image processing software. 2.4.Fluorescence Excitation-Emission Matrixes (EEMs) of Cell Suspensions, Collagen Gels and Cervical BiopsiesFluorescence excitation-emission matrixes (EEMs) were measured using a scanning Spex Fluorolog II spectrofluorimeter. Excitation wavelengths ranged from 250 to 550 nm in 10 nm increments and emission wavelengths ranged from 10 nm past the excitation wavelength to the lower of 10 nm below twice the excitation wavelength or 700 nm, in 5 nm increments. Data have been corrected for the nonuniform spectral response of the emission monochromator and detector using correction factors supplied with the instrument and also for the nonuniform illumination intensity using a quantum counter. EEMs were plotted as contour maps, with contour lines connecting points of equal fluorescence intensity. EEMs of cells were measured from 3 ml suspensions in a 1 cm pathlength cuvette on three different days using fresh samples. Suspensions were stirred using a magnetic stirrer to minimize cell sedimentation during data acquisition. Collagen gels and cervical biopsies were placed against the inner wall of a 1 cm pathlength cuvette. The cuvette was filled with PBS buffer to keep the samples moist during measurements. EEMs of more than 15 freshly prepared collagen gels were measured. Some of the samples were stored in PBS buffer at 4 °C and were followed up with the fluorescence measurements for up to 45 days. EEMs were measured from three different preparations of normal cells embedded in collagen gels and three normal cervical biopsies. 2.5.Spectral Analysis of Multi-Component SamplesFluorescence spectra of collagen gels containing epithelial cells and cervical biopsies were decomposed using a linear combination of spectra characteristic for collagen I (collagen gel) and normal cells (cell suspension). The fitting routine was implemented using MATLAB. The fits were optimized using a standard non-negative least square algorithm to calculate the contribution of each component. The best fits were selected as those with the smallest value of the standard sum of the squared error. Each emission spectrum of a particular EEM was decomposed into a linear combination of individual components independently. 2.6.Hybrid Gaussian–Lorentzian ProfilesTo describe the fluorescence emission spectra of NADH and FAD and to determine the peak emission wavelengths of fluorophores in collagen emission spectra obtained with 310–390 nm excitation, we used hybrid profiles that consisted of a combination of Gaussian and Lorentzian profiles. The hybrid profile had the Gaussian shape [ GP(λ−λ¯,WG) ] for wavelengths shorter than the peak emission wavelength and Lorentzian shape [ LP(λ−λ¯,WL) ] for wavelengths longer than the peak emission wavelength. The Gaussian and Lorentzian curves were combined using two step functions S(λ) where A is the amplitude of the peak, λ is the emission wavelength, λ¯ is the peak emission wavelength, and WL and WG are the widths of Lorenztian and Gaussian portions of the profile, respectively. The hybrid profiles are characterized by four parameters: amplitude, peak emission wavelength, Gaussian and Lorentzian widths. These profiles significantly improve the representation of the long-wavelength descending tails of fluorescence emission spectra.3.ResultsFigure 2 shows a comparison of bright-field and fluorescence images of the collagen gel and the stromal layer of a normal cervical biopsy. The main morphological features in images of both specimens are extended linear fibers with bright autofluorescence at the 380 nm excitation wavelength. The structure of these fibers has been well characterized21 22 and it was shown that they consist of many self-assembled collagen molecules with intra- and intermolecular cross-links stabilizing the structure. The cross-links are believed to be responsible for the observed strong autofluorescence of collagen.22 23 Comparison of bright-field and fluorescence images presented in Figure 2 shows that the morphological fluorescence and microstructure of collagen gel approximates that of the stroma. Figure 2Comparison of bright-field and fluorescence images of the stromal layer of a normal cervical biopsy and a collagen gel. The fluorescence images were obtained with 380 nm excitation. The scale bar is 10 μm.  It was shown that stromal autofluorescence in cervix significantly increases in older patients.24 This increase is probably associated with increased cross-linking of collagen with age. In our experiments, we followed changes of autofluorescence of collagen gels with time. The most dramatic changes in collagen fluorescence were observed in samples of collagen gels which exhibited very low fluorescence signal in the freshly prepared specimens. Figure 3 shows changes in collagen fluorescence of one such sample. Initially, practically no fluorescence could be observed (Figure 3, top), but fluorescence significantly increased and individual fluorescent collagen fibers could be resolved after the sample was stored for seven days (Figure 3, bottom). The same tendency was observed in the samples which initially exhibited measurable fluorescence signal. The time dependence of collagen fluorescence averaged for four preparations of collagen gels from the same lot is shown in Figure 4(A). Whole EEMs were acquired for each sample at each point in time. The corresponding emission spectra at 360 nm excitation for one of the samples are presented in Figure 4(B). The observed increase in fluorescence intensity is statistically significant at a significance level p<0.02 . We did not observe significant changes in the shape and/or width of the emission spectra during the course of the experiment (45 days). The intensity of emission spectra increased in the 310–370 nm excitation region and the intensity of tyrosine fluorescence with maximum at 270 nm excitation did not change. Figure 3Comparison of bright-field and fluorescence (380 nm excitation) images of fresh prepared and aged collagen gels. The scale bar is 10 μm.  Figure 4Time dependence of collagen fluorescence: (A) relative changes of fluorescence emission intensity at 360 nm excitation vs time averaged for four samples; (B) corresponding emission spectra presented for one of the samples.  Figure 5 shows EEMs of normal cervical epithelial cells, collagen gel, and collagen gel embedded normal epithelial cells. The EEM of cells shows three major peaks at 290, 350, and 450 nm excitation which correspond to tryptophan, NADH, and FAD fluorescence, respectively. The EEM of the collagen gel shows two areas with high fluorescence intensity at 270–290 nm excitation and 310–370 nm excitation. The first region has a maximum at 270 nm excitation and 300 nm emission that is consistent with fluorescence of tyrosine. The second region, an elongated elipsoid, is an indication of closely spaced overlapping peaks. We attribute this region to fluorescence of collagen cross-links.22 23 The EEM of the collagen gel with embedded normal cells shows broad, featureless fluorescence in the 310–390 excitation region, where the fluorescence of NADH and collagen cross-links strongly overlap. Presence of both tyrosine and tryptophan fluorescence is evident in the 270–290 excitation region. Figure 5Excitation-emission matrixes: normal cervical epithelial cells from primary culture (top left), collagen gel averaged over four samples (top right), collagen gel with embedded normal cervical cells (bottom).  Fluorescence emission spectra of collagen and normal cervical cells at specific excitation wavelengths are presented in Figure 6. As noted above, the fluorescence of cells in the near UV and visible spectral regions is dominated by two major fluorophores: one with excitation/emission maximum at approximately 350/450 nm and the other with excitation/emission maximum at approximately 450/530 nm, which correspond to NADH and FAD, respectively [Figure 6(A)]. Collagen exhibits more complicated behavior in the 310–390 nm excitation region. Emission spectra obtained with 310–330 nm excitation have a peak around 415 nm and a shoulder at ∼447 nm while emission spectra in the 370–390 nm excitation region exhibit a peak at 448–455 nm [Figure 6(B)]. This behavior indicates that there are two major peaks in collagen fluorescence in the 310–390 nm excitation region. To test this assumption and to determine the position of the peaks, we fit measured spectra to the linear combination of two Gaussian–Lorentzian hybrid profiles. The fits were performed independently for all emission spectra. Maximum positions of the profiles, their half width and amplitudes were the fitting parameters. The best fits were selected as those with the smallest value of the standard sum of the squared error (SSE). All fits yielded the same two peak positions: one with emission maximum at 400±1 nm, width 100±1 nm, and excitation around 320 nm and another with emission maximum at 446±2 nm, width 102±1 nm, and excitation around 360 nm. Collagen also has significant fluorescence when excited with 410–470 nm wavelengths. In this spectral region, the emission maxima continuously shift to the red from 475 nm at 410 nm excitation wavelength to ∼540 nm at 470 nm excitation [Figure 6(B)]. This behavior suggests that there is at least one additional fluorophore with emission maximum around 540–550 nm that contributes to the fluorescence of collagen. It is hard to say if there is more than one fluorophore in this spectral region because of a strong residual contribution to the emission spectra from the cross-links with emission maxima at 455 nm. Figure 6Representative emission spectra of: (A) normal cervical epithelial cells obtained at 350 nm (solid), 370 nm (dashed long), 430 nm (squares), and 450 nm (dashed short) excitation wavelengths; (B) collagen gel averaged over four samples obtained at 320 nm (circles), 350 nm (solid), 370 nm (dashed short), 430 nm (triangles), and 450 nm (squares). Fitting curves (solid) for emission spectra of collagen embedded cells (circles) obtained at 350 nm (C) and 430 nm (D) excitation wavelengths. The collagen and cell components of the fits are shown as a dashed line and a line of squares, respectively. (E) Fitting curve (solid) for emission spectrum of normal cervical cells in suspension (circles) obtained at 350 nm using two hybrid Gaussian–Lorentzian profiles representing NADH (triangles) and FAD (squares). (F) Fitting curve (solid) for emission spectrum of collagen embedded normal cervical cells (circles) obtained at 350 nm excitation wavelength; the fitting was performed using the emission spectrum of collagen gel (dashed) and two hybrid Gaussian–Lorentzian profiles representing NADH (triangles) and FAD (squares). 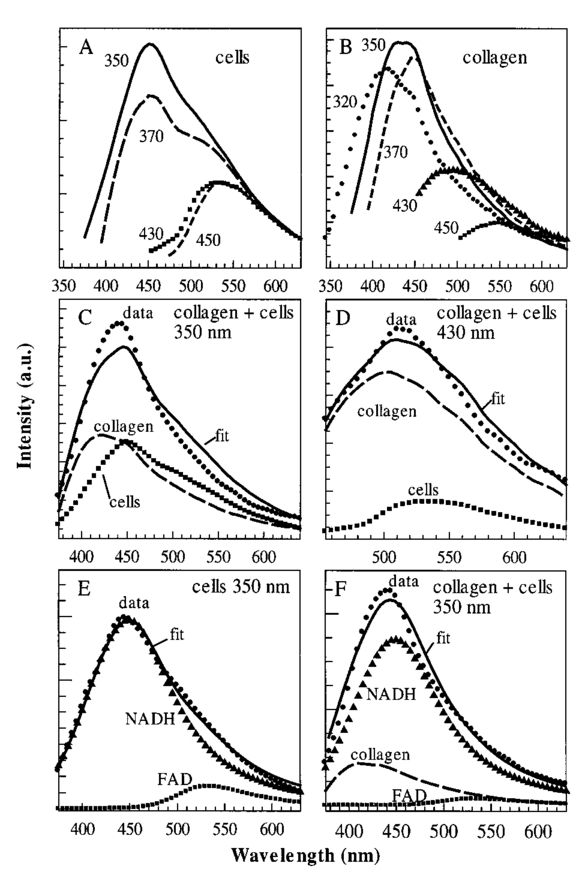 We used a linear combination of collagen and cell emission spectra to describe emission profiles of the collagen gel with embedded normal cervical cells; results are shown in Figures 6(C) and 6(D). Although the fits adequately represent the emission spectra of the embedded cells, there are some discrepancies between the measured spectra and the fits which should be addressed. First, the fitting process produced curves with increased red fluorescence as compared to the experimental emission spectra obtained with 340–360 nm excitation wavelengths [Figure 6(C)]. In this excitation region, fluorescence of the cellular component is dominated by the NADH peak at 350/450 nm excitation/emission, with a distinct shoulder at approximately 530 nm due to FAD. This same shoulder is present in the red tail of the fits [Figure 6(C)]. Therefore, it appears that cells embedded in the collagen matrix may have lower FAD fluorescence as compared to cells in suspension. Furthermore, the relative contribution of the cellular component is significantly decreased compared to the collagen component at 400–470 nm excitation wavelengths [Figure 6(D)]. In this excitation region, fluorescence of cells is determined by FAD. Cells embedded in collagen gels are uniformly distributed inside the gel matrix and therefore no wavelength dependent changes in relative contribution of cellular and collagen fluorescence are expected. Thus, the fitting results indicate that collagen embedded cells exhibit lower FAD fluorescence as compared to cells in suspension. To test this conclusion, we determined the relative contribution of NADH and FAD fluorescence to emission spectra of cells in suspension and emission spectra of cells embedded in collagen gels obtained in 340–370 nm excitation region. We used a linear combination of two hybrid Gaussian–Lorentzian profiles with peak positions corresponding to NADH and FAD emission maxima to represent fluorescence of cells in solution. Half width and amplitudes of the profiles were the fitting parameters. The best fits were selected as those with the smallest value of the SSE. The result of this fitting procedure at 350 nm excitation is shown in Figure 6(E). The resulting profiles represent the contributions of NADH and FAD fluorescence to the emission spectra of cells. Then a linear combination of the obtained synthetic profiles and collagen gel emission spectra were used to describe the emission spectra of collagen gel with embedded cells [Figure 6(F)]. Only the amplitudes of the components were changed to achieve the best fit. The quality of the fit significantly improved (SSE decreased ∼ five times) compared to the fitting procedure with collagen and cell emission spectra shown in Figure 6(C). To compare the relative contribution of FAD fluorescence to cells in suspension with cells embedded in collagen matrix, the ratio of the amplitudes of the NADH/FAD peaks for each sample was calculated. The relative contribution of FAD fluorescence was 2.0±0.6 times less for cells embedded in collagen as compared to cells in suspension. These results support our conclusion that the contribution of FAD fluorescence decreases when cells are embedded in collagen matrix. Figure 7 shows EEMs of two portions of a normal cervical biopsy: one containing epithelium and stroma, the other containing only stroma. Both samples were kept overnight at 4 °C in PBS buffer to reduce the contribution of blood absorption to the tissue fluorescence. However, the perturbation of fluorescence spectra is still evident in both EEMs around 420 nm excitation and emission, where the strongest hemoglobin absorption peak is located. Both EEMs show a peak with maximum at 290 nm excitation and 330 nm emission due to fluorescence of tryptophan and a relatively high fluorescence intensity in the 320–390 nm excitation region which is highly influenced by blood absorption. Individual emission spectra in the 320–470 nm excitation region for stromal and epithelial parts of the biopsy are shown in Figures 8(A) and 8(B), respectively. The intensity of the fluorescence emission spectra of the stroma monotonically decreases as excitation wavelengths change from 320 to 450 nm [Figure 8(A)]. Whereas, in the case of the sample containing epithelium and stroma, the fluorescence intensity appears to be the highest at 350–370 nm excitation [Figure 8(B)]. Emission spectra of the biopsy containing epithelium and stroma obtained with 320–360 nm excitation wavelengths exhibit a strong valley at 419 nm due to hemoglobin absorption that makes it very difficult to analyze the spectral profiles in this region. The blood absorption is not as evident in the individual emission spectra of the stroma [Figure 8(A)]; however, the presence of hemoglobin absorption can be seen alone at 420 nm excitation and emission on the stromal EEM (Figure 7, bottom). Figure 7Excitation-emission matrixes of a normal cervical biopsy: samples consisting of epithelial and stromal layers (top), and a stromal layer alone (bottom). The biopsy was kept overnight at 4 °C in PBS to reduce contribution of blood absorption to the fluorescence spectra.  Figure 8Representative emission spectra of: a normal biopsy containing (A) only stroma and (B) epithelium and stroma obtained at 320 nm (solid), 350 nm (dashed short), 370 nm (circles), 390 nm (dashed long), and 430 nm (triangles) excitation wavelengths. (C) Fits of stromal emission spectrum (circles) using collagen emission profile (dashed) at 370 and 430 nm excitation. (D) Fit (solid) of stromal emission spectrum obtained at 430 nm using collagen (dashed) and a synthetic emission profile characteristic for elastin (triangles). (E) Fit (solid) of the epithelial emission spectrum (circles) at 370 nm excitation using emission spectra of collagen (dashed) and normal cervical cells (squares). (F) Fit (solid) of the epithelial emission spectrum (circles) at 430 nm excitation using emission spectra of collagen (dashed), normal cervical cells (squares), and a synthetic emission profile characteristic for elastin (triangles).  Again, we used a linear combination of fluorescence spectra of collagen and normal cervical cells to describe emission spectra of the normal cervical biopsy. We limited our analysis to the 370–470 nm excitation region which is not significantly perturbed by hemoglobin absorption. First, we compared the emission profiles of stromal fluorescence with that of collagen gels [Figure 8(C)]. The stromal emission curves are described very well by collagen in the 370–400 nm excitation region [see example in Figure 8(C)]. Similar to collagen, the emission maxima of stromal fluorescence continuously shifts to the red from 485 nm at 410 nm excitation wavelength to ∼525 nm at 470 nm excitation. However, in this excitation region the collagen emission spectra appear to be broader and blueshifted relative to the stromal emission spectra when excited with 410–440 nm wavelengths and redshifted when excited with 460–470 nm wavelengths [see example in Figure 8(C)]. No shift in emission spectra of collagen and stroma was observed at 450 nm excitation where the emission maximum is 515 nm for both samples. These changes in relative position of the emission maxima of stroma and collagen and the coincidence of both maxima at 450 nm excitation indicate that stroma may have one additional fluorophore with emission maximum at 515 nm in the 410–470 excitation region. To test this hypothesis, we performed fits of all stromal emission spectra obtained with 410–470 nm excitation using the experimental collagen emission spectra and one synthetic Gaussian profile. All fits were performed independently of each other and all parameters (maximum position of Gaussian profile, half width and amplitude) in the synthetic profile were allowed to change to achieve the best fit. All fits yield the same synthetic profile with emission maximum at 519±3 nm and the excitation maximum at 430 nm [Figure 8(D), triangle curve]. Similar spectral characteristics have been reported previously for fluorescence of elastin.23 The stromal fluorescence can be adequately described in the 410–470 nm excitation region with the addition of this spectral profile [Figure 8(D)]. Because elastin was found in different types of connective tissues including cervix,25 we suggest that the observed differences in stromal and collagen fluorescence may be explained by the presence of elastin in stroma. The emission profiles of the part of the normal cervical biopsy containing epithelium and stroma are adequately described in the 370–400 nm excitation region using the emission spectra of collagen and normal cervical cells. An example for 370 nm excitation is shown in Figure 8(E). At this wavelength the left wing of the experimental emission curve is narrower as compared to the fit. This is most likely the result of the hemoglobin absorption, which decreases the emission intensity of the stromal fluorescence around 420 nm. An addition of the synthetic emission profile characteristic for elastin is required to fit epithelial emission spectra in the 410–470 nm excitation region [Figure 8(F)]. 4.DiscussionThe present report concentrated on the first step in creation of realistic tissue phantoms (Figure 1), namely, a collagen network that will serve as a support for embedded fibroblasts and blood cells as well as epithelial cells which will be added on the top of the collagen matrix. We used techniques developed in the field of chemical tissue engineering16 17 18 19 to build our initial phantom for a stromal layer of human epithelium. This phantom is based on a collagen gel and resembles morphological structure of stroma in a normal cervical biopsy (Figure 2). It also fully describes the fluorescence emission of the stroma in the 370–400 nm excitation region [Figure 8(C)]. However, the analyses of the 410–470 nm excitation region indicate that an additional fluorophore with excitation/emission maxima at 430/519 nm is required to describe the stromal fluorescence [Figure 8(D)]. The fluorescence of this fluorophore is consistent with elastin which exhibits 450/520 nm excitation/emission maximum in a powder form.23 Therefore addition of elastin to the phantoms should increase the resemblance between the optical properties of the real tissue and the phantoms. A combination of fluorescence spectra of a collagen gel, a synthetic profile characteristic for elastin, and a suspension of normal cervical cells was used to achieve adequate fits for fluorescence emission spectra of a normal cervical biopsy obtained with 370–470 nm excitation [Figures 8(E) and 8(F)]. These results illustrate our approach toward step by step creation of epithelial tissue phantoms where each consecutive step is aimed to increase a similarity between a real tissue and a phantom (Figure 1). We believe that this approach will allow us to establish the role of each individual component in the optical properties of the whole tissue. However, closer comparison of EEMs of collagen gel [Figure 6(B)] and stroma [Figure 8(A)] shows some important differences in the relative intensities at different excitation wavelengths. Emission spectra obtained with 320–340 nm excitation have a higher intensity relative to those obtained with 360–390 nm excitation in stroma [Figure 8(A)], whereas in the case of collagen gels emission spectra in both excitation regions have similar intensities [Figure 6(B)]. Stromal fluorescence in the 310–390 nm excitation region is predominantly determined by the fluorescence properties of collagen cross-links.22 23 26 27 28 29 30 Two major pathways for formation of cross-links have been described.21 22 26 27 28 29 One takes place at the maturation of the collagen fibers and requires an enzyme, lysyl oxydase, as the first step of the synthesis.21 22 Another pathway is associated with a variety of nonenzymatic aging reactions which involve collagen interaction with carbohydrates or lipids at the beginning of the reaction sequences.26 27 28 29 The final structure of the cross-links formed during maturation of the collagen fibers has been identified for hydroxylysyl pyridinoline (HP) and lysyl pyridinoline (LP).30 Both HP and LP have excitation/emission maxima at 325/400 nm.30 Collagen phantoms and the stroma have excitation emission maxima around 320/400 and 330/390 nm, respectively, which are consistent with the fluorescence of the pyridinoline cross-links. We believe that the 320/400 nm peak in collagen and 330/390 nm peak in stroma have the same origin. The differences in the positions of the peaks can be attributed to differences in composition of collagen gels and stroma. As it is evident from stromal EEM (Figure 7) the fluorescence properties of stroma are influenced by blood absorption at 420 nm that can alter positions of measured excitation/emission maxima of stromal fluorophores. Fluorescence of collagen extracts isolated from different subjects and tissues at 370 nm excitation and 440 nm emission is commonly used to monitor age related nonenzymatic formation of collagen cross-links.26 27 28 29 The collagen gel fluorescence peak at approximately 360 nm excitation and 455 nm emission correlates well with fluorescence of these age dependent cross-links. This peak fully describes fluorescent properties of stroma in the 370–400 nm excitation region [Figure 8(C)]. Collagen structure and biochemical reactions which are involved in formation of collagen cross-links are similar in different species and tissue sites.24 25 30 Therefore, formation of fluorophores with similar molecular structure could be expected. Our results show that the fluorescence of collagen phantoms resembles that of stromal layer except for significant difference in relative intensities of emission spectra in the 310–390 nm excitation region [compare Figures 6(B) and 8(A)]. To achieve a complete resemblance between the phantoms and a human tissue might be a difficult task because of known variability in relative concentration of different collagen cross-links depending on a subject, tissue site, and a subject’s age.21 22 27 One of the most exciting features of the tissue phantoms described here is the opportunity to study changes in tissue optical properties as a result of interactions with environmental factors, biologically active molecules, or interactions between tissue components. An example of such changes is the observed increase in fluorescence intensity of collagen gels over time (Figures 3 and 4). It is interesting to note that no changes in the relative fluorescence intensity of collagen cross-links were observed during the course of the experiment (45 days). As discussed earlier, the formation of collagen cross-links usually requires either an enzyme, lysyl oxydase, or the presence of carbohydrates or lipids.21 22 26 27 28 29 Neither of these substances was added to collagen gels in our experiments. The prepared gels were stored in PBS buffer solution during the course of the experiment to avoid any changes due to dehydration of the samples. However, residual cross-linking enzymes could be present in the collagen samples thus resulting in formation of collagen cross-links. It is also likely that the precursors required for the cross-link formation were originally present in our samples of collagen and we observed their slow transformation into the final cross-links. In future experiments we plan to explore the changes in collagen fluorescence during enzymatic (lysyl oxydase) or nonenzymatic (carbohydrates and lipids) collagen cross-linking. The experiments with mixtures of collagen gels and normal epithelial cells demonstrate the importance of environment on cellular fluorescence (Figure 6). Results indicate a decrease in the FAD component of cellular fluorescence relative to the NADH component for normal epithelial cells embedded in collagen gels as compared to cells in a PBS suspension. A decrease in FAD fluorescence relative to fluorescence of NADH indicates an increase in cellular metabolism.31 It was previously reported that interactions between epithelial cells and a collagen matrix (collagen I) can rapidly trigger an expression of additional genes in the cells.14 More experiments need to be done in order to determine whether the observed changes in FAD fluorescence are a reflection of interactions between cells and a collagen matrix including experiments with biologically “inert” matrixes, such as gelatin, and additional supply of nutrition for cells, such as glucose. In future studies we will increase the complexity of the proposed tissue phantoms and will study the interactions between different tissue components. The most important examples are interactions between extracellular matrix (ECM) and epithelial cells which play an important role in cellular invasion.14 15 Our results with fresh tissue slices showed that progression of neoplasia is associated with a decrease in stromal fluorescence.32 To understand molecular mechanisms behind these optical changes we will perform comparative studies of long term interactions of normal and cancer epithelial cells with ECM. We plan to combine optical measurements with approaches of quantitative immunochemistry and histology to derive additional molecular specific information about interactions between different tissue components. In conclusion, we have demonstrated new realistic three-dimensional tissue phantoms for biomedical optics. The phantoms contain components characteristic for human epithelium. We propose a step by step approach to create phantoms which manifest the main optical properties of human tissue. We demonstrated that phantoms based on collagen gels resemble morphology and fluorescence properties of a stromal layer of human epithelium. The proposed phantoms provide an exciting opportunity to study optical properties of different tissue components and their interactions in a natural environment. AcknowledgmentsWe acknowledge the contribution of Dafna Lotan in preparation of specimens. Financial support from the National Cancer Institute (No. PO1-CA82710) and the Whitaker Foundation is gratefully acknowledged. REFERENCES
N. Ramanujam
,
M. F. Mitchell
,
A. Mahadevan
,
S. Warren
,
S. Thomsen
,
E. Silva
, and
R. Richards-Kortum
,
“In vivo diagnosis of cervical intraepithelial neoplasia using 337 nm excited laser-induced fluorescence,”
Proc. Natl. Acad. Sci. U.S.A. , 91 10193
–10197
(1994). Google Scholar
C. S. Betz
,
M. Mehlmann
,
K. Rick
,
H. Stepp
,
G. Grevers
,
R. Baumgartner
, and
A. Leunig
,
“Autofluorescence imaging and spectroscopy of normal and malignant mucosa in patients with head and neck cancer,”
Lasers Surg. Med. , 25
(4), 323
–224
(1999). Google Scholar
D. L. Heintzelman
,
U. Utzinger
,
H. Fuchs
,
A. Zuluaga
,
K. Gossage
,
A. M. Gillenwater
,
R. Jacob
,
B. Kemp
, and
R. Richards-Kortum
,
“Optimal excitation wavelength for in vivo detection of oral neoplasia using fluorescence spectroscopy,”
Photochem. Photobiol. , 72
(1), 103
–113
(2000). Google Scholar
M. Panjehpour
,
B. F. Overholt
,
T. Vo-Dinh
,
R. C. Haggitt
,
D. H. Edwards
, and
F. P. Buckley
,
“Endoscopic fluorescence detection of high-grade dysplasia in Barrett’s esophagus,”
Gastroenterology , 111
(1), 93
–101
(1996). Google Scholar
J. R. Mourant
,
I. J. Bigio
,
J. Boyer
,
R. L. Conn
,
T. Johnson
, and
T. Shimada
,
“Spectroscopic diagnosis of bladder cancer with elastic light scattering,”
Lasers Surg. Med. , 17 350
–357
(1995). Google Scholar
V. Backman
,
M. B. Wallace
,
L. T. Perelman
,
J. T. Arendt
,
R. Gurjar
,
M. G. Muller
,
Q. Zhang
,
G. Zonios
,
E. Kline
,
T. McGillican
,
S. Shapshay
,
T. Valdez
,
K. Badizadegan
,
J. M. Crawford
,
M. Fitzmaurice
,
S. Kabani
,
H. S. Levin
,
M. Seiler
,
R. R. Dasari
,
I. Itzkan
,
J. Van Dam
, and
M. S. Feld
,
“Detection of preinvasive cancer cells,”
Nature (London) , 406 35
–36
(2000). Google Scholar
S. Lam
,
C. MacAulay
, and
B. Palcic
,
“Detection and localization of early lung cancer by imaging techniques,”
Chest , 103 12S
–14S
(1993). Google Scholar
V. Backman
,
R. Gurjar
,
K. Badizadegan
,
I. Itzkan
,
R. Dasari
,
L. T. Perelman
, and
M. S. Feld
,
“Polarized light scattering spectroscopy for quantitative measurements of epithelial cellular structures in situ,”
IEEE J. Sel. Top. Quantum Electron. Lasers Med. Biol., 5 1019
–1027
(1999). Google Scholar
J. R. Mourant
,
T. Fuselier
,
J. Boyer
,
T. M. Johnson
, and
I. J. Bigio
,
“Predictions and measurements of scattering and absorption Over broad wavelength ranges in tissue phantoms,”
Appl. Opt. , 36 949
–957
(1997). Google Scholar
V. Sankaran
,
K. Scho¨nenberger
,
J. T. Walsh Jr.
, and
D. J. Maitland
,
“Polarization discrimination of coherently propagating light in turbid media,”
Appl. Opt. , 38 4252
–4261
(1999). Google Scholar
G. Jarry
,
E. Steimer
,
V. Damaschini
,
M. Epifanie
,
M. Jurczak
, and
R. Kaiser
,
“Coherence and polarization of light propagating through scattering media and biological tissues,”
Appl. Opt. , 37 7357
–7367
(1998). Google Scholar
D. Bicout
,
C. Brosseau
,
A. S. Martinez
, and
J. M. Schmitt
,
“Depolarization of multiply scattered waves by spherical diffusers: Influence of the size parameter,”
Phys. Rev. E , 49 1767
–1770
(1994). Google Scholar
W. K. Hong
and
M. B. Sporn
,
“Recent advances in chemoprevention of cancer,”
Science , 278 1073
–1077
(1997). Google Scholar
C. Streuli
,
“Extracellular matrix remodelling and cellular differentiation,”
Curr. Opin. Cell Biol. , 11 634
–640
(1999). Google Scholar
M. A. Schwartz
and
V. Baron
,
“Interactions between mitogenic stimuli, or, a thousand and one connections,”
Curr. Opin. Cell Biol. , 11 197
–202
(1999). Google Scholar
M. R. Parkhurst
and
W. M. Saltzman
,
“Quantification of human neutrophil motility in three-dimensional collagen gels: Effect of collagen concentration,”
Biophys. J. , 61 306
–315
(1992). Google Scholar
R. Langer
and
J. P. Vacanti
,
“Tissue engineering,”
Science , 260 920
–926
(1993). Google Scholar
R. M. Kuntz
and
W. M. Saltzman
,
“Neutrophil motility in extracellular matrix gels: Mesh size and adhesion affect speed of migration,”
Biophys. J. , 72 1472
–1480
(1997). Google Scholar
J. Riesle
,
A. P. Hollander
,
R. Langer
,
L. E. Freed
, and
G. Vunjak-Novakovic
,
“Collagen in tissue-engineered cartilage: Types, structure, and crosslinks,”
J. Cell. Biochem. , 71 313
–327
(1998). Google Scholar
A. Agarwal
,
M. L. Coleno
,
V. P. Wallace
,
W. -Y. Wu
,
C. -H. Wun
,
B. J. Tromberg
, and
S. C. George
,
“Two-photon laser scanning microscopy of epithelial cell-modulated collagen density in engineered human lung tissue,”
Tissue Eng. , 7
(2), 191
–202
(2001). Google Scholar
D. R. Eyre
,
“Cross-linking in collagen and elastin,”
Annu. Rev. Biochem. , 53 717
–748
(1984). Google Scholar
R. Richards-Kortum
and
E. Sevick-Muraca
,
“Quantitative optical spectroscopy for tissue diagnosis,”
Annu. Rev. Phys. Chem. , 47 555
–606
(1996). Google Scholar
C. K. Brookner
,
M. Follen
,
I. Boiko
,
J. Galvan
,
S. Thomsen
,
A. Malpica
,
S. Suzuki
,
R. Lotan
, and
R. Richards-Kortum
,
“Autofluorescence patterns in short-term cultures of cervical tissue,”
Photochem. Photobiol. , 71
(6), 730
–736
(2000). Google Scholar
P. C. Leppert
,
S. Keller
,
J. Cerreta
, and
I. Mandl
,
“Conclusive evidence for the presence of elastin in human and monkey cervix,”
Am. J. Obstet. Gynecol. , 142 179
–182
(1982). Google Scholar
J. J. Tomasek
,
S. W. Meyers
,
J. B. Basinger
,
D. T. Green
, and
R. L. Shew
,
“Diabetic and age-related enhancement of collagen-linked fluorescence in cortical bones of rats,”
Life Sci. , 55
(11), 855
–861
(1994). Google Scholar
I. Miksik
and
Z. Deyl
,
“Change in the amount of ε-hexosyllysine, UV absorbance, and fluorescence of collagen with age in different animal species,”
J. Gerontol. , 46
(3), B111
–B116
(1991). Google Scholar
S. E. Hormel
and
D. R. Eyre
,
“Collagen in the ageing human intervertebral disc: an increase in covalently bound fluorophores and chromophores,”
Biochim. Biophys. Acta , 1078 243
–250
(1991). Google Scholar
P. Odetti
,
M. A. Pronzato
,
G. Noberasco
,
L. Cosso
,
N. Traverso
,
D. Cottalasso
, and
U. M. Marinari
,
“Relationships between glycation and oxydation related fluorescence in rat collagen during aging,”
Lab. Invest. , 70
(1), 61
–67
(1994). Google Scholar
D. Fujimoto
,
K. Akiba
, and
N. Nakamura
,
“Isolation and characterization of a fluorescent material in bovine achilles tendon collagen,”
Biochem. Biophys. Res. Commun. , 76
(4), 1124
–1129
(1977). Google Scholar
B. Chance
,
“Optical method,”
Annu. Rev. Biophys. Biophys. Chem. , 20 1
–28
(1991). Google Scholar
|


CITATIONS
Cited by 106 scholarly publications and 1 patent.
Collagen
Luminescence
Tissue optics
Biopsy
Tissues
Optical properties
Absorption


