1.IntroductionFree-running Er:YAG lasers have attracted interest in the last few years because of their potential for precise tissue removal. One clinical application which takes advantage of this potential is laser skin resurfacing.1 2 3 4 5 Since laser systems that deliver pulse energies of up to 2 J are now available, it is possible to use large spot diameters at radiant exposures which are large enough to achieve substantial ablation rates. The frequent use of free-running Er:YAG lasers motivated us to study the ablation dynamics of infrared (IR) laser tissue interaction in order to establish a basis for acoustic online control of the ablation process.6 7 8 Our photographic investigations of the ablation dynamics showed that material removal is caused mainly by material ejection and not only by vaporization.7 The material is ejected perpendicular to the sample’s surface and thus into the direction of the incident laser beam. It is the aim of the present study to quantify the attenuation of the laser beam by the material ejected. Although the dynamics of free running Er:YAG laser ablation of soft tissue have been studied in the past, no experimental investigation of the interaction of the incident laser beam with the material ejected has been performed so far. Previous attempts by Izatt et al.;,9 by Majaron et al.;,10 and by Hibst and Keller11 12 to estimate the shielding properties of the ablation plume relied on a comparison of measured ablation rates with the predictions of simple theoretical models in which the extinction coefficient of the plume served as a fit parameter. All these authors assumed that the ablation process is driven by one single mechanism, thus neglecting the possibility of a succession of various phases over time with each phase involving a different ablation mechanism. They further assumed that the interaction length between the laser beam and debris is equal to the ablation crater depth, i.e., that no sample material is ejected during the laser pulse. Both assumptions are questionable, particularly for free-running laser pulses. To overcome these limitations we directly measured the extinction by the ablation plume at the wavelength of the ablation laser. To find out how strongly the ablation plume influences the energy deposition into the sample we first determined the temporal evolution of the extinction coefficient of the ablation plume. To do that, a probe beam delivered by a free-running Er:YAG laser was sent through the ablation plume. In the second step, we evaluated the path length of the ablation laser beam through the plume using photographs of the ablation dynamics. These experimental results enabled us to calculate the temporal evolution of the energy deposition into the sample as well as the total amount of energy deposited. 2.Methods2.1.Laser SystemWe used a free-running Er:YAG laser (Dermablate MCL 29 D1, Asclepion Meditec, Jena, Germany) with a pulse duration of 200 μs and a maximum pulse energy of 2 J to ablate various sample materials (see Sec. 2.2). The shape of the laser pulse is characterized by intensity spikes at the beginning of the pulse which are later followed by a continuous emission as shown in Figure 7(a). The beam diameter at the sample’s surface was 5 mm. Radiant exposures of 4.6 and 7.8 J cm−2 were used for the experiments. For comparison, the ablation threshold for skin is 0.8 J cm−2.13 Figure 7Method used for calculation of the probe beam transmission through the ablation plume. Shown is a typical result of a single measurement performed during Er:YAG laser ablation of a gelatin sample with 90 water content (radiant exposure 4.6 J cm−2). (a) Ablation laser pulse, (b) incident probe laser pulse (upper curve) and transmitted probe laser pulse (lower curve), (c) transmission curve calculated from the pulse shapes in (b). The vertical lines in (b) and (c) demarcate the time interval which was evaluated to normalize the signals in (b) relative to each other. 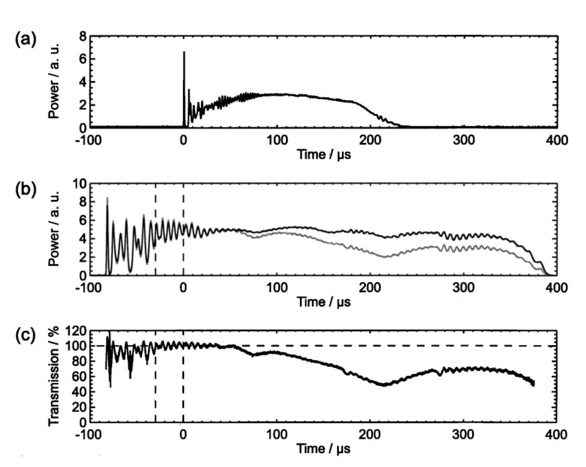 2.2.Irradiated SamplesWe irradiated water, gelatin with 70 and 90 water content (by weight), and skin. The ablation of water was investigated because water is the main chromophore at the Er:YAG laser wavelength of 2.94 μm. A comparison with the results obtained for skin clarifies the role of the tissue matrix for the ablation dynamics. Gelatin samples with different water contents were used to study the influence of the mechanical properties of the sample on the ablation dynamics.7 2.3.Photographic Investigation of the Ablation DynamicsLaser flash photography of the ablation dynamics was performed using a shadowgraph and a darkfield Schlieren arrangement. The photographs served to determine the path length of the incident laser beam through the ablation plume and allowed one to distinguish between parts of the plume that consisted of vapor and particulate matter. The shadow- graph arrangement makes objects visible which absorb the illumination light or refract it out of the aperture of the imaging optics. The shadowgraph technique was, therefore, used to study material ejection during the ablation process. The darkfield Schlieren arrangement makes visible not only light absorbing and strongly refracting objects but also weak phase objects like, for example, gaseous ablation products, which cannot be seen on shadowgraph photographs. The experimental setup of the darkfield Schlieren arrangement was described in detail in Ref. 6. For illumination of the photographs we used a frequency doubled Q-switched Nd:YAG laser with a pulse duration of 6 ns (Continuum YG 671-10, Santa Clara, CA). To achieve speckle-free illumination, the laser light was coupled into a 300 m long multimode optical fiber with a 160 μm core diameter. Since the path length differences among the various fiber modes are larger than the coherence length of the laser pulse, no interference phenomena are observed at the fiber end. We obtained a series of pictures of the ablation process by taking photographs with different delay times between the ablation laser pulse and the illumination laser pulse. From the series of pictures we evaluated the path length traveled by the ablation laser beam through the ablation plume. The positions of the front of the gaseous ablation products and that of the material ejected were analyzed separately. To study the processes at the sample surface, we took photographs in top view. The sample surface was illuminated by a collimated laser beam delivered from the frequency doubled Nd:YAG laser. The illumination beam and camera were both oriented at an angle of 35° to the ablation-laser beam. The illumination light was specularly reflected by the undisturbed sample surface into the direction of the camera. All changes of the surface that led to reflection or scattering of the illumination light from the aperture of the camera objective resulted in darkening of the respective surface location. 2.4.Measurement of the Ablation Plume TransmissionThe temporal evolution of the extinction coefficient of the ablation plume was investigated using the experimental setup depicted in Figure 1. To measure the extinction coefficient at the wavelength of the Er:YAG laser used for ablation (laser 1) we sent the beam of a second free-running Er:YAG laser (laser 2) through the ablation plume and measured the pulse shape of the probe beam before and after transit through the plume. The probe beam had a diameter of 2 mm at the ablation site. The beam path was oriented parallel to the sample’s surface, with a distance of 2.5 mm between the beam axis and the sample. Figure 1Experimental setup used for investigation of the ablation plume transmission at the Er:YAG laser wavelength.  Our photographic investigations showed that the size of the particulate ejecta is large compared to the optical penetration depth of the Er:YAG laser radiation of about 1 μm. The extinction of the probe laser beam is therefore mainly governed by absorption in the particulate ejecta, and Mie scattering hardly contributes to the extinction of the laser beam. However, scattering due to specular reflection at the surfaces of the ejected particles contributes to the extinction of the probe laser beam in the ablation plume. To detect the shape of the incident pulse, part of it was deflected by an inclined quartz plate in the beam path, sent on a diffuser (SRM-99O Spectralon, Labsphere, North Sutton, NH), and detected by a InAs photodiode (J125AP-R02M, EG&G Judson, Montgomeryville, PA; rise time 10 ns). The other part of the probe beam passed through the ablation plume and was focused onto a second diffuser. The pulse shape was detected by a second InAs photodiode of the same type as photodiode 1. The probe beam was directed on a diffuser to achieve spatial integration over all components of the beam traversing through different parts of the ablation plume. The focusing enabled us to achieve this integration while using a short distance between the photodiode and the diffuser. This way, strong signals and a good signal to noise ratio could be obtained. Both photodiodes were operated at the same output voltage to minimize the influence of their characteristic curves on the output signal. Due to the distance between the photodiode and the diffuser, light scattered by the ablation material at an angle of more than 10° did not contribute to the photodiode signal. The diameter of the probe beam (2 mm) was significantly smaller than the diameter of the ablation laser beam (5 mm). The path lengths of rays passing through the ablation plume on the beam axis and at the edges of the probe beam were thus nearly the same. The extinction coefficient of the ablation plume was calculated by relating the probe beam transmission to the path length of the beam within the plume (for further details see Secs. 3.2.1 and 3.2.2). The total radiant exposure in the probe beam was 0.22 J cm−2 which is considerably smaller than the ablation threshold for water with regard to a 200 μs long laser pulse. The radiant exposure for each part of the ablation plume passing the probe beam is even much smaller, since the material ejected interacts with the probe beam only for about 20 μs because of the high particle velocity of about 100 m s−1.7 Any influence of the probe beam on the ablation plume can, therefore, be ruled out. The probe beam was produced using a laboratory laser system with a pulse forming network (LISA Laser Products, Katlenburg, Germany) capable of generating long pulses of 440 μs duration. The transmission T of the ablation plume could thus be measured during the entire duration of the ablation laser pulse (200 μs). The probe pulse was triggered 80 μs before the beginning of the ablation laser pulse. The photodiode signals measured in front of and behind the ablation site during this time interval with T=1 were used as a reference for calculation of the ablation plume transmission. The transmission of the ablation laser beam to the target as well as the energy deposited into the sample were calculated from the extinction coefficient of the ablation plume and the temporal evolution of the path length of the ablation beam through the plume. A detailed description of the analysis is given in Secs. 3.2.3 and 3.2.4. 3.Results and Discussion3.1.Ablation DynamicsThe ablation dynamics observed during the irradiation of gelatin, skin, and water have some characteristic features in common. The characteristic sequence of events will be described in detail for the case of gelatin with 70 water content, and for water. A comparison between the ablation dynamics for gelatin samples with 70 and 90 water contents can be found in Ref. 7. Figure 2 gives an overview of the ablation dynamics for gelatin with 70 water content during the first 100 μs of the laser pulse. The ablation laser beam is incident from the top. The radiant exposure was 4.6 J cm−2 at a spot diameter of 5 mm. The pictures were taken with the dark field Schlieren arrangement (Sec. 2.3). The sample surface appears as a horizontal white line. The Schlieren photographs first show a vapor plume which starts to form about 10 μs after the beginning of the laser pulse. The vapor plume is generated by the heating of a superficial sample layer, leading to normal vaporization.14 The vapor plume expands predominantly into the direction of the incident laser beam. The vapor front reaches a height of approximately 5 mm after 100 μs. After about 30 μs, the sample surface starts to rise across the entire irradiated area. This is probably a consequence of the formation of vapor bubbles inside the sample. The surface is still intact after 100 μs because the tensile strength of the gelatin counteracts the vapor pressure inside the bubbles. When the vapor pressure exceeds the ultimate tensile strength, the sample surface tears and material is ejected. This part of the ablation process, which starts about 120 μs after the beginning of the laser pulse, is shown in Figure 3. The particle front travels at high velocity into the direction of the incident laser beam. The particle density near the sample’s surface reaches its maximum after about 180 μs. The density then decreases towards and after the end of the laser pulse (pulse duration 200 μs). Figure 2Initial phase of Er:YAG laser ablation of gelatin with 70 water content (radiant exposure 4.6 J cm−2 and spot diameter 5 mm; scale corresponds to 5 mm). The pictures were taken 10–100 μs after the beginning of the laser pulse using a dark field Schlieren arrangement. Ablation starts with the formation of a vapor plume. The water vapor becomes visible because its refractive index differs from the surrounding air. After 30 μs the sample’s surface starts to rise because vapor bubbles have formed inside the sample. The surface is still intact after 100 μs because the tensile strength of the gelatin counteracts the vapor pressure.  Figure 3Dynamics of Er:YAG laser ablation of gelatin with 70 water content in the second half and after the end of the laser pulse (for laser parameters see Fig. 2; scale corresponds to 5 mm). The pictures were taken using a shadow graph technique to show material ejection starting approximately 120 μs after the beginning of the laser pulse. 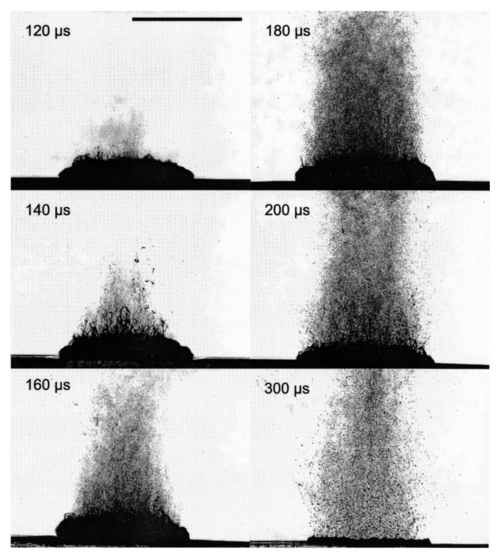 The ablation dynamics of skin resemble those of gelatin with 70 water content, except that no rise of the sample’s surface is observed before material is ejected. The greater stability of the sample surface is most likely due to the fact that collagen fibrils in skin have a higher tensile strength than fibril fragments in gelatin. The photographs of Figures 2 and 3 suggest that vapor formation and particle ejection take place across the entire irradiated spot. To remove all doubts about this interpretation, we took photographs of the sample’s surface during laser ablation, presented in Figure 4. Twenty microseconds after the beginning of the laser pulse, a white disk appears at the ablation site. At this point in time vapor has formed above the surface (Figure 2), and the sample surface has become roughened by surface instabilities caused by interaction between the vapor plume and the gelatin.15 16 After 100 μs, an irregular dark structure is visible across the entire ablation laser beam diameter which corresponds to the surface area that rose and was visible in the dark field and shadow graph pictures (Figures 2 and 3). Two hundred microseconds after the beginning of the laser pulse, particulate ejecta appear above the ablation site (Figure 4). The dark dots below the ablation site are mirror images of the ejected particles. The homogeneous roughening of the sample surface observed after 100 μs confirms that the ablation process is isotropic across the entire beam diameter, which implies that material ejection takes place across the entire beam diameter. Figure 4Top view of the ablation site during the irradiation of gelatin samples with 70 water content (radiant exposure 4.6 J cm−2; vertical and horizontal scales correspond to 5 mm). 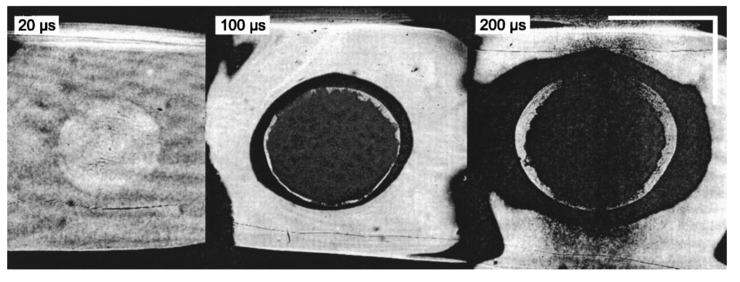 Our photographic observations contradict the results of Zweig and Weber,17 the first group of researchers who attempted to explain material ejection during free-running laser ablation. In their theory, ablation is mainly mediated through fast surface vaporization. It is assumed that a molten or otherwise liquefied superficial tissue layer develops during the ablation process. For laser beams with an inhomogeneous irradiance distribution like, for example, a Gaussian beam, pressure gradients develop in the vapor cloud above the tissue’s surface. If the gradients are strong enough (i.e., for small spot sizes and high radiant exposure), they accelerate the liquefied layer in a direction tangential to the tissue’s surface and can thus lead to material ejection. Our results demonstrate that material ejection during free-running laser ablation is a much more general phenomenon than predicted by Zweig and Weber. The ejection of particulate matter visible in Figure 3 shows that material expulsion does not require the tissue to be liquefied. Ejection of particulate matter can be explained by the thermomechanical microexplosion model developed by Majaron et al.;18 Their model assumed that high pressure builds up inside the tissue through vaporization into small pre-existing bubble nuclei. This pressure finally leads to tearing of the tissue matrix and to material ejection, without an intermediate melting process. The threshold for material ejection is simply related to the ultimate tensile strength of the sample material. Our experiments performed with a nearly top-hat beam profile, a large spot size, and a radiant exposure fairly close (3–4 ×) above the ablation threshold further show that material ejection is not restricted to cases with inhomogeneous irradiance distribution, small spot size, and high radiant exposure as predicted by Zweig and Weber. Our above mentioned experimental results, together with the observation that the material is ejected in a direction perpendicular to the tissue surface, indicate that the driving force for ablation is not a pressure gradient in the ablation plume but rather high pressure within the tissue itself. This again supports Majaron et al.;’s model. Our photographic investigations of the ablation dynamics for the irradiation of gelatin and skin showed that material removal is caused mainly by the ejection of sample material and not only by vaporization. The photographs in Figures 5 and 6 show that this is also true for the ablation dynamics of water, even though water does not possess an elastic matrix that counteracts the formation and growth of vapor bubbles. The ablation starts with the formation of a vapor plume (Figure 5) like in the case of gelatin (Figure 2). After 30 μs, the white line demarcating the water surface in the dark field pictures starts to show some irregularities. A comparison with the photographs taken with the shadow graph arrangement (Figure 6) reveals that at this time water droplets start to be ejected perpendicular to the sample surface. The droplet density reaches its maximum approximately 60 μs after the beginning of the laser pulse and decreases thereafter already during the laser pulse. Figure 5Initial phase of the Er:YAG laser ablation dynamics of water (radiant exposure 4.6 J cm−2 and spot diameter 5 mm; scale corresponds to 5 mm). The photographs were taken 10–100 μs after the beginning of the laser pulse using the dark field Schlieren arrangement. The water surface appears as a white line. The surface is curved because the cuvette was overfilled in order to be able to see the ablation site. Ablation starts with the formation of a vapor plume. After 30 μs, the white line demarcating the water’s surface starts to show some irregularities. The white line disappears completely in the picture taken after 80 μs. After 100 μs, water droplets are visible close to the water’s surface. 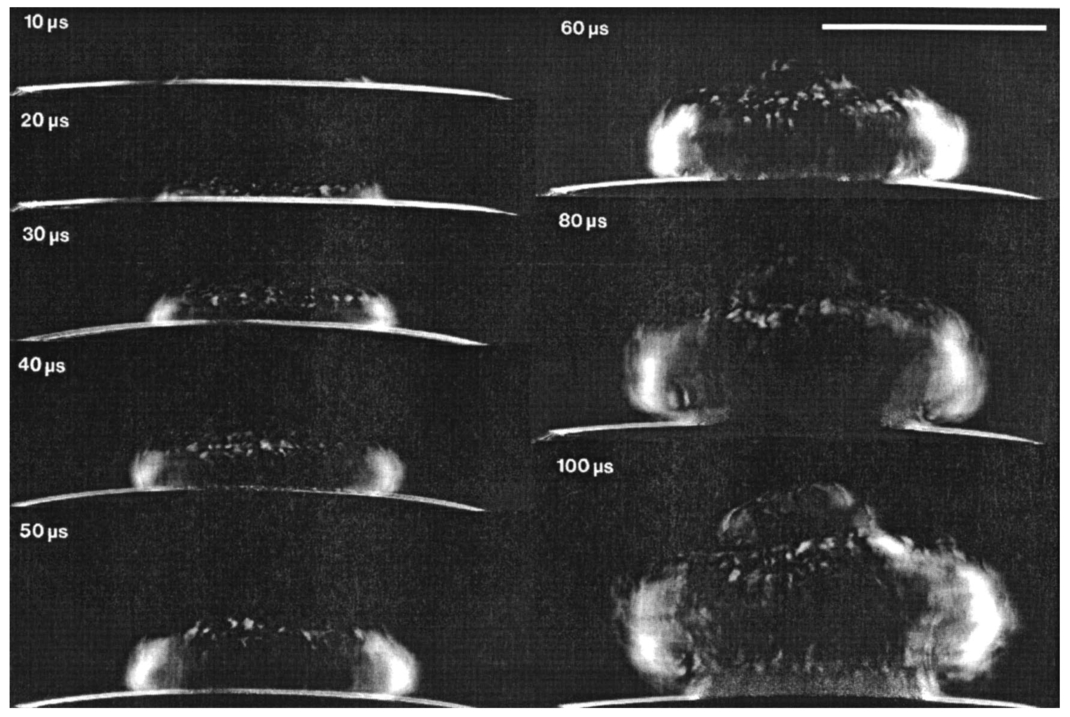 Figure 6Initial phase of the ablation dynamics for the Er:YAG laser irradiation of water (for laser parameters see Fig. 5; scale corresponds to 5 mm). The photographs were taken using the shadow graph arrangement to make ejection of water droplets visible. Droplet ejection starts 30–40 μs after the beginning of the laser pulse and is maximal around 60 μs. 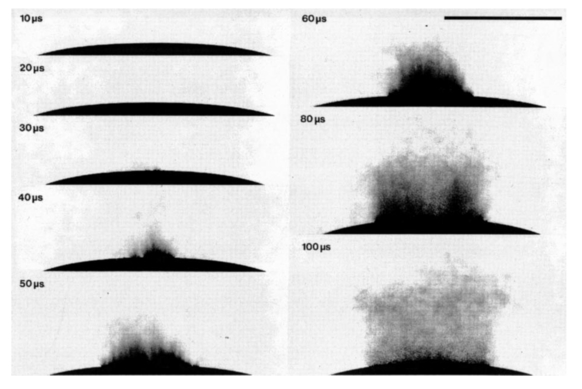 The ejection of water droplets during Er:YAG laser irradiation of pure water can be explained by the hypothesis that the water is superheated and that this superheating leads to a phase explosion. The phase explosion is characterized by a rapid transition of a superheated metastable liquid into a system containing the two separate phases of gas and liquid in equilibrium states.14 19 20 The transition occurs when the temperature of the liquid reaches the spinodal limit (≈ 90 of the critical temperature in Kelvin21) and homogeneous nucleation sites are generated very rapidly. The phase transition leads to a strong expansion of the vapor phase, because the specific volume of water vapor is 1696 times larger than the specific volume of liquid water (both at atmospheric pressure).22 The water droplets formed during the phase explosion are accelerated by the expanding vapor and ejected from the sample surface at very high velocity. To check if the spinodal limit of superheated water can be reached during Er:YAG laser irradiation we calculated the temperature evolution at the sample surface. The solution of the inhomogeneous heat diffusion equation given by Freund et al.;23 was calculated numerically.13 The optical and thermal constants of the sample material were kept constant in the computation. The calculations predict that the spinodal temperature of water (302 °C at atmospheric pressure)20 is reached about 25 μs after the beginning of the laser pulse. The shadow graph pictures in Figure 6 show that material ejection starts after 30 μs, i.e., shortly after the spinodal limit has been reached according to the calculations. The slight discrepancy is probably a result of the decrease in the optical absorption coefficient with an increase in sample temperature,24 which was neglected in the calculations. The calculations provide additional evidence for the interpretation that a phase explosion is the mechanism responsible for droplet ejection during water ablation. The observation of a phase explosion during Er:YAG laser irradiation of water suggests that a phase explosion may also contribute to the material ejection observed during the ablation of gelatin and skin samples, because they mainly consist of water. The elastic matrix will, however, delay the onset of material ejection with respect to the onset observed for water if the material’s strength is higher than the vapor pressure at the spinodal limit. The matrix counteracts the vapor expansion inside the sample until the ultimate tensile strength of the matrix is reached and the ablation starts (Figure 2). With regard to our investigations of the transmission of the ablation plume, we can summarize the results of our photographic observations of Er:YAG laser ablation dynamics as follows: A subablative phase during which a superficial sample layer is heated is followed by a vaporization phase, and, later on, by material ejection. Material ejection occurs even for radiant exposures very close to the ablation threshold. For calculation of the laser beam transmission to the target, the ablation plume must therefore be divided into a vapor plume and a part that consists of vapor mixed with particulate matter. The series of pictures yields the path length of the ablation laser beam through each part of the plume as a function of time. 3.2.Shielding by the Ablation PlumeTo obtain the temporal evolution of the energy deposition into the sample and to calculate the total amount of energy deposited we first determined the temporal evolution of the transmission of the ablation plume. To do that we calculated the extinction coefficient of the plume for the different phases of the ablation dynamics from the measured transmission of the probe laser beam (Secs. 3.2.1 and 3.2.2). We then calculated the transmission of the ablation laser beam through the plume from the extinction coefficients of the different parts of the plume and the path length of the laser beam through these parts (vapor, and particles mixed with vapor) until it reaches the sample surface (Sec. 3.2.3). Finally, the transmission data for the ablation laser pulse were used to calculate the pulse shape transmitted (Sec. 3.2.3) and the energy deposited (Sec. 3.2.4). 3.2.1.Temporal Evolution of the Probe Beam TransmissionThe temporal evolution of the probe beam transmission was calculated from the ratio of the photodiode signals measured in front of and behind the ablation plume (Sec. 2.4). Figure 7 shows the shape of the ablation laser pulse and the shapes of the probe laser pulse incident into and transmitted through the ablation plume for ablation of a gelatin sample. The probe laser pulse begins 80 μs before the ablation laser pulse. To normalize the pulse shapes of the incident and transmitted beams relative to each other, we used the photodiode signal measured in a time interval of 30 μs just before the beginning of the ablation laser pulse. The mean value of the ratio of the photodiode signals during this time interval served as the normalization factor. The pulse shapes shown in Figure 7(b) are already normalized. Figure 7(c) depicts the temporal evolution of the probe beam transmission which was obtained by dividing the normalized signals of Figure 7(b). Figure 7 presents the result of a single measurement. For further evaluation, we averaged the transmission data from 15 single measurements. The standard deviation of the averaged transmission data was less than 7 for every point in time. The temporal evolution of the probe beam transmission is shown in Figures 8 and 9 for the ablation of gelatin, water, and skin with radiant exposures of 4.6 and 7.8 J cm−2, respectively. Time zero corresponds to the beginning of the ablation laser pulse. The temporal evolution of the probe beam transmission reflects a succession of several phases during the ablation process. This can be understood by comparing the transmission curves with the photographs of the ablation dynamics shown in Sec. 3.1. Figure 8Temporal evolution of the probe beam transmission through the ablation plume (a) for gelatin with 70 and 90 water content and (b) for water and skin. The radiant exposure of the ablation laser pulse was 4.6 J cm−2, the beam diameter was 5 mm, and the pulse duration was 200 μs [full width at half maximum (FWHM)]. Time zero corresponds to the beginning of the ablation laser pulse. The curves are averaged over 15 events.  Figure 9Temporal evolution of the probe laser beam transmission through the ablation plume (a) for gelatin with 70 and 90 water content and (b) for water and skin. The radiant exposure of the ablation laser pulse was 7.8 J cm−2, the beam diameter was 5 mm, and the pulse duration was 220 μs (FWHM). The curves are averaged over 15 events.  For the ablation of gelatin with a radiant exposure of 4.6 J cm−2 , the transmission starts to decrease 60 μs after the beginning of the laser pulse and remains constant thereafter for about 30 μs [Figure 8(a)]. During this time interval, the gaseous ablation products pass through the probe beam. The time delay between the start of vaporization and the corresponding decrease of the probe beam transmission is due to the distance of 2.5 mm between the probe beam and the sample’s surface. A further decrease in transmission starts 100 μs after the beginning of the laser pulse. This decrease is caused by the ejection of solid and liquid ablation products. Until the end of the laser pulse, the transmission decreases to 71 and 56 for gelatin with 70 and 90 water contents, respectively. The transmission for water and skin [Figure 8(b)] is always higher than that for gelatin. The transmission curve for skin exhibits a considerable decrease in transmission only at very late times. This corresponds to a late onset of material ejection observed photographically. During the ablation of water, the transmission decreases very rapidly after about 60 μs, but it already increases again during the laser pulse and stays on a constant level for the rest of the pulse. The transiently very strong decrease of the transmission portrays the ejection of water droplets caused by the phase explosion. This explanation is supported by the pictures in Figure 6 which show that the water droplets begin to pass through the probe beam approximately 60 μs after the beginning of the laser pulse (taking into consideration the distance of 2.5 mm between the probe beam axis and the sample’s surface). A decrease in probe beam transmission occurs at the same time. The photographs show, furthermore, that the droplet density at the probe beam axis is maximal after about 80 μs when the transmission curve reaches its minimal value. After the phase explosion, water droplets are still ejected, but with a smaller density. This explains why the transmission increases again and remains at a constant level after 120 μs. Figure 9 presents the probe beam transmission for ablation with a radiant exposure of 7.8 J cm −2 . The transmission curves for gelatin samples with 70 and 90 water contents drop to 70 and 42, respectively, at the end of the laser pulse. The decrease starts earlier and the minimum transmission is lower than in the case of 4.6 J cm−2 radiant exposure. This can be explained by a larger amount of material ejected and by an earlier onset of material ejection. The higher radiant exposure induces a faster temperature and pressure rise inside the sample, and thus a faster onset of the phase explosion or rupture of the material matrix, respectively. It is interesting to note that the faster onset of material ejection with an increase in radiant exposure only applies to water and gelatin. During skin ablation with a radiant exposure of 7.8 J cm−2, the transmission decreases not earlier than with a radiant exposure of 4.6 J cm−2. The tissue matrix seems to sustain the increased pressure much better than the gelatin. During ablation of water with the higher radiant exposure, the transmission decrease starts earlier but is less pronounced than with a radiant exposure of 4.6 J cm−2. This difference can be explained by the influence of heat diffusion inside the sample. For 7.8 J cm−2 the phase explosion has already occurred early on during the laser pulse when only a very thin water layer at the sample surface is heated to the spinodal limit. Therefore, the phase explosion incorporates only a small volume of water and the number of water droplets ejected is small. In contrast, at a radiant exposure of 4.6 J cm−2, the phase explosion takes place after a delay of 60 μs. At that time, heat diffusion has led to superheating of a much larger sample volume which causes ejection of a large number of water droplets. 3.2.2.Extinction Coefficients of the Ablation PlumeThe extinction coefficient of the ablation plume was determined separately for the vaporization phase and the phase of material ejection. The mean transmission T during each phase was used to calculate the mean time averaged extinction coefficient α of the respective part of the plume. The values for vapor are denoted Tv and αv, respectively, and the values for the mixture of vapor, liquid, and solid ablation products are denoted Tvp and αvp. The time intervals used to determine the extinction coefficients during each phase were inferred from the photographs of the ablation dynamics. For the determination of αvp, the transmission was considered only until the end of the ablation laser pulse, because only this time interval is relevant to the shielding properties of the ablation plume. The extinction coefficients were calculated from the transmission data using Beer’s law, Here d is the path length through the ablation plume which was set equal to the ablation spot diameter of 5 mm. The transmission values and extinction coefficients are listed in Table 1 for a radiant exposure of 4.6 J cm−2 and in Table 2 for 7.8 J cm−2. For the phase of material ejection, we used not only the mean transmission but also the minimum transmission for further evaluation. The minimum transmission provides an upper estimate of the extinction coefficient of the ablation plume and thus yields a lower estimate of the laser energy deposited into the sample.Table 1
Table 2
The extinction coefficients of the vapor plume ranged between 0.016 and 0.124 cm−1. The highest value of the extinction coefficient was at both radiant exposures obtained for the ablation of gelatin samples with 90 water content. No general dependence between the extinction coefficient of the vapor plume and the radiant exposure could be identified. Our experimental data lie within the range of values for the absorption coefficient of water vapor at the Er:YAG laser wavelength given in the literature. Young25 quoted a value of 0.0075 cm−1 for a temperature of 100 °C at atmospheric pressure (0.1 MPa), and a value of 1.8 cm−1 for the spinodal temperature at atmospheric pressure (302 °C) and the vapor pressure at that temperature (9.7 MPa). The results of our measurements (0.016–0.124 cm−1) lie at the lower end of this range. The highest value is more than one order of magnitude smaller than the absorption coefficient of vapor at the spinodal limit. This result is surprising at first because a phase explosion was observed at the end of the vaporization phase and that can only occur at temperatures that are close to the spinodal limit. The discrepancy can be explained by the expansion of the vapor plume that occurs before the vapor front reaches the probe beam. The nearly adiabatic expansion leads to a reduction in temperature and pressure inside the plume and thus to a lowering of the extinction coefficient. For a radiant exposure of 4.6 J cm−2, the mean extinction coefficient of the ejected material mixed with vapor is 5–8 times larger than the values obtained for vapor (Table 1). For a radiant exposure of 7.8 J cm−2, αvp is even 6–30 times larger than αv (Table 2). The extinction coefficients calculated using the minimum transmission values for the ejected material are 10–50 times larger than the values obtained for vapor. We can thus conclude that the extinction of the laser beam in the ablation plume is mainly caused by the ejected material. The extinction coefficients of the ejected material depend on the ablated sample material. They increase in the following order: water, gelatin with 70 water content, skin, and gelatin with 90 water content. This order was observed for both radiant exposures investigated. The extinction coefficient measured during water irradiation is smallest because the water droplets ejected are much smaller than the gelatin droplets and tissue fragments which are produced during ablation of the other samples. The particularly high extinction during the ablation of gelatin samples with 90 water content can be explained by the fact that the ejected material consists of a large number of relatively thick strings of liquefied gelatin (Figures 6 and 7 in Ref. 7). In the case of gelatin with 70 water content, in contrast, only small droplets and fragments of gelatin are ejected (Figure 3). During the ablation of skin, small tissue fragments are produced which are similar in size and density to the ejecta produced during the ablation of gelatin with 70 water content.13 The resulting extinction coefficient of the ablation plume is, therefore, similar in both cases. 3.2.3.Temporal Evolution of the Transmission of the Ablation Laser BeamTo calculate the temporal evolution of the energy deposition into the sample we need to know, apart from the extinction coefficients of the different parts of the ablation plume, the temporal evolution of the path length of the ablation laser beam through these parts. The path length was obtained from the photographs of the ablation dynamics (Sec. 3.1) by measuring the position of the fronts of the vapor plume, zv, and the particulate ejecta, zvp, at different times after the beginning of the laser pulse. We defined that part of the ablation plume as “front” of the particulate ejecta that looked like the plume at the location of the probe beam when the mean value of the probe beam transmission Tvp was measured. From the discrete measurement data continuous position time curves were calculated by cubic spline interpolation.26 The position time curves are denoted by zv(t) for the vapor front and by zvp(t) for the particle front. The temporal evolution of the transmission, T(t), of the ablation laser pulse through the ablation plume was calculated using the following set of equations for the different phases of the ablation dynamics: Therein, the first line describes the transmission through the vapor plume before the onset of material ejection. The second line corresponds to the transmission through the plume after material ejection has started. The first term herein describes the transmission through the vapor plume above the particle front, and the second term describes the transmission through the particle plume mixed with vapor. The third line in Eq. (2) is valid only if the particle front overtakes the vapor front.Figures 10 and 11 contain sets of three plots for each type of sample and radiant exposure showing the position versus time curves of the vapor and particle fronts, T(t), and a comparison between the shapes of the incident pulse and the pulse at the sample’s surface. T(t) was calculated using Eq. (2) with the extinction coefficients of Tables 1 and 2 and the position time curves of Figures 10 and 11. For the particle plume, we used values of the extinction coefficient that were obtained from the mean probe beam transmission during the phase of material ejection. The transmitted pulse shape at the sample’s surface was calculated by multiplying the incident laser pulse shape by T(t). Figure 10Transmission of the ablation plume for a radiant exposure of 4.6 J cm−2 for gelatin samples with (a) 70 and (b) 90 water content, (c) for water, and (d) for skin. Each set of plots shows the positions of the vapor front and the particle front as a function of time (top), the transmission of the ablation plume calculated using Eq. 2 (middle), and a comparison of the incident ablation laser pulse with the calculated pulse shape at the sample surface (bottom). 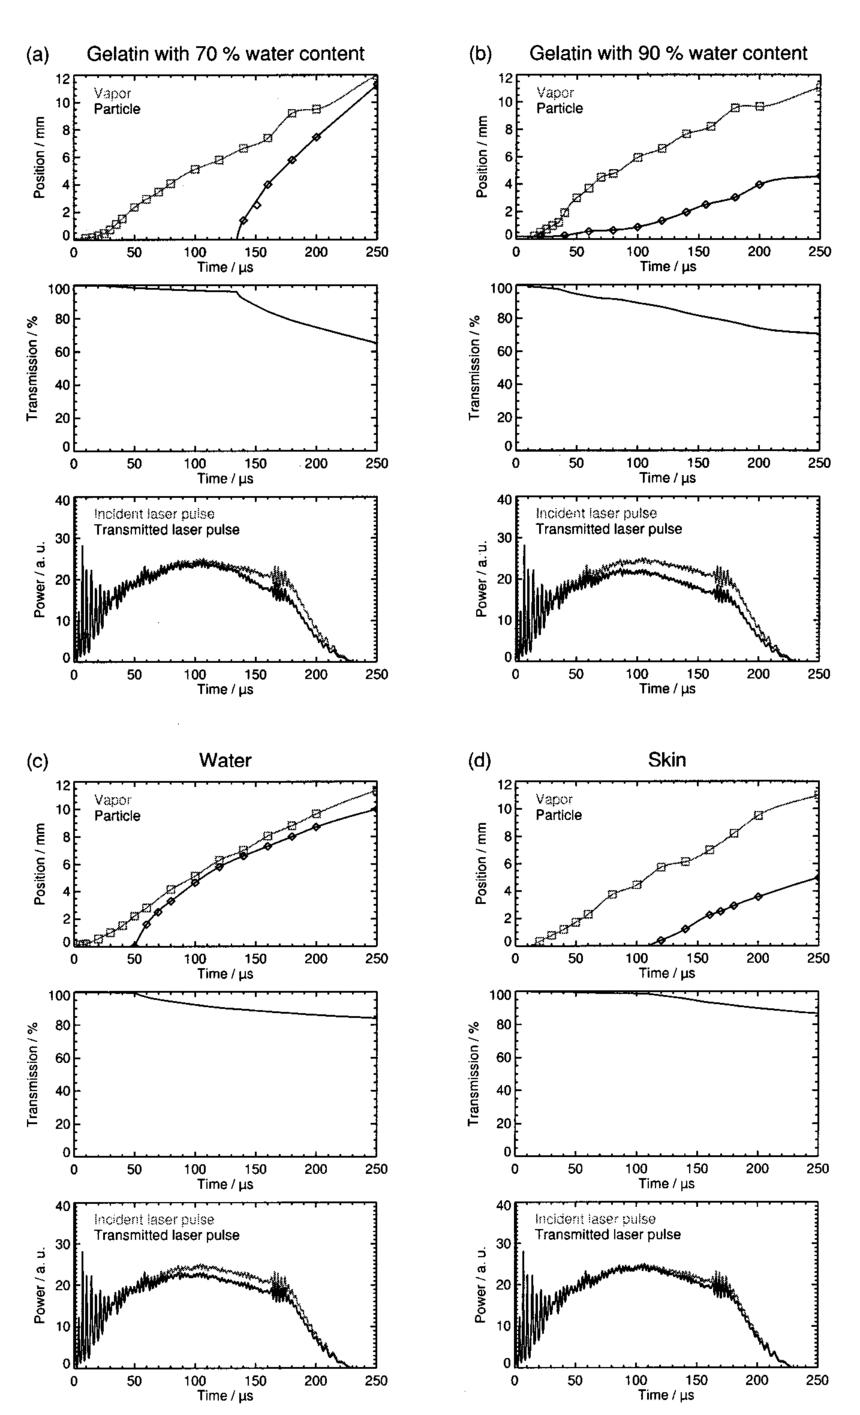 Figure 11Transmission of the ablation plume for a radiant exposure of 7.8 J cm−2 for gelatin samples with (a) 70 and (b) 90 water content, (c) for water, and (d) for skin. Each set of plots shows the positions of the vapor front and the particle front as a function of time (top), the transmission of the ablation plume calculated using Eq. 2 (middle), and a comparison of the incident ablation laser pulse with the calculated pulse shape at the sample surface (bottom). 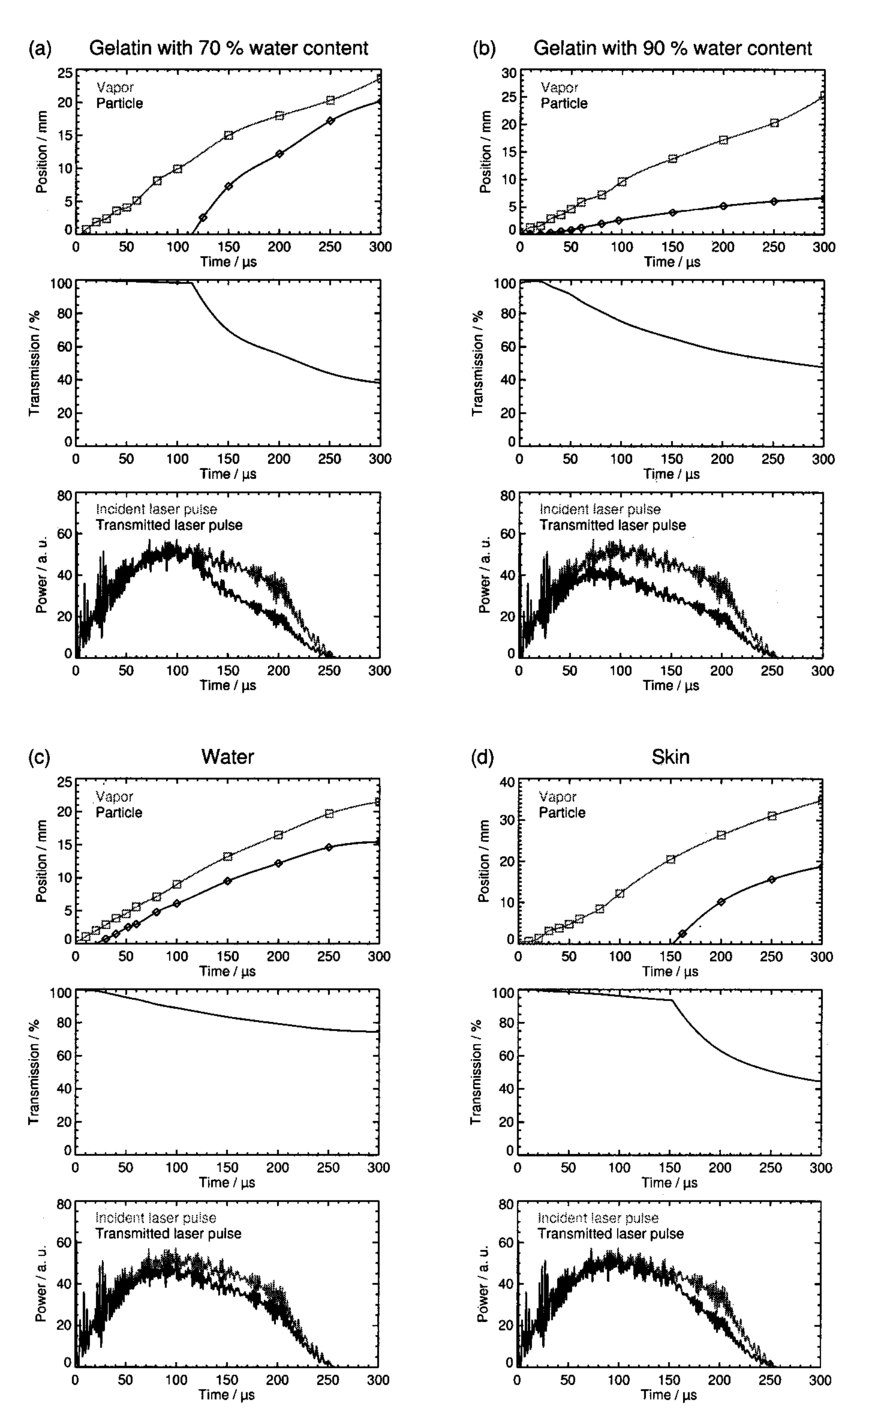 The plots in Figures 10 and 11 show that the transmission of the ablation laser pulse does not decrease significantly before material ejection starts. The extinction coefficient of the vapor plume is too small to cause significant attenuation of the laser beam. The temporal evolution and the extent of the transmission reduction are, therefore, governed mainly by material ejection. Three factors play a role: (i) the onset of material ejection, (ii) the extinction coefficient αvp of the particle plume, and (iii) the velocity of the particle front. A higher velocity of the ejected material leads to a longer path length of the incident light through the ablation plume and thus to a stronger shielding effect if αvp and the onset of material ejection are the same. The overall transmission reduction is most pronounced for gelatin with 90 water content because material ejection starts earlier than for the other samples, and the extinction coefficient of the particle plume is larger (Tables 1 and 2). The shielding is stronger at a radiant exposure of 7.8 J cm−2 than at 4.6 J cm−2 because the particles ejected are faster and αvp is larger at the higher radiant exposure. The reduction in transmission starts relatively late for gelatin with 70 water content and, in particular, for skin because material ejection here is initially inhibited by the tissue matrix. For a radiant exposure of 7.8 J cm−2, the transmission drops, nevertheless, to about 50 until the end of the laser pulse because the particles are ejected very fast. The shielding effects during the ablation of water are relatively weak throughout the entire laser pulse even though material ejection occurs fairly early. This can be explained by the small size of the droplets ejected and by their small number density after the end of the phase explosion (Sec. 3.2.1). The extinction coefficient of the particle plume is, therefore, considerably smaller than for all other samples. 3.2.4.Energy DepositedThe fraction of laser pulse energy deposited into the sample was determined by calculating the ratio of the time integral over the pulse shape transmitted through the ablation plane and incident onto the plume. The results are listed in Table 3. For each sample, an upper and lower estimate of the deposited energy is given based on the extinction coefficients of the ejected material derived from the mean and minimum transmission of the probe beam during the phase of material ejection (Tables 1 and 2). Table 3
The fraction of transmitted laser pulse energy is lowest for the ablation of gelatin samples with 90 water content. For a radiant exposure of 7.8 J cm−2, only 61–74 of the incident laser pulse energy is deposited into the sample (lower and upper estimates in Table 3). The low transmission through the ablation plume is caused by the early onset of material ejection and the relatively high extinction coefficient of the material ejected. For water, gelatin samples with 70 water content, and skin, the upper estimates for the fraction of transmitted pulse energy range between 83 and 89, and the lower estimates between 77 and 86 (at 7.8 J cm−2). We can conclude that for the radiant exposures investigated, up to 39 of the laser pulse energy is absorbed in the ablation plume. The relatively small radiant exposures of up to 7.8 J cm−2 used in our study are typical of large area ablations. One example of an application deploying small radiant exposures is skin resurfacing for which values of 5–8 J cm−2 are commonly used.1 2 3 In some new therapeutic settings, however, radiant exposures of up to 21 J cm−2 are applied.4 5 Much higher radiant exposures of up to 250 J cm−2 are employed for cutting and drilling tissue.27 28 In these cases, shielding will play an even stronger role because the fraction of the pulse energy transmitted to the target decreases with an increase in radiant exposure (Table 3). The estimates given for the extinction coefficient of ejected material are based on measurements of the plume transmission performed 2.5 mm from the sample surface. However, the particle density of the ejected material has already decreased until the particle front reaches the probe beam location, as can be seen from the photographs (Figure 6). The values of the extinction coefficient and of the reduction in energy deposition given here are, therefore, a lower estimate of the real values. Consideration of the shielding effects is certainly relevant for determination of the dosage for clinical laser applications, but it is even more important with respect to a theoretical understanding of the ablation process. The shielding by the ablation plume, for example, has to be considered for the calculation of ablation enthalpies. Data on ablation enthalpies found in the literature have to be reanalyzed because the influence of the ablation plume on the energy deposition was often ignored in previous investigations. Future models of free-running Er:YAG laser ablation of soft tissue should consider, likewise, material ejection during the laser pulse and shielding by the ablation plume. 3.2.5.Comparison with the Results of Previous InvestigationsThe present study, to our knowledge, presents the first direct measurements of the absorption characteristics of the ablation plume at the wavelength of the Er:YAG laser. All previous estimations of the influence of the ablation plume were based on comparisons between ablation rate measurements and the predictions of theoretical models in which the extinction coefficient serves as a fit parameter and the depth of the ablation crater was assumed to be equal to the interaction length between the laser beam and debris. Izatt et al.;9 proposed a debris attenuation model to explain the discrepancy between the ablation depths measured during HF laser ablation of bone with pulse durations of 350 ns and the predictions of a simple steady state ablation model. The debris attenuation model assumes a constant absorption coefficient of the ablation plume which is used as a fit parameter in calculating the ablation depth. A second assumption made in the calculations is that the interaction length between the laser beam and the debris is equal to the depth of the ablation crater. This assumption is correct only if material ejection starts after the end of the laser pulse, i.e., for very short laser pulses where a blow-off model29 30 is appropriate to describe ablation. However, if the ablation and thus material ejection already start during the laser pulse, as assumed in the steady state model, the interaction length for the attenuation of the laser beam is greater than the crater depth. The extinction coefficients obtained using Izatt et al.;’s approach (36–192 cm−1, depending on the wavelength of the HF laser) are, therefore, always larger than the real values. The error becomes all the larger the higher the ablation plume grows above the sample’s surface, i.e., it increases for long pulse durations and high radiant exposures. It is worth mentioning, however, that Izatt et al.;’s model may yield realistic values for the fraction of incident laser energy that is transmitted through the debris and deposited into the sample. In this calculation, the systematic errors of the extinction coefficient and interaction length compensate for each other. Majaron et al.;10 refined the simple debris attenuation model by assuming a time dependent extinction coefficient. The extinction coefficient is described as a function of the rate of material ejection which itself depends on the attenuation of the incident laser beam by the debris already ejected. Majaron et al.; used the model to explain the dependence among the ablation rate, radiant exposure, and pulse duration in free-running Er:YAG laser ablation of dentin with radiant exposures of up to 150 J cm−2 and pulse durations of between 100 μs and 1 ms. A comparison of model predictions with ablation depths measured for high irradiances (i.e., high radiant exposure and/or short pulse duration) led to the result that only 40 of the laser light reaches the sample at the end of the laser pulse. As with Izatt et al.;’s simpler approach, the extinction coefficient given by Majaron et al.; (210±30 cm −1) is much too high because the basic assumption that the interaction length of the laser beam with the debris is equal to the ablation depth is not correct. For pulse durations between 100 μs and 1 ms, the ablation plume reaches a height of several millimeters during the laser pulse, as demonstrated in Figures 10 and 11 of the present study. The interaction length is thus two orders of magnitude larger than the depth of the ablation crater. Hibst and Kaufmann31 and Hibst12 applied the debris attenuation model developed by Izatt et al.;9 to the ablation of skin and bone with midinfrared lasers. For the ablation of skin with free-running Er:YAG laser pulses they observed a linear increase in the ablation rate for radiant exposure ranging from 2 to 12 J cm−2.12 31 Since a linear dependence between the ablation rate and radiant exposure is predicted by a steady state model which neglects any shielding effect, Hibst and Kaufmann concluded that the energy deposition is not at all influenced by the ablation plume and that no ejected tissue particles are present in the plume above the ablation site. For the ablation of bone with radiant exposures between 10 and 1600 J cm−2, in contrast, Hibst12 came to the conclusion that significant attenuation of the laser beam takes place in the ablation plume because the ablation rate showed a sublinear increase. He derived an extinction coefficient of 288 cm−1, making the same unrealistic assumption about the interaction length as Izatt et al.;9 and Majaron et al.;10 The conclusions drawn by Hibst for the ablation of skin (no absorption in the plume, no particles ejected above the ablation site) are in contrast to the experimental results found in the present study. Measurements of the ablation rate for skin showed a linear increase of the ablation rate for radiant exposures ranging from 1 to 8 J cm−2,13 similar to the results reported by Hibst.12 31 However, photographs of the ablation dynamics showed ejected particles in the path of the ablation laser beam,13 and direct measurements of the extinction coefficient of the ablation plume demonstrated that a considerable amount of the incident laser pulse energy is absorbed by the ablation plume. These findings show that conclusions about the shielding efficiency of the ablation plume and about the mechanisms of infrared laser ablation drawn only from ablation rate measurements can be very misleading. 4.ConclusionsShielding by the ablation plume during free-running Er:YAG laser ablation of soft tissue was experimentally investigated for the first time we believe. The influence of the ablation plume on the energy deposition into the sample was studied for the ablation of water, gelatin samples, and skin. A probe beam delivered by a free-running Er:YAG laser was directed through the ablation plume to measure the extinction coefficients of the gaseous as well as of the liquid and solid ablation products. For a better understanding of the temporal evolution of the probe beam transmission, it was compared with the ablation dynamics which were investigated by high speed photography. The photographic investigations revealed that material ejection during the ablation process is the key feature governing shielding by the ablation plume. A particularly interesting observation was that explosive material ejection occurs even during the irradiation of pure water, i.e., without the influence of a tissue matrix. The ejection of water droplets mixed with vapor can only be explained by a phase explosion. The presence of a tissue matrix can delay the phase explosion but will not completely change the driving force for material ejection, because the tissue water is the most important absorber at the Er:YAG laser wavelength. Our results thus provide strong evidence that material removal by free-running Er:YAG laser pulses is driven by a phase explosion. We conclude that this kind of phase transition does not only occur during Q-switched IR laser ablation as was suggested by Venugopalan et al.;32 Shielding leads to a considerable reduction of energy deposition in the sample. For gelatin samples with 90 water content, for example, only about 61 of the laser pulse energy is deposited into the sample at a radiant exposure of 7.8 J cm−2. Even for skin, where we observed the lowest attenuation of the ablation pulse, only 86 of the laser energy is deposited into the sample. These results demonstrate that debris shielding plays a role not only in hard tissue ablation but also during the ablation of soft tissues. The values for the extinction coefficient of the particle plume during soft tissue ablation with 200 μs Er:YAG laser pulses at 7.8 J cm−2 range from 0.6 (for skin) to 1.7 cm−2 (for gelatin with 90 water content). Material ejection and shielding by the ablation plume must be considered in theoretical models for ablation dynamics, calculations of the ablation enthalpy, and in the dosimetry for clinical applications of free-running Er:YAG lasers. AcknowledgmentsThis work was funded by the German Ministry for Education and Research (BMBF Grant No. 13N7240). The authors thank Asclepion-Meditec, Jena, Germany, for providing the high energy Er:YAG laser system. REFERENCES
T. S. Alster
,
“Clinical and histological evaluation of six erbium:YAG lasers for cutaneous resurfacing,”
Lasers Surg. Med. , 24
(2), 87
–92
(1999). Google Scholar
K. A. Khatri
,
V. Ross
,
J. M. Grevelink
,
C. M. Magro
, and
R. Anderson
,
“Comparison of erbium:YAG and carbon dioxide laser in resurfacing of facial rhytides,”
Arch. Dermatol. , 135
(4), 391
–397
(1999). Google Scholar
C. Weinstein
,
“Computerized scanning erbium:YAG laser for skin resurfacing,”
Dermatol. Surg. , 24
(1), 83
–89
(1998). Google Scholar
C. Weinstein
,
“Erbium laser resurfacing: Current concepts,”
Plast. Reconstr. Surg. , 103
(2), 602
–616
(1999). Google Scholar
R. A. Weiss
,
A. C. Harrington
,
R. C. Pfau
,
M. A. Weiss
, and
S. Marwaha
,
“Perorbital skin resurfacing using high energy erbium:YAG laser: Results in 50 patients,”
Lasers Surg. Med. , 24
(2), 81
–86
(1999). Google Scholar
K. Nahen
and
A. Vogel
,
“Investigations on acoustic on-line monitoring of IR laser ablation of burned skin,”
Lasers Surg. Med. , 25
(1), 69
–78
(1999). Google Scholar
K. Nahen
and
A. Vogel
,
“Acoustic signal characteristics during IR laser ablation, and their consequences for acoustic tissue discrimination,”
Proc. SPIE , 3914 166
–176
(2000). Google Scholar
K. Nahen
,
W. Eisenbeib
, and
A. Vogel
,
“Acoustic online monitoring of IR laser ablation of burnt skin,”
Proc. SPIE , 3916 218
–226
(2000). Google Scholar
J. A. Izatt
,
N. D. Sankrey
,
F. Partovi
,
M. Fitzmaurice
,
R. P. Rava
,
I. Itzkan
, and
M. S. Feld
,
“Ablation of calcified biological tissue using pulsed hydrogen fluoride laser radiation,”
IEEE J. Quantum Electron. , 26
(12), 2261
–2270
(1990). Google Scholar
B. Majaron
,
D. Sustercic
,
M. Lukac
,
M. Skaleric
, and
N. Funduk
,
“Heat diffusion and debris screening in Er:YAG laser ablation of hard biological tissues,”
Appl. Phys. B: Lasers Opt. , B66
(4), 479
–487
(1998). Google Scholar
R. Hibst
and
U. Keller
,
“The mechanism of Er:YAG laser induced ablation of dental hard substances,”
Proc. SPIE , 1880 156
–162
(1993). Google Scholar
A. Miotello
and
R. Kelly
,
“Critical assessment of thermal models for laser sputtering at high fluences,”
Appl. Phys. Lett. , 67
(24), 3535
–3537
(1995). Google Scholar
A. D. Zweig
and
H. P. Weber
,
“Mechanical and thermal parameters in pulsed laser cutting of tissue,”
IEEE J. Quantum Electron. , QE-23
(10), 1787
–1793
(1987). Google Scholar
B. Majaron
,
P. Plestenjak
, and
M. Lukac
,
“Thermo-mechanical laser ablation of soft biological tissue: modeling the micro-explosions,”
Appl. Phys. B: Lasers Opt. , B69
(1), 71
–80
(1999). Google Scholar
M. M. Martynyuk
,
“Phase explosion of a metastable fluid,”
Combust., Explos. Shock Waves , 13
(2), 178
–191
(1977). Google Scholar
D. E. Freund
,
R. L. McCally
,
R. A. Farrall
, and
D. H. Sliney
,
“A theoretical comparison of retinal temperature changes resulting from exposure to rectangular and gaussian beams,”
Lasers Life Sci. , 7
(2), 71
–89
(1996). Google Scholar
J. T. Walsh
and
J. P. Cummings
,
“Effect of the dynamic optical properties of water on midinfrared laser ablation,”
Lasers Surg. Med. , 15 295
–305
(1994). Google Scholar
J. S. Young
,
“Evaluation of nonisothermal band model for
H2O,
,”
J. Quant. Spectrosc. Radiat. Transf. , 18
(1), 29
–45
(1977). Google Scholar
M. Frenz
,
V. Romano
,
Y. D. Zweig
, and
H. P. Weber
,
“Instabilities in laser cutting of soft tissue,”
J. Appl. Phys. , 66
(9), 4496
–4503
(1989). Google Scholar
A. D. Zweig
,
M. Frenz
,
V. Romano
, and
H. P. Weber
,
“A comparative study of laser tissue interaction at 2.94 μm and 10.6 μm,”
Appl. Phys. B: Lasers Opt. , B47
(3), 259
–265
(1988). Google Scholar
H. H. G. Jellinek
and
R. Srinivasan
,
“Theory of etching of polymers by far-ultraviolet, high-intensity pulsed laser and long-term irradiation,”
J. Phys. Chem. , 88 3048
–3051
(1984). Google Scholar
J. T. Walsh
,
T. J. Flotte
,
R. R. Anderson
, and
T. F. Deutsch
,
“Pulsed
CO2
laser tissue ablation: Effect of tissue type and pulse duration on thermal damage,”
Lasers Surg. Med. , 8 108
–118
(1988). Google Scholar
R. Hibst
and
R. Kaufmann
,
“Comparison of different mid-infrared lasers for the ablation of skin,”
Lasermedizin , 11 19
–26
(1995). Google Scholar
V. Venugopalan
,
N. S. Nishioka
, and
B. B. Mikic
,
“Thermodynamic response of soft biological tissue to pulsed infrared-laser irradiation,”
Biophys. J. , 70
(6), 2981
–2993
(1996). Google Scholar
|
||||||||||||||||||||||||||||||||||||||||||||||||||||||||||||||||||||||||||||||||||||||||||||||||||||||||||||||||||||||||||||||||||||||||||||||


CITATIONS
Cited by 55 scholarly publications.
Laser ablation
Pulsed laser operation
Laser beam diagnostics
Er:YAG lasers
Mass attenuation coefficient
Skin
Photography


