
1.IntroductionDerangements in the collagen structure and function play a pivotal role in a wide range of pathophysiological conditions, including aging. Historically, collagen has been studied using histological, morphological, physicochemical, and biochemical assays. These assays are destructive, and have required tissue obtained by biopsy or at autopsy. Nondestructive available imaging techniques have not addressed themselves to the scale necessary for analyzing the molecular architecture of collagen. Recently, we described an approach for analyzing collagen in vivo based on its nonlinear optical properties: analysis of second harmonic generation using an ultrashort pulse laser.1 2 3 The first study of the second harmonic generation (SHG) in biological tissues was performed in 1971.4 The earliest studies of the harmonic signal in type I collagen of a rat-tail tendon were reported in a series of exhaustive studies by investigators more than 20 years ago.5 6 7 The use of transmission-mode detection and the absence of ultrashort pulse laser technology forced researchers in these previous studies to stretch and compress the sample to one tenth of its original thickness, thereby distorting, and possibly damaging, the fibrillar structure. Furthermore, second harmonic generation or its polarization dependence could not be measured directly as a function of position in the sample with good resolution, due to the large focal spot size. These problems have been largely addressed by the advent of short-pulse laser technology. The damage threshold intensity scales approximately as where τ is the pulse duration.8 Therefore, short-pulse lasers allow smaller focal spot sizes—higher resolution—without causing damage. SHG using short-pulse lasers (nanosecond to femtosecond) has been observed by other investigators in teeth,9 in chicken skin,10 11 and in a variety of other biological tissues.12 13 In the present study we report on a systematic analysis of type I collagen in a rat-tail tendon fascicle. We selected this particular tissue for study for several reasons. First, the fascicle is sufficiently small for detailed SHG scanning along several planes, and yet is also a well-defined anatomic structure. Thus, multiple samples with almost identical characteristics can be easily prepared. Second, the fascicle structure has been extremely well characterized at both the molecular and supramolecular level. Third, we have previously determined that type I collagen from fascicles consistently provides one of the strongest SHG signals of the various tissues we have analyzed, perhaps in part due to its highly ordered architecture. We describe a modification of our initial imaging method2 that allows polarization dependent scans. We also report on scanning conditions that allow SHG measurement of a rat-tail tendon without causing damage. A model for polarization dependent SHG in a rat-tail tendon is used to determine the orientation of the collagen fibrils and to investigate the second order nonlinear susceptibility tensor. The results of the model, which assumes that the dependence of backscattering in the fascicle on the polarization is negligible, agree well with the measurements. 2.Experimental Setup2.1.Sample PreparationA rat-tail tendon, dissected from the tails of 350 g Sprague-Dawley rats, was stored at −80 °C until used. We previously had found that freezing and thawing did not affect the second harmonic signal. Individual tendon fascicles were removed from the tendon bundles under a dissecting microscope; fascicles were identified by the characteristic striations constituting the crimp angle. Typical fascicles were several centimeters long, but had a diameter of only a few tenths of a millimeter. Dry fascicles were gently compressed between two glass slides in order to provide a more uniform surface normal to the laser beam. The fascicles were not stretched, allowing the naturally crimped structure to remain. 2.2.Optical SetupWe used a Ti:sapphire oscillator (Spectra-Physics Tsunami) to generate linearly polarized 100 fs pulses at a wavelength of 800 nm and with a maximum energy of 10 nJ and at a repetition rate of 82 MHz. The beam was optically chopped at 1.5 kHz for lock-in amplification of the signal. The beam passed through a half-wave plate followed by a polarizing beamsplitter; the half-wave plate was rotated to control the power incident on the sample. A second half-wave plate placed after the beamsplitter was used to rotate the linear polarization. A long-wave pass filter with a cutoff at 700 nm was used to filter out any spurious SHG generated in the system. A dichroic mirror reflected the beam into a microscope objective, through which it was focused onto a sample mounted on a three-dimensional, computer-controlled translation stage. The backscattered second harmonic signal was collimated by the same objective and passed through the dichroic mirror. The signal was focused through a 50 μm pinhole and recollimated using a pair of lenses (f=5 cm). Use of a pinhole provides enhanced transverse and axial resolution,14 beyond the high resolution provided by the fact that the nonlinear interaction depends on the square of the intensity. Several dichroic mirrors were used to reject the first harmonic and reflected only the second harmonic signal onto a photomultiplier tube (PMT). The PMT signal was lock-in amplified using a lock-in amplifier (Stanford Research Systems, SR830). The experimental setup is shown in Figure 1. A Labview program was used to coordinate motion of the translation stage and to acquire data from the lock-in amplifier. The microscope objective (Mitutoyo infinity-corrected Plano Apochromat) that focused the beam onto the sample and collected the backscattered second harmonic signal had a focal length f=1 cm and numerical aperture NA=0.42. Using a knife-edge scan of the beam at the focal spot, we determined that the objective had a transverse resolution of about 1.5 μm and an axial resolution of about 10 μm (inside scattering media, both numbers are increased). We measure the laser beam power before the dichroic mirror and the microscope objective, using a laser power meter (Molectron). Neglecting losses in these two elements, the maximum intensity at the sample was about 4×10¹¹ W/cm 2. 3.TheoryType I collagen, one of more than 17 genetically distinct collagens, is a triple helix about 300 nm in length and 1 nm wide. Two of the polypeptide chains in the helix are identical; the third differs in primary structure.15 As collagen molecules are secreted by cells into the matrix, they self-organize into arrays in which each molecule is offset from its neighboring molecule by approximately of its length. In some tissues, type I collagen is characterized by a striking degree of hierarchical organization. Once the molecules have aligned themselves, they may undergo progressively more complex degrees of organization into structures such as microfibrils, fibrils, and fascicles. Microfibrils consist of five or six individual collagen molecules arranged into a bundle with a diameter of about 4 nm. The microfibrils may then twist around each other to form a larger bundle called a fibril. This fibril is, essentially, a suprahelical structure with a diameter ranging from 20 to 500 nm.16 17 18 Fibrils may be further organized into structures called fascicles, bundles surrounded by fascia that can be seen with the naked eye. Fascicles have a structural feature called crimp, in which some components of the bundle appear to be offset from the long axis by approximately 15° in a zigzag pattern. The organization of rat-tail tendon collagen is relatively straightforward, consisting of bundles of parallel fascicles. The helical and suprahelical characteristics of collagen may be pertinent to its ability to generate an exceptionally strong harmonic signal. Supramolecular chirality on a scale smaller than the wavelength can enhance the second-order nonlinear molecular susceptibility.19 20 If organized structure is present only at scales much smaller than the wavelength, then the medium appears isotropic to the laser light and second harmonic signal is eliminated due to interference. Supramolecular organization on a scale larger than the wavelength can lead to coherent instead of an incoherent SHG.21 For the cylindrical structure of collagen fibrils (C∞ symmetry), the most general vector expression for the polarization dependence of second harmonic generation is where s represents the unit vector along the fibril axis, E 1 is the input electric field, and a, b, and c are coefficients related to the second order nonlinear susceptibility of the material. If the second harmonic frequency is far below the first electronic resonance, which is the case for collagen, then the nonlinear susceptibility tensor can be permuted over all indices (Kleinman symmetry). In our notation, this additional symmetry simply gives c=2b, and we haveThis is the same physical model as was used in previous studies,5 6 7 but the notation used makes it easier to average over a number of different fibril directions. A general expression for second harmonic intensity in the limit where the propagation distance z is much larger than the wavelength λ (so that the paraxial approximation is valid) and where pump depletion can be neglected is22 where we define The unit vectors, e 1 and e 2, are in the direction of E 1 and P, respectively. The wave vector of the input field is given by k 1 and the wave vector of the second harmonic field is given by k 2; q=2k 1−k 2 is the phase mismatch. I1 is the intensity of the laser beam incident on the sample. We should note that in the limit of extremely tight focusing of the beam, the plane wave approximation used in these calculations breaks down.If we further assume that birefringence can be neglected (q is independent of polarization directions), the polarization dependence in Eq. (3) reduces to Plugging Eq. (2) for P into Eq. (4) for η, we have Let us assume that the fibril bundle lies parallel to the y axis. We take the input beam to be along the z axis and the beam polarization to be in the x–y plane. We let α denote the angle the input polarization vector makes with respect to the x axis. This geometry is illustrated in Figure 2. There are two independent polarization directions of the second harmonic signal. We arbitrarily choose one component polarized parallel to the input field and one component polarized perpendicular to the input field. We calculate η par for the second harmonic field polarized parallel to the input field and η perp for the second harmonic field polarized perpendicular to the input field. Since we are interested in relative results, we drop a constant factor in the expression for η and let γ=b/a. So The second harmonic signal is proportional to the sum of the intensities in the two orthogonal directionsSubstituting Eqs. (7a) and (7b) into Eq. (8) gives us Let us consider the behavior of second harmonic generation as a function of γ. We let sin α=w and investigate the behavior of this expression as a function of w for values of 0<α<π/2 (0<w<1). We have From the first derivative, the local extrema are calculated to be and Therefore, for γ>0, the function is monotonic, while for γ<0, local maxima and minima are present. The sign of the extrema can be calculated by evaluating the second derivative at the values of w where extrema occur. The calculated value for the second derivative at both extrema is −8γ(1+4γ). So, for γ<−1/4, the extremum is a minimum, and for −1/4<γ<0, the extremum is a maximum. This can readily be seen in the plots shown in Figure 3. What does the value γ=−1/4 mean physically? In order to understand this, we must write the expressions for P2x and P2y, the second order nonlinear polarization perpendicular to the collagen axis and parallel to the collagen axis, respectively. For simplicity, we assume that the incident radiation is polarized at a 45° angle to the collagen axis, α=π/4. From Eq. (2), we then have, C is some arbitrary real constant. Now, when γ>−1/4, both the second order polarization perpendicular and parallel to the collagen axis are in the same direction as the incident beam polarization is. However, when γ<−1/4, one component of the induced polarization is opposite to the incident beam polarization.Figure 3Plot of theoretical dependence of the second harmonic signal on w=sin α, for different values of γ. 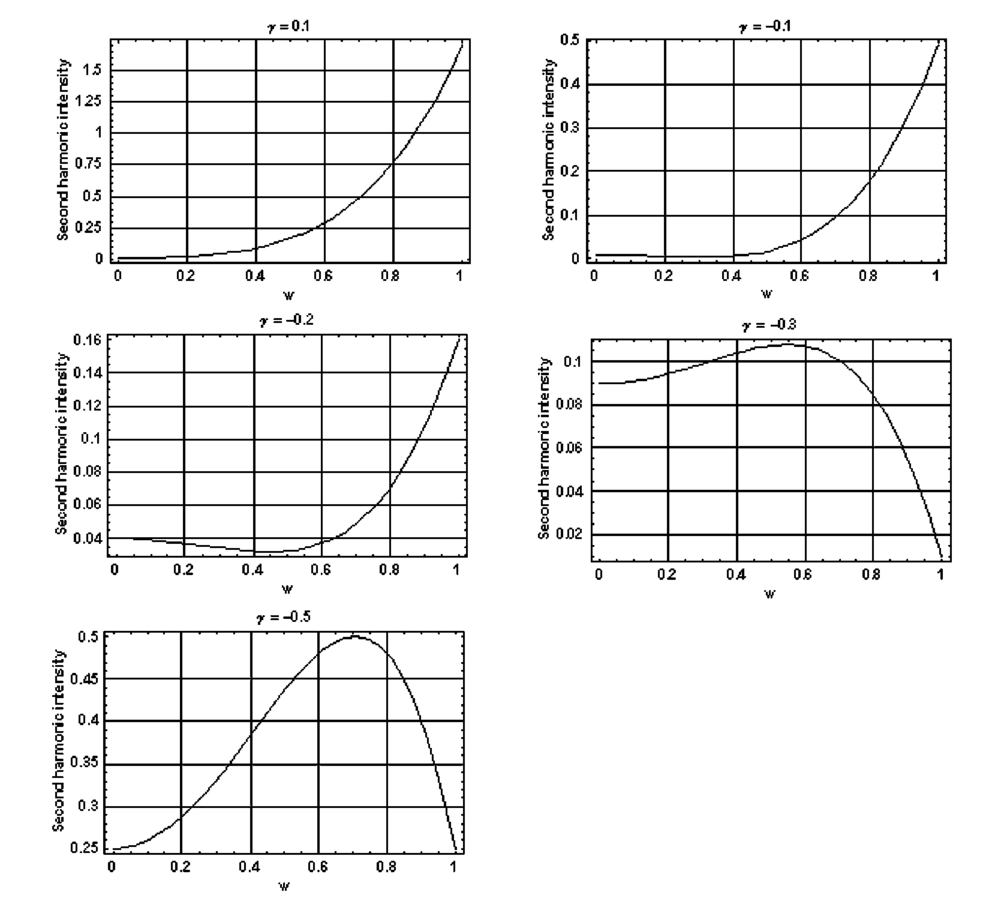 Before applying this model, we must determine whether a small angular spread in the alignment of the collagen fibrils has a substantial effect on the measurement. For this purpose, the angle θ of the fibril from the tendon axis is assumed to have a Gaussian distribution We take θ0 to be 15°, which is larger than the actual spread of angles we expect to see in rat-tail tendon fibril bundles. Figure 4 shows the behavior of I SHG as a function of input polarization angle α for different values of the ratio γ that are relevant to the experimental results. Each plot in Figure 4 shows the I SHG curves that result both when we assume all of the fibrils are oriented along one direction and when we average over different orientations of the fibril about the tendon axis. Introducing a spread into the model results in a reduction of the ratio between the maximum and minimum second harmonic signals.Figure 4Plots of theoretical calculations of the SHG polarization dependence for a rat-tail tendon structure. The plots show the predicted SHG intensity (arbitrary units) as a function of polarization angle, α, for different values of γ. The dashed line indicates the curve calculated for no angular spread and the solid line indicates the curve for an angular spread with θ0=15°. 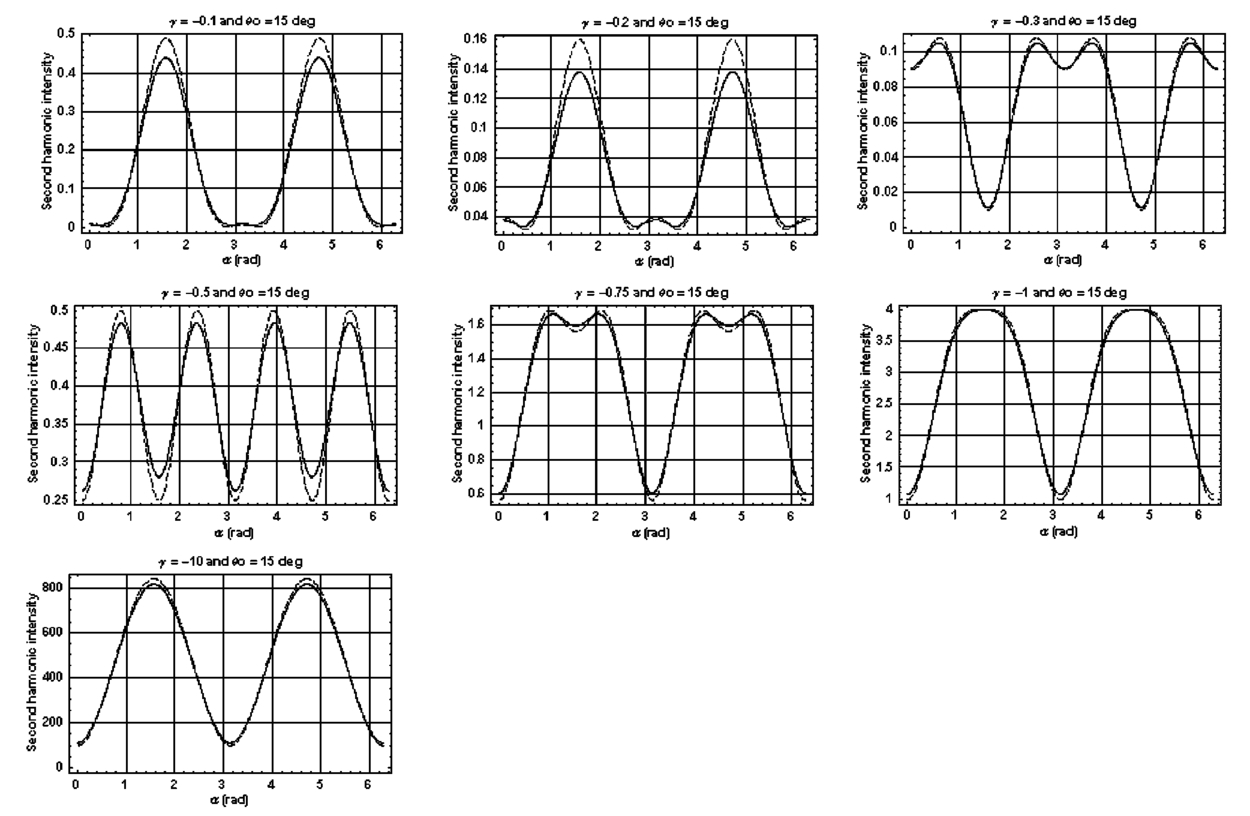 As noted earlier, the fibrils are crimped and are not aligned exactly with the tendon axis. We are able to observe differences in orientation by observing changes in the values of the polarization angles where the maximum and minimum second harmonic signals are observed. How does this theory apply to second harmonic generation in the backscattered direction? Direct production of SHG in the backscattered direction is an extremely weak process because the phase mismatch q is of order 4k. Because the sample volume is much larger than 1/4k (the Rayleigh range for the focused beam is about 10 μm), the second harmonic light generated will interfere destructively and be greatly reduced. However, the second harmonic could be generated in the forward direction within the beam waist and then scattered back by nonuniformities within the sample. Second harmonic light can also be reflected at the sample-glass slide boundary. Such a reflection could also occur in vivo, even in optically thick samples, at the boundaries between different layers of tissue. 4.Results4.1.Scanning Techniques to Avoid DamageThere are two techniques for measuring the harmonic signal. In both cases, the sample is moved through the fixed focal spot of the laser beam using a translation stage. In the first method, the signal is measured at specific points on the sample separated by the distance of the scan resolution. The sample acquisition time is determined by the lock-in amplifier time constant necessary to obtain a good signal-to-noise ratio; in our experiment, it ranged between 30 and 300 ms. With this method certain points on the sample are exposed to millions of repeated high intensity pulses. In the second method the beam is slowly moved across the sample such that two or three time constants elapse during the time it traverses a distance equal to the scan resolution. We were concerned that the first method might ultimately damage tissue, since the heat generated after each pulse may not dissipate completely before the next pulse.23 We therefore compared the effects of sequential scanning using the two techniques on a rat fascicle. We interpreted a decrease in the harmonic signal as evidence of structural alteration by the laser. Figure 5 shows repeated axial scans using 1 μm steps of the same point on a fascicle from a dried rat-tail tendon using a focused peak intensity of 4×10¹⁰ W/cm 2. The repeated scans show that the second harmonic signal changes from scan to scan; however, the signal is not simply attenuated slowly by the damage. Instead, the peak signal fluctuates and moves deeper and deeper into the tissue. The damage to the tissue closer to the surface may make it more transparent—either to the first harmonic input beam or to the backscattered second harmonic signal. The intense beam is not ablating tissue because no visible damage is observed under a microscope. Figure 5Plot of repeated axial scans of a rat-tail tendon fascicle using 1 μm steps. The surface of the fascicle is approximately at z=0; depth in the tissue increases with negative z. Scans are shown in order of increasing scan number from left to right and then top to bottom. Peak intensity at the focus is 4×10¹⁰ W/cm 2. Signal strength is displayed in arbitrary units using the same scale for all plots.  By acquiring data as the sample is slowly scanned over a distance equal to the resolution (during a time equal to two or three time constants), damage can be avoided without reducing the power of the input beam. Using a peak intensity of 2×10¹¹ W/cm 2, and a scan speed of 8 μm/s or less avoids damage to the sample [Figure 6(a)]. If the sample is scanned slowly enough, however, damage can still occur. As can be seen in Figure 6(b) (using a scan speed of 4 μm/s), the damage only occurs in the region of the strongest second harmonic signal. The damage threshold for a rat-tail tendon varies as a function of position along the sample by a factor of about 2. The disadvantage to continuous scanning is that scans at different polarizations must be performed in series. Using an electro-optic modulator or a liquid crystal modulator, the polarization could be rotated rapidly at each scan point. However, if the sample is moving slowly at the same time as the polarization is being rotated, then changes in the collagen structure at small scales may appear as a polarization dependent signal. 4.2.Polarization Dependent Scans of a Rat-tail Tendon FascicleUsing our confocal scanning technique, we are able to directly measure the SHG as a function of the position along the fascicle axis, position normal to the fascicle axis and the laser beam, and depth into the fascicle along the laser beam (Figure 2). Figure 7, for example, shows a two-dimensional scan of second harmonic signal in a cross section of the fascicle, taken using the continuous scanning technique—which was used to generate all of the images we present here. Figure 7Two-dimensional scan of the cross section of a rat-tail tendon. The SHG intensity is in arbitrary, linear units. The point z=0 corresponds approximately to the surface of the rat-tail tendon. Data was acquired with a resolution of 5 μm in both the x and z directions.  The second harmonic signal varies from cross section to cross section along the length of the fascicle; the peak signal varies by a factor of about 2 or 3 between the scans of the different cross sections. Stretching the tendon to remove the crimp, or moistening the tendon did not change the signal intensity significantly. Given the 800 nm wavelength and the 1.5 μm spot size, parallel orientation of the collagen fibrils on the scale of 1 μm is required in order to observe strong second harmonic signals. Figure 8 shows successive axial second harmonic images (linear scale) for input polarizations of 0°–360° in steps of 10°. The polarization angle is defined as shown in Figure 2; 90° polarization corresponds to light polarized along the fascicle axis. The axial scans of the rat-tail tendon fascicle indicate that the polarization dependence is constant with depth. The maximum signal intensity occurs when the input polarization is approximately 90°. Since the theory predicts that maximum signal should occur when the crimped fibril bundles are aligned with the polarization, this suggests that the crimped fibril bundles in this part of the fascicle are oriented in the direction of the beam polarization. The image also demonstrates the presence of fibril bundles with strong signals within the tendon—the signal does not decay exponentially with depth, as would be the case in a uniform medium where the input beam is simply attenuated by absorption and scattering. Figure 8One-dimensional axial scan (depth) of a rat-tail tendon for different polarization angles. The SHG intensity is in arbitrary, linear units. The point z=0 corresponds approximately to the surface of the rat-tail tendon. The data was acquired using an axial resolution of 5 μm and steps of 10° for the polarization angle.  Figure 9 shows a graph of the polarization dependence at two specific depths (z=−45 μm and z=−5 μm) together with a least-squares fit to the data of the model given in Eq. (11). We fit two parameters, the constant of proportionality and γ. Although the angle between the fibril bundle and the laser polarization does not seem to change, the γ parameter does vary slightly with depth in the fascicle. From the fit, we obtain values of γ for the two plots shown in Figure 9: at z=−35 μm, γ=−0.83 and at z=−5 μm, γ=−0.71. The measured value of γ does not vary more from cross section to cross section than within the single axial scan shown in Figure 8. Figure 9Second harmonic signal (linear scale) as a function of polarization angle at (a) z=−35 μm and (b) z=−5 μm in the scan shown in Figure 8. Both experimental (solid line with solid circles indicating measurements) and theoretical curves (solid line) are shown.  One-dimensional scans across the rat-tail tendon fascicle—again for polarization angles of 0°–360° in steps of 10°—at an arbitrary depth were also made (see Figure 10 for an example; the relative laser beam-sample orientation is shown in Figure 2). The image in Figure 10, plotted using a logarithmic scale so that weak features are more pronounced, shows multiple peaks in the second harmonic signal. One might expect variations in the second harmonic signal simply because as the cylindrical sample is scanned across the beam focus, the distance through which the incoming laser light and the backscattered light must travel through the tendon changes. However, the sharp peaks observed in the scans are too sharp to be explained by the thickness changes of the fibril; they indicate actual structure changes within the tendon. In addition, the sample was mounted between two glass slides and compressed slightly, in order to provide a more uniform surface. Figure 10One-dimensional transverse scan (at arbitrary depth) of a rat-tail tendon for different polarization angles. The SHG intensity is in arbitrary, logarithmic units. The tendon stretches between about 140 and 380 μm. The data was acquired using a transverse resolution of 5 μm and steps of 10° for the polarization angle. The left (right) vertical black line indicates the polarization angle at which peak intensity was observed for x=370 μm (x=260 μm).  The orientation of the collagen fibril bundles that produce each of the four peaks (around 180, 220, 260, and 370 μm) in Figure 10 is not the same. The strongest polarization effect occurs for the fiber bundles around 370 and 260 μm. The first fiber bundle (370 μm) has a peak polarization of about 55° with respect to the vertical while the second fiber bundle (260 μm) has a peak polarization of about 75°. The rat-tail tendon fascicle is aligned at an angle of 90° (see Figure 2), so the first and second fibril bundles are tilted by 35° and 15°, respectively, from the fascicle axis. Because fibril bundles in an unstretched rat-tail tendon exhibit a characteristic crimped structure, this tilt is not surprising. There are also several polarization sensitive structures in the range between 150 and 220 μm. 5.DiscussionIn this work, we have described SHG analysis in a rat-tail tendon. We have measured the signal intensity and its polarization dependence as a function of position in a rat-tail tendon fascicle. We have determined that a continuous scanning technique allows measurement of the SHG without damaging the sample. We have also observed small regions of higher second harmonic intensity than the average signal level on scales down to the scan resolution of 5 μm. An analytical model has been applied to determine the orientation of the fibrils and to investigate the γ parameter, a key ratio of the elements of the nonlinear susceptibility tensor. The good fit between this model and the experimental data suggests that scattering may not be significantly affected by the polarization of the light. The second harmonic signal intensity varies by about a factor of 2 across the cross section of a single rat-tail tendon fascicle. Several small regions in each scan of a fascicle cross section exist where the signal is significantly above the average level for the fascicle. The signal varies on small spatial scales, down to the scan resolution of 5 μm. Changes in the second harmonic signal intensity can reflect differences in the organization on the scale of the beam focal spot size (approximately 1.5 μm by 10 μm), but they can also indicate the possibility of different backscattering efficiencies at different points in the sample. If differences in the backscattering efficiency were negligible, then less organized structure would be expected to give a weaker signal, since the SHG from disorganized tissue would be more likely to interfere destructively. Evidence for organization on the scale of 5–10 μm has been observed in electron microscopy24 and phase-contrast optical microscopy25 studies. Clearly, however, the second harmonic intensity alone cannot be used to investigate a rat-tail tendon structure. By rotating the angle of the linear polarization and taking the ratio of the signal at different angles, we can eliminate the backscattering efficiency as a variable. Laser light of two different polarizations travels nearly the same trajectory—the birefringence of collagen fibrils is small—and is backscattered at the same boundaries in the tissue. Of course, in order for this technique to work properly, the dependence of the backscattering process on the polarization angle must be small enough. The model for the SHG as a function of the polarization angle that we have developed—which neglects any polarization dependence of the backscattering efficiency—fits the experimental data well using only two parameters. This suggests that we are justified in omitting polarization dependent backscattering from our model of the rat-tail tendon. The model allows us to determine the orientation of collagen fibrils in a rat-tail tendon. The structure of the rat-tail tendon has been extensively studied using electron microscopy, and the parallel fibril bundles indicated by our measurements serve mainly to confirm the usefulness of our technique. Unlike electron microscopy, confocal microscopy of the SHG can be performed in vivo and without extensive sample preparation. We also use our model to determine γ, the ratio between the two independent elements of the second order nonlinear susceptibility tensor, to be about −0.75. The value of γ varies by about 10–20 within a single cross section and also from cross section to cross section. The fact that there is so little variability in the γ parameter suggests that it could be used to characterize a rat-tail tendon collagen structure. The technique we have described could be applied to other collagen tissues. Since collagen structures in various tissues differ greatly, we would expect the γ parameter for the tissues to vary also. If this is indeed the case, it might even be possible to develop new, noninvasive techniques to diagnose diseases that lead to changes in the collagen structure. Furthermore, using this technique, data obtained with different second harmonic detection setups could be compared directly, even though no absolute intensities are measured. In future work, we plan to conduct a series of studies designed to determine which levels of structural organization in type I collagen play the most significant role in second harmonic generation. We plan to conduct a series of studies on collagen preparations in which structural modifications will be induced at both the molecular and supramolecular level. Modifications will be selected that are likely both to enhance the harmonic intensity as well as decrement it. Such experiments may help to elucidate the complex relationship between high intensity light and biologically significant macromolecules. 6.ConclusionWe have observed that the collagen structure of rat-tail tendon fascicles shows a strongly polarized response to the input laser beam in the generation of second harmonic light. We have also determined that while the second harmonic signal intensity changes significantly over a single cross section, the functional form of the polarization dependence does not. Furthermore, our results indicate that while the intensity may fluctuate with backscattering efficiency, the polarization dependence of the signal is not affected by the backscattering process. The measured data can be fit to an analytical model to determine the fibril orientation and the key parameter γ, which gives the ratio between the only two nonzero, independent elements in the second-order nonlinear susceptibility tensor. We calculate values of γ∼−0.8 to −0.7; this small range of values observed in a fascicle suggests that there is structural homogeneity. This parameter might therefore be useful in characterizing different collagen structures noninvasively. AcknowledgmentsThis work was performed under the auspices of the U.S. Department of Energy at Lawrence Livermore National Laboratory under Contract No. W-7405-ENG-48. This work was partially supported by a grant from the Center of Excellence for Laser Applications in Medicine, U.S. Department of Energy Grant No. DE-FG03-98ER62576. REFERENCES
B.-M. Kim
,
J. Eichler
, and
L. B. Da Silva
,
“Frequency doubling of ultrashort laser pulses in biological tissues,”
Appl. Opt. , 38 7145
–7150
(1999). Google Scholar
B.-M. Kim
,
P. Stoller
,
K. M. Reiser
,
J. Eichler
,
M. Yan
,
A. M. Rubenchik
, and
L. B. Da Silva
,
“Confocal imaging of biological tissues using second harmonic generation,”
Proc. SPIE , 3914 435
–440
(2000). Google Scholar
B.-M. Kim
,
J. Eichler
,
K. M. Reiser
,
A. M. Rubenchik
, and
L. B. Da Silva
,
“Collagen Structure and Nonlinear Susceptibility: Effect of Heat, Glycation, and Enzymatic Cleavage on Second Harmonic Signal Intensity,”
Lasers Surg. Med. , 27 329
–335
(2000). Google Scholar
S. Fine
and
W. P. Hansen
,
“Optical second harmonic generation in biological tissues,”
Appl. Opt. , 10 2350
–2353
(1971). Google Scholar
S. Roth
and
I. Freund
,
“Second harmonic generation in collagen,”
J. Chem. Phys. , 70 1637
–1643
(1979). Google Scholar
S. Roth
and
I. Freund
,
“Optical second-harmonic scattering in rat-tail tendon,”
Biopolymers , 20 1271
–1290
(1981). Google Scholar
I. Freund
,
M. Deutsch
, and
A. Sprecher
,
“Connective tissue polarity: Optical second-harmonic microscopy, crossed-beam summation, and small-angle scattering in rat-tail tendon,”
Biophys. J. , 50 693
–712
(1986). Google Scholar
B. C. Stuart
,
M. D. Feit
,
S. Herman
,
A. M. Rubenchik
,
B. W. Shore
, and
M. D. Perry
,
“Nanosecond-to-femtosecond laser-induced breakdown in dielectrics,”
Phys. Rev. B , 53 1749
–1761
(1996). Google Scholar
G. B. Altshuler
,
N. R. Belashenkov
,
G. A. Martsinovski
, and
A. A. Solounin
,
“Nonlinear transmission and second-harmonic generation in dentin in the field of ultrashort ND-laser pulses,”
6
–10
(1995). Google Scholar
Y. Guo
,
P. P. Ho
,
A. Tirksliunas
,
F. Lui
, and
R. R. Alfano
,
“Optical harmonic generation from animal tissues by the use of ps and fs laser pulses,”
Appl. Opt. , 35 6810
–6813
(1996). Google Scholar
Y. Guo
,
P. P. Ho
,
H. Savage
,
D. Harris
,
P. Sacks
,
S. Schantz
,
F. Liu
,
N. Zhadin
, and
R. R. Alfano
,
“Second-harmonic tomography of tissue,”
Opt. Lett. , 22 1323
–1325
(1997). Google Scholar
E. Georgiou
,
T. Theodossiou
,
V. Hovhannisyan
,
K. Politopoulos
,
G. S. Rapti
, and
D. Yova
,
“Second and third optical harmonic generation in type I collagen, by nanosecond laser irradiation, over a broad spectral region,”
Opt. Commun. , 176 253
–260
(2000). Google Scholar
V. Hovanessian
and
A. Lalayan
,
“Second harmonic generation in biofiber-containing tissue,”
Proc. Int. Conf. Lasers , 96 107
–109
(1997). Google Scholar
R. Guaderon
,
P. B. Lukins
, and
C. J. R. Sheppard
,
“Effect of a confocal pinhole in two-photon microscopy,”
Microsc. Res. Tech. , 47 210
–214
(1999). Google Scholar
K. Beck
and
B. Brodsky
,
“Supercoiled protein motifs: the collagen triple-helix and the α-helical coiled coil,”
J. Struct. Biol. , 122 17
–29
(1998). Google Scholar
W. Traub
,
“Molecular assembly in collagen,”
FEBS Lett. , 92 114
–119
(1978). Google Scholar
T. J. Wess
,
A. P. Hammersley
,
L. Wess
, and
A. Miller
,
“A consensus model for molecular packing of Type I collagen,”
J. Struct. Biol. , 122 92
–100
(1998). Google Scholar
D. J. Prockop
and
A. Fertala
,
“The collagen fibril: the almost crystalline structure,”
J. Struct. Biol. , 122 111
–118
(1998). Google Scholar
T. Verbiest
,
S. Van Elshocht
,
M. Kauranen
,
L. Hellemans
,
J. Snauwaert
,
C. Nuckolls
,
T. J. Katz
, and
A. Persoons
,
“Strong enhancement of nonlinear optical properties through supramolecular chirality,”
Science , 282 913
–915
(1999). Google Scholar
M. Kauranen
,
T. Verbiest
, and
A. Persoons
,
“Chiral materials in second-order nonlinear optics,”
J. Nonlinear Opt. Phys. Mater. , 8 171
–189
(1999). Google Scholar
B.-M. Kim
,
M. D. Feit
,
A. M. Rubenchik
,
E. J. Joslin
,
J. Eichler
,
P. Stoller
, and
L. B. Da Silva
,
“Effects of high repetition rate and beam size on hard tissue damage due to subpicosecond laser pulses,”
Appl. Phys. Lett. , 76 4001
–4003
(2000). Google Scholar
I. V. Yannas
and
C. Huang
,
“Fracture of tendon collagen,”
J. Polym. Sci., Part A-2 , 10 577
–584
(1972). Google Scholar
A. Ku¨ntzel
,
“Die struktur der kollagenfaser,”
Kolloid-Z. , 96 273
(1941). Google Scholar
|


CITATIONS
Cited by 223 scholarly publications and 36 patents.
Polarization
Collagen
Second-harmonic generation
Tissues
Backscatter
Data modeling
Harmonic generation


