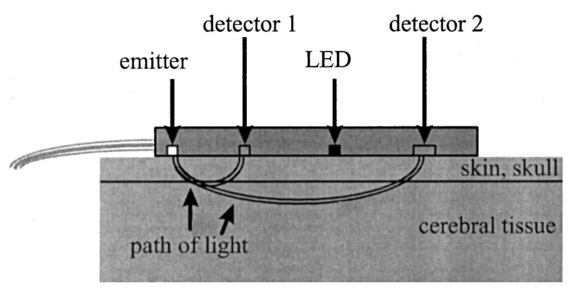
1.IntroductionDespite decreasing mortality, the incidence of brain lesions in preterm neonates is still high. There are two types of lesions: hemorrhagic (bleeding) and ischaemic (infarction). Their exact etiology is still unknown. Better knowledge of the neonatal hemodynamics may help either by creating a better understanding of the etiology or as an early indicator of lesions. Near-infrared spectrophotometry (NIRS) has been applied to measure the cerebral hemodynamics. In particular, the total cerebral hemoglobin (tHb) concentration (in μmol/L) may be an early indicator of brain lesions.1 With respect to this application it is important to compare different methods using NIRS to determine the tHb. Two methods by which to determine the absolute tHb by continuous wave NIRS were previously developed. The first method (the tHbo method) requires a slow change in oxygenation and arterial oxygen saturation (SaO 2 in ) measurements as a reference.1 2 3 This method is used for continuous wave NIRS instruments, which only quantify relative changes in concentration of oxy- and deoxyhemoglobin (O 2 Hb and HHb in μmol/L) compared to an arbitrary baseline. It has not been validated in neonates yet and has even failed to provide internal consistency during one study.2 We have included this method because it has previously been used in several studies. The second method (the tHbg method) is based on a geometrical principle and multidistance continuous wave NIRS instrument, which quantifies the tHb continuously.4 A study to validate this in a neonatal head phantom showed that the tHbg values were falsely too high due to offsets of unknown origin.5 However, changes in O 2 Hb and HHb were correctly quantified. Therefore this method (the tHbgo method) used these O 2 Hb and HHb changes during a slow oxygenation change to calculate absolute tHb values with regard to SaO 2. This tHbgo method is a combination of the first two methods and should not be subject to offsets like the tHbg method.5 The aim of this study was to compare these three methods quantitatively. Furthermore, the tHb calculated by the three methods was compared to important physiological variables, which were expected to influence the tHb. In particular, the partial carbon dioxide pressure ( pCO 2 in kPa) and the hemoglobin concentration in the blood ( cHb in g/100mL) were positively correlated to the tHb in previous studies.2 4 Thus this comparison shows whether the tHbg, tHbgo, and tHbo are reasonable. 2.Material and Methods2.1.InstrumentationFor our study we used a Critikon 2020 Cerebral RedOx monitor (Johnson & Johnson, UK), which is based on a two channel sensor and a coupling compensation system. It uses four laser diodes with wavelengths at 776.5, 819.0, 871.4, and 908.7 nm. Silicon photodiode detectors are placed at 10 and 37 mm from the emitter’s window. Placed in the middle between those two is a light emitting diode (LED). The light intensity of the LED should be the same at both detectors. Hence a difference in coupling can be compensated for. 2.2.Theory2.2.1.tHbg MethodThe aim of the tHbg method and specially designed sensor is to determine the cerebral hemoglobin concentrations without any influence from the extracerebral layers: skin, skull, and cerebro spinal fluid. The signal from detector 1 (Figure 1) is mainly affected by these layers, while the signal of detector 2 has a predominant component that refers to the brain. A ratio of the signals of detector 2 and detector 1 is calculated, which reduces the influence of the extracerebral layers. In the case of pure scattering without any absorption, the light intensity will decrease with the squared distance to the source. Thus the effect of scattering can be taken into account. The remaining effect is due to absorption. The absolute concentrations of deoxyhemoglobin (HHb in μmol/L) and of oxyhemoglobin (O 2 Hb in μmol/L) can be calculated using a modified Beer–Lambert law. The complete algorithm is given by where k=the coefficient matrix, which depends on the absorption coefficients of HHb and O 2 Hb, B=the differential pathlength factor for each wavelength, rx=the distance between the emitter and detector x, Ix=the light intensity of the laser diode’s emitter at detector x for each wavelength, LED x=the light intensity of the LED at detector x, and O x=the offset due to water absorption: O 1=7.5 μmol/L and O 2=28.8 μmol/L.Since HHb and O 2 Hb are quantified absolutely, tHbg can be determined as the sum of both (Figure 2). The algorithm is described in detail by in Ref. 4. Figure 2Example showing consecutive slow changes in oxygenation analyzed by the tHbg algorithm. The arterial oxygen saturation (SaO 2) and oxyhemoglobin (O 2 Hb) decrease and the deoxyhemoglobin (HHb) increases simultaneously during alteration of FiO 2. The sum of O 2 Hb and HHb corresponds to tHbg.  2.2.2.tHbo MethodIf only the signal from detector 2 (Figure 1) is analyzed, the Critikon instrument is technically equivalent to other systems such as the Hamamatsu NIRO 500 (Japan), the NIRO 300 (with respect to the O 2 Hb, HHb, and tHb concentrations), or the Critikon 2001 (UK). Even the wavelengths employed by the Hamamatsu NIRO 500 (775, 810, 870, and 904 nm), the NIRO 300 (775, 810, 850, and 913 nm), and the Critikon 2001 (same as the Critikon 2020) are quite similar to ours. These instruments only quantify changes in the hemoglobin concentration. At the beginning of each measurement the light attenuation is set to zero and only subsequent changes in light attenuation are taken into consideration. It is assumed that these changes can be attributed to changes in the hemoglobin concentration in the tissue under investigation. To convert the changes in attenuation to concentration changes, the Beer–Lambert law was modified [Eq. (2)]. This modification is in agreement with the diffusion approximation, which is valid if scattering is much higher than absorption. Our second algorithm corresponds to the UCL4 algorithm described in Ref. 6 for the Hamamatsu NIRO 500.To determine the absolute tHb, the tHbo method requires a slow change in oxygenation, which is achieved by altering the oxygen fraction inspired. SaO 2 is measured by pulse oximetry (a Hellige SMK132 with a 3 s averaging time or a Nellcor N-200 with a 2 s averaging time) and is kept within a normal range (85–99). The relative O 2 Hb signal, which is measured just like in conventional NIRS, varies parallel to the SaO 2 (Figure 3). The tHb can be quantified by comparing the change in O 2 Hb to the change in SaO 2 [Eq. (3)]. The change in O 2 Hb is equal but opposite to the change in HHb as long as the tHb remains constant. Under this circumstance it is possible to improve the signal to noise ratio by taking (ΔO 2 Hb–ΔHHb)/2 instead of ΔO 2 Hb [Eq. (3)]. This method is described in detail in Ref. 3.Figure 3Same slow changes in oxygenation as in Fig. 2 evaluated by the tHbo algorithm. The arterial oxygen saturation (SaO 2) and the cerebral oxyhemoglobin concentration (O 2 Hb) increase and decrease simultaneously as the inspired oxygen fraction is altered.  2.2.3.tHbgo MethodFor this method the same procedure to determine tHbo from oxygenation changes was applied to the O 2 Hb and HHb concentrations determined by the tHbg algorithm (Figure 2). 2.3.Data AnalysisAll data used in this study had adequate technical quality, i.e., the instrument did not indicate poor signal quality. The data with a sample time of 1 s were converted into 10 s values by averaging. Changes in oxygenation were analyzed using a computer program according to the procedure in Ref. 3. The beginning and the end of a decrease or increase in oxygenation was identified by looking at the SaO 2 trace only. A change in oxygenation was defined to be any change in SaO 2 of more than 4 over a period of more than 1.2 min. In each infant at least six changes in oxygenation were carried out consecutively and for each one tHbo and tHbgo were calculated by a computer program. For the tHbo method 36 of the measurements passed the quality criteria established in Ref. 3: the change in SaO 2 was >4 over >1.2 min, the line of regression had an r2>0.85, and the ΔtHb was smaller than 25 of the (ΔO 2 Hb–ΔHHb)/2. Only 24 of the tHbgo method measurements fulfilled the quality criteria so all measurements of four infants were rejected. Several changes in oxygenation yielded a valid tHbo value, while the tHbgo value was rejected due to poor quality or vice versa. In that case the valid value was removed too, because we wanted to compare both methods for exactly the same data. For each remaining tHbgo measurement the mean of the continuously available tHbg was calculated. The test retest variability (TRV) (in ) was determined for each method by analysis of the variance. For each infant the mean of tHbg, tHbo, and tHbgo was determined. The data were checked for normality. To compare the three methods we proceeded in the following way. Two methods were compared at a time and their correlation coefficient (r) was calculated. Furthermore we calculated the limits of agreement as described in the literature.7 Using a regression procedure with variable selection by Mellow’s C(p), 8 we determined other parameters which influence the tHbg, tHbo, and tHbgo. The following parameters were available: gestational age (GA) (in weeks), birthweight (BW) (in g), postnatal age (PA) (in days), cHb, pCO 2, heart rate (HR) (in bpm), and mean arterial blood pressure (MAP) (in mmHg) measured continuously through an umbilical arterial catheter. 3.ResultsTwenty clinically stable, mechanically ventilated preterm infants who needed supplemental oxygen were included in this study. These two requirements were due to the fact that only under these circumstances could a controlled change in oxygenation to obtain the tHbo and tHbgo be carried out. Four infants were excluded, because all their tHbo or tHbgo measurements were not of good enough quality.3 The remaining 16 neonates had a mean gestational age of 29.6 (range of 25.1–36.4) weeks, birthweight of 1386 (680–2820) g, and postnatal age of 2.5 (0.5–6) days. As for brain lesions, we found ischaemic leasions in none, subependymal hemorrhage in three, and intraventricular hemorrhage in three of the infants. A total of 202 measurements was analyzed. There were 3.1 (1–6) measurements per infant. The success rate per attempt was 36 for tHbo and 24 for tHbgo. At least one measurement was successful in 90 of the infants for tHbo and in 80 of the infants for tHbgo. This study was approved by the ethical committee of our institution and informed consent was obtained. The mean±standard deviation (SD) tHbg was 150.2±41.8 μmol/L (range of 61.6–228.9 μmol/L), the tHbo was 62.1±27.2 μmol/L (26.0–110.8 μmol/L), and the tHbgo was 89.3±45.6 μmol/L (26.5–195.9 μmol/L). These values were highly significantly different among methods (Wilcoxon signed rank test p<0.001 ). All three variables are plotted against each other in Figures 4 5 6 as x–y -plots. Figure 4Absolute cerebral hemoglobin concentration measured by the tHbg method plotted vs the cerebral hemoglobin concentration measured by the tHbgo method, which is based on analysis of change in oxygenation. The error bars indicate the standard deviation and are displayed only for infants that had more than two measurements. The equation of the regression line is also displayed.  Figure 5Absolute cerebral hemoglobin concentration measured by the two methods, tHbo vs tHbgo, which require a change in oxygenation. 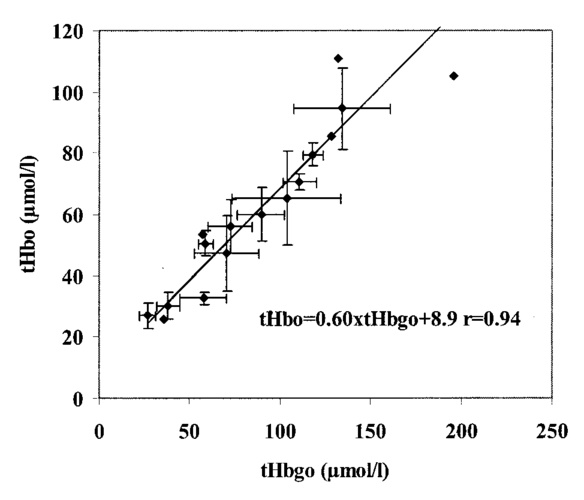 Figure 6Absolute cerebral hemoglobin concentration measured by the tHbg method based on the geometrical principle plotted vs the cerebral hemoglobin concentration measured by the tHbo method based on the relative change in oxygenation method.  The mean difference between two methods and its 95 confidence limits are shown in Table 1. Table 1
In the results of the regression analysis the best model for tHbg with a C(p)=3.76 and an adjusted r2=0.588 included the four variables, BW, PA, MAP, and pCO 2. For tHbo and tHbgo the model had C(p)=1.7 or 3.2, respectively, and adjusted r2=0.493 or 0.406, respectively, with the three variables, cHb, MAP, and pCO 2. The only significant bivariate correlation (Pearson) among the three methods, tHbg, tHbgo, and tHbo, and other variables was the one between cHb and tHbgo (r2=0.404, p=0.008). The TRV was 7.6 for the tHbg method, 20.1 for the tHbo method, and 21.3 for the tHbgo method. 4.DiscussionThe aim of this study was to quantitatively compare three methods: tHbg, tHbo, and tHbgo. If the three methods were in perfect agreement, we would find bias=0 in Table 1, slope=1, intercept=0, and r2=1 for the equations in Figures 4 5 6. The actual values differ considerably from the ones expected. The results (Table 1) of the analysis according to Bland and Altman7 show that the values measured by the three methods are clearly not equivalent. The precision is in the same range as the actual value of the measurement. This type of analysis is the standard method and is very powerful in showing agreement among methods. However, when the disagreement is systematic, as in our case, i.e., in the case of high r, regression analysis is more helpful in interpreting the relation. We try to give an explanation for the disagreement among methods in the following. To do so it would have been desirable to compare the values obtained by NIRS to a gold standard method. Although magnetic resonance imaging (MRI) or PET would be useful as a reference, they require the injection of a contrast agent, which would yield the risk of an allergic reaction. Furthermore, the infant needs to be transported to the scanner, which in itself is a risk for mechanically ventilated and critically ill patients. The infant has to be immobilized during the scan. We considered such a procedure to be unethical and refrained from it. Animal experiments are not comparable due to the large geometrical differences in anatomical structure, especially that of the head. NIRS has already been shown to give erroneous values for cerebral blood flow in dogs,9 10 but two studies proved that NIRS is a valid method by which to determine the cerebral blood flow of neonates.11 12 Thus the only acceptable ways to test the three methods are either in the infants directly or in a phantom model, with similar geometry as the infants head, which has already been done.5 13 For tHbo it is possible to compare the values to previous studies in infants using the same method. To do this the values were converted into cerebral blood volume (CBVO) (in mL/100 g) using where 0.890 is a constant, which accounts for unit conversion of tetrameric tHbo into grams, volume brain to its weight, and the cerebral to large vessel ratio of 0.69 for the cHb.Thus we receive the following mean value±standard deviation: CBVO=3.3±1.0 mL/100 g. For healthy infants CBVO values were previously measured by Ref. 1: 2.2±0.4, Ref. 2: 3.7±1.1, and Ref. 3: 2.5±0.9 mL/100 g. Consequently our CBVO values are comparable to previous ones. 4.1.Comparison of tHbg and tHbgoFor the tHbg and tHbgo algorithm, validation studies of neonatal head phantoms have been carried out.5 13 In Ref. 13 a clear layer that mimicked cerebro spinal fluid was inserted into the phantom. According to Ref. 14 this kind of uniformly thick clear layer does not represent the effect of cerebro spinal fluid in vivo. Therefore we consider the model in Ref. 5 to best reflect the situation in the infant. In that study5 it was shown, on the one hand, that changes in O 2 Hb and HHb were quantified correctly, independent of the light scattering and, on the other hand, that the absolute O 2 Hb and HHb values had substantial offsets, i.e., the values overestimated the actual concentration by a constant amount. These offsets depended on light scattering. Their origin was unclear. From these findings we would expect the tHbgo to be correct, because it only takes changes of O 2 Hb and HHb into account whereas the tHbg is subject to the offsets. The slope of the line of regression (Figure 4) of 0.92, which is close to the expected value of 1 and the high offset of 68.0 μmol/L, supports this, that is, that the disagreement between these two methods is caused by this offset. Thus the results are in agreement with the study using the phantom. r is lower than expected: r=0.736. This means, that there is relatively large intersubject variability between the tHbg and tHbgo. Although it is beyond the scope of this paper to identify the exact reasons for this, we want to point out the likeliest reasons.
4.2.Comparison of tHbo and tHbgoThe tHbo method has neither been validated in infants nor are phantom data available. It has been tested in infants for internal consistency.2 The tHb was changed by altering the pCO 2. When the relative change in tHb measured directly by this algorithm was compared to the difference in tHbo before and after the change in pCO 2 a fourfold discrepancy was found. Thus the algorithm, which is used for the tHbo method, failed to demonstrate any internal consistency. In comparing tHbo and tHbgo (Table 1 and Figure 5) we find high and significant bias, but also a high correlation with r=0.94, which is remarkably close to 1. This shows that the strong disagreement is highly systematic. Again we want to point out the most likely reasons for the strong disagreement, i.e., why the tHbo gives significantly lower values than the tHbgo.
The most likely reason for the high correlation between the two methods is the operating dependence, i.e., the same NIRS and pulse oximeter data are used for the same period of time. 4.3.Comparison of tHbg and tHboThe discrepancy between these two methods can be explained by combining the effects mentioned for tHbg versus tHbgo and for tHbo versus tHbgo. 4.4.Comparison to Physiological DataAll three, tHbg, tHbo, and tHbgo, showed a highly significant correlation to physiological data (p<0.0001). It is known that the acute changes in pCO 2 affect the tHb (e.g., in Ref. 2) within patients. This does not necessarily mean that this is the case when making a comparison among infants. Considering the wide range of pCO 2 among infants (4.7–7.6 kPa), it still is the most likely reason why pCO 2 is the variable most strongly associated with tHbg, tHbo, and tHbgo. In healthy infants cerebral autoregulation is assumed to keep cerebral hemodynamics independent of the MAP. However, in critically ill infants autoregulation may be abolished,17 which could be the reason why the variable MAP is found in all three models. It is reasonable that we find the variable cHb in the models for tHbgo and tHbo. The higher the concentration of hemoglobin in the blood the more likely it is to find a high cerebral concentration. This variable is also significantly related to tHbgo in a bivariate model. The PA is significantly negatively correlated to the cHb. This could be the reason why PA is associated with tHbg instead of with cHb. The association of BW with tHbg previously discussed is probably due to the offsets of this method, which depend on scattering.5 It has been shown that scattering is dependent on the gestational age, which is closely correlated to the BW.15 4.5.Advantages and Disadvantages of Each MethodtHbg is much easier to apply than the other methods, because it does not require a change in oxygenation. Hence tHbg is the only usable method for infants who do not require additional oxygen. The parameters are continuously available. Furthermore, the geometrical method allows one to measure the tissue’s oxygen saturation.4 It also shows the highest correlation to the physiological variables. From this point of view one could conclude that the tHbg method is the most trustworthy method. However, according to the phantom study,5 tHbg is subject to offsets, which depend on scattering of the tissue. The relationship between the tHbg and the BW confirms this drawback. The tHbo method requires changes in oxygenation and thus is only applicable in infants who require additional oxygen. It was not internally consistent according to previous findings.2 The high correlation (r=0.94) between tHbo and tHbgo shows that both methods are systematically highly related, although their absolute values are quite different. The tHgo method also requires changes in oxygenation. It is probably less trustworthy than tHbo, because it has a lower correlation to physiological variables for the same model. However, tHbgo also shows a significant correlation with cHb in the bivariate model. The difference between the two methods is probably small and in addition in the tHbgo method the rejection rate of measurements is much higher. Thus it is difficult to recommend one particular method. Whatever method is used, it will be important to consider that the absolute values depend strongly on the method. AcknowledgmentThe authors thank Professor Susanne Aref of the Illinois Statistics Office, University of Illinois at Urbana–Champaign, for kind and valuable advice. REFERENCES
J. S. Wyatt
,
M. Cope
,
D. T. Delpy
,
C. E. Richardson
,
A. D. Edwards
,
S. Wray
, and
E. O. Reynolds
,
“Quantitation of cerebral blood volume in human infants by near-infrared spectroscopy,”
J. Appl. Physiol. , 68 1086
–1091
(1990). Google Scholar
N. C. Brun
and
G. Greisen
,
“Cerebrovascular responses to carbon dioxide as detected by near-infrared spectrophotometry: comparison of three different measures,”
Pediatr. Res. , 36 20
–24
(1994). Google Scholar
M. Wolf
,
H. U. Bucher
,
V. Dietz
,
M. Keel
,
K. von Siebenthal
, and
G. Duc
,
“How to evaluate slow oxygenation changes (SOC) to estimate absolute cerebral hemoglobin concentration (CHC) by near infrared spectrophotometry in neonates,”
Adv. Exp. Med. Biol. , 411 495
–501
(1997). Google Scholar
M. Wolf
,
P. Evans
,
H. U. Bucher
,
V. Dietz
,
M. Keel
,
R. Strebel
, and
K. von Siebenthal
,
“The measurement of absolute cerebral hemoglobin concentration in adults and neonates,”
Adv. Exp. Med. Biol. , 428 219
–227
(1997). Google Scholar
M. Wolf
,
O. Baenziger
,
M. Keel
,
V. Dietz
,
K. von Siebenthal
, and
H. U. Bucher
,
“Testing near infrared spectrophotometry using a liquid neonatal head phantom,”
Proc. SPIE , 3566 79
–86
(1998). Google Scholar
S. J. Matcher
,
C. E. Elwell
,
C. E. Cooper
,
M. Cope
, and
D. T. Delpy
,
“Performance comparison of several published tissue near-infrared spectroscopy algorithms,”
Anal. Biochem. , 227 54
–68
(1995). Google Scholar
J. M. Bland
and
D. G. Altman
,
“Statistical methods for assessing agreement between two methods of clinical measurement,”
Lancet , 1
(8476), 307
–310
(1986). Google Scholar
C. R. J. C. Newton
,
D. A. Wilson
,
B. Gunnoe
,
B. Wagner
,
M. Cope
, and
R. J. Traystman
,
“Measurement of cerebral blood flow in dogs with near infrared spectroscopy in the reflectance mode is invalid,”
J. Cereb. Blood Flow Metab. , 17 695
–703
(1997). Google Scholar
M. Wolf
,
O. Baenziger
,
M. Keel
,
V. Dietz
,
K. von Siebenthal
, and
H. U. Bucher
,
“Cerebral blood flow measurements by near infrared spectroscopy in reflectance mode are valid in neonates,”
J. Cereb. Blood Flow Metab. , 18 698
–700
(1998). Google Scholar
L. Skov
,
O. Pryds
, and
G. Greisen
,
“Estimating cerebral blood flow in newborn infants: Comparison of near infrared spectroscopy and 133Xe clearance,”
Pediatr. Res. , 30 570
–573
(1991). Google Scholar
H. U. Bucher
,
A. D. Edwards
,
A. E. Lipp
, and
G. Duc
,
“Comparison between near infrared spectroscopy and 133xenon clearance for estimation of cerebral blood flow in critically ill preterm infants,”
Pediatr. Res. , 33 56
–60
(1993). Google Scholar
M. Wolf
,
M. Keel
,
V. Dietz
,
K. von Siebenthal
,
H. U. Bucher
, and
O. Baenziger
,
“The influence of a clear layer on near-infrared spectrophotometry measurements using a liquid neonatal head phantom,”
Phys. Med. Biol. , 44 1743
–1753
(1999). Google Scholar
M. A. Franceschini, L. A. Paunescu, S. Fantini, S. Pratesi, J. S. Maier, G. P. Donzelli, and E. Gratton, “Frequency-domain optical measurements in vitro on two- and three-layered tissue-like phantoms and in vivo on infant heads,” OSA Trends in Optics and Photonics on Advances in Optical Imaging and Photon Migration, OSA Trends Opt. Photonics Ser. 21, J. G. Fujimoto and M. Patterson, Eds., pp. 232–236, Optical Society of America, Washington, DC (1998).
E. Okada
and
D. T. Delpy
,
“The effect of overlying tissue on NIR light propagation in neonatal brain,”
Adv. Opt. Imaging Photon Migration , 2 338
–343
(1996). Google Scholar
M. Tsuji
,
J. P. Saul
,
A. du Plessis
,
E. Eichenwald
,
J. Sobh
,
R. Crocker
, and
J. J. Volpe
,
“Cerebral intravascular oxygenation correlates with mean arterial pressure in critically ill premature infants,”
Pediatrics , 106
(4), 625
–632
(2000). Google Scholar
|
|||||||||||||||||||||||||||||||||||


CITATIONS
Cited by 23 scholarly publications.
Sensors
Light emitting diodes
Near infrared spectroscopy
Oxygen
Signal detection
Spectrophotometry
Absorption


