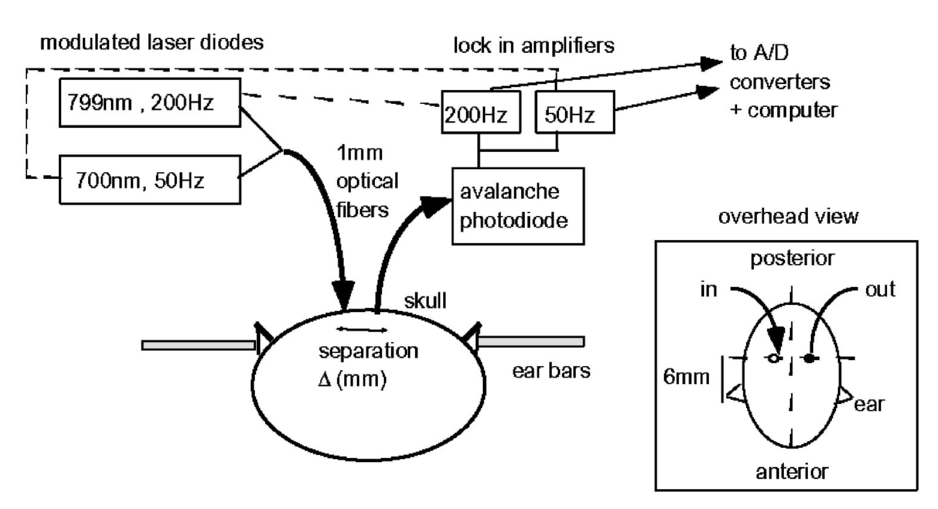
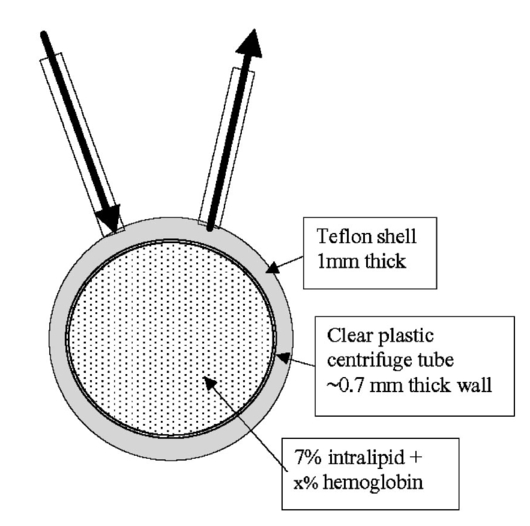
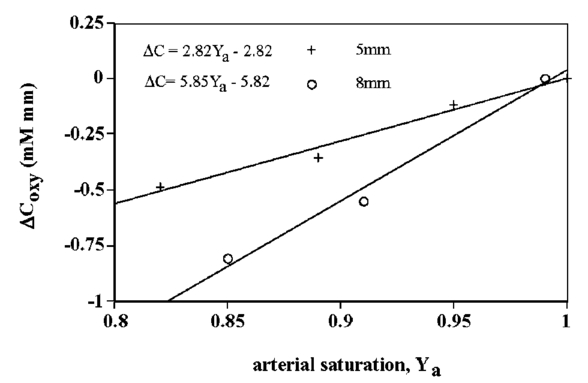
1.IntroductionIt has long been known that light in the near-infrared region is sensitive to changes in the hemoglobin oxygenation state and concentration in living tissue.1 2 This effect has been exploited in the development of peripheral pulse oximetry and tissue oximeters.3 4 More recently, transcranial near-infrared spectroscopy has been developed for visualizing the brain function by mapping optical absorption changes on the cortical surface.5 6 7 8 9 10 Near-infrared spectroscopy yields complementary information to other hemoglobin sensitive methods, such as functional magnetic resonance imaging (fMRI) and can thus provide a more complete understanding of the underlying physiology. Furthermore, the facility of optical methods allows noninvasive measurement of the human brain function under a variety of conditions without restriction of the subject.10 11 12 13 14 15 Light absorption in tissue is approximated well by the modified Beer–Lambert equation.5 This states that the light attenuation is determined by the concentrations of hemoglobin species, c (in mM), molar absorbances of each species, ε (in mm/mM), and the optical pathlength, d (in mm) as where a includes other absorption and scattering effects due to other chromophores and interfaces. The optical pathlength, d, is the mean distance over which the light travels through the tissue. Assuming that hemoglobin changes are dominant during neuronal stimulation, the ratio of active ( S act ) and baseline ( S base ) optical signals yields where Δc denotes the difference in hemoglobin concentration in the active and resting states. By performing optical absorption measurement at multiple wavelengths and using known values of ε(λ) it is possible to determine the changes in hemoglobin concentration multiplied by the optical pathlength.10 This combination is often condensed into a single parameter which is denoted by ΔC=Δc⋅d , which has units of millimolar millimeter (mM mm). The change in total hemoglobin, which is proportional to the blood volume, is given in terms of the sum, Thus, the oxygenation changes derived from continuous-wave absorption measurements suffer a significant problem for comparison across subjects in that the pathlength is undetermined and can vary significantly depending on the spacing of optical fibers and the underlying tissue morphology.16 17 While other methods exist for the determination of pathlength, they often involve relying on models of light diffusion as well as on more complicated light detection and transmission systems. This would include phase modulation techniques5 17 18 19 for the detection of diffuse photon waves, or time of flight measurements5 20 21 to directly determine the optical pathlength. The purpose of this work is to derive pathlength independent measures of tissue oxygenation by using a simple physiologic challenge to normalize data for cross-subject comparisons. A physiologic model was derived and experiments were performed to demonstrate several pathlength independent parameters.2.Methods2.1.Physiologic ModelIt is useful to first outline a model in which changes in the optical signal can be evaluated in terms of the physiologic changes in oxygen extraction and blood volume. Since the near-infrared signal interrogates a large portion of tissue (several mm 2 in the rat brain) it is necessary to determine the oxygen concentration in arterial, capillary, and venous compartments of the microvasculature. Using the model of van Zijl et al.;22 we first assume that the fraction of deoxyhemoglobin in arterioles ( x deoxy,a ) and venules ( x deoxy,v) are given by where Ya is the arterial oxygen saturation fraction of hemoglobin. The term (Ya−Yv) in Eq. (5) represents the arteriovenous difference in oxygen content22 23 24 and can be re-expressed in terms of the oxygen extraction ratio (OER), where CMRO 2 =cerebral metabolic rate of oxygen extraction; CBF=cerebral blood flow; [Hb] =concentration of hemoglobin in the blood; Ya =arterial blood oxygenation fraction.Assuming a linear oxygen gradient between arterioles and venules22 the capillary deoxyhemoglobin fraction is, therefore, The fractions of oxyhemoglobin are likewise given by The concentration of oxy-( c oxy ) , deoxy- (c deoxy ) , and total (c tot ) hemoglobin in tissue is then given by where denote the fraction of arteriole, capillary, and venular blood ( Va+Vc+Vv=1) , CBV is the brain blood volume, and [Hb] tot denotes the concentration of total hemoglobin within the blood. The typical microvessel morphology of the brain gives these fractions to be 0.21, 0.33, and 0.46, respectively.22 23Substituting Eqs. (4), (6), and (8 9 10 11) into Eq. (12) yields which can also be expressed using Eq. (7) as The ratio of oxyhemoglobin to total hemoglobin is often referred to as the tissue oxygenation index (TOI),25 TOI=c oxy /c tot , which is given by Given a resting oxygen extraction ratio of 0.38 and vascular fractions of Vv=0.4 and Vc=0.33 ,22 23 the tissue oxygenation index is approximately ∼0.8Ya.2.1.1.Changes in Cerebral Oxygenation During Mild Hypoxia/HyperoxiaIt is interesting to first consider the changes in blood oxygenation during mild hypoxia, in which blood volume and oxygen extraction are minimally affected.4 26 27 28 29 30 The concentration changes derived from continuous-wave (cw) near-infrared spectroscopy are directly proportional to changes in c oxy , c deoxy , and c tot , as discussed earlier, for example, where d is the optical pathlength for the scattered light (mm). The difficulty often encountered in interpreting the results of near-infrared spectroscopy data is that the pathlength is unknown. It will be shown that by using a mild hypoxia challenge it is possible to normalize the signal changes observed during a functional experiment and thus obtain pathlength-independent measures of hemodynamic response. It is known that during mild hypoxia and hyperoxia ( Ya>0.8 ) blood flow and blood volume do not change significant.26 27 28 29 30 From Eq. (15) we know the change in oxyhemoglobin concentration is linearly proportional to the arterial oxygen saturation, Ya, with a slope, mY, given byThe cerebral oxygenation gradient given by Eq. (21) allows convenient normalization of hemoglobin changes which lead to pathlength-independent measures of tissue oxygenation changes during a stimulus, discussed next. 2.1.2.Changes in Cerebral Oxygenation at Fixed Arterial SaturationUnder normal circumstances the arterial saturation is constant during neuronal activation (by sensorimotor simulation or pharmacologic intervention). The change in total hemoglobin is given by Normalization of the total hemoglobin changes during activation, ΔC tot , by the oxygenation gradient, mY, yieldsTherefore, by normalizing the total hemoglobin changes during activation by the hyperoxia/hypoxia oxygenation gradient one measures the fractional change in blood volume within the tissue. From Eq. (14) it is simple to show that at fixed arterial saturation and hematocrit, the normalized responses for oxy- and deoxyhemoglobin yield the pathlength-independent results: where TOI rest , CBV rest , and c tot,rest are the resulting tissue oxygenation index, cerebral blood volume, and total hemoglobin concentration, respectively. The fractional change in tissue oxygenation index during stimulation is given by and the fractional changes in oxygen extraction ratio is The fractional change in the oxygen extraction ratio provides information on the relative changes of flow and metabolism as Equations (23 24 25 26 27) show that by hypoxia normalization it is possible to obtain meaningful information about tissue oxygenation changes which are not dependent on the optical pathlength provided that the area of activation probed by the optode is uniform. In Sec. 2.2 the utility of this method is demonstrated using a simple hypercarbic challenge to alter tissue oxygenation.2.2.Experiment2.2.1.Spectroscopy SystemMeasurement of transcranial tissue oxygenation changes was performed using a dual wavelength near-infrared spectrometer (NIRS), shown in Figure 1. This system is based on the design in Ref. 10. Laser diodes at 700 and 799 nm (1–3 mW) were coupled into a single 1 mm optical fiber which was placed on the scalp of the animal (excess hair was shaved for better optical contact). The resultant reflectance signal was obtained from a similar fiber placed 5–8 mm from the transmission fiber. This signal was sent to an avalance photodiode system (Hamamatsu Photonics). The laser diodes were frequency modulated in order to resolve the signal into each wavelength component. The signal detected was then demodulated through single phase lock-in amplifiers (Boston Electronics). The data were then recorded on a computer for analysis. The pathlength-dependent changes in oxy-, deoxy-, and total hemoglobin were evaluated via matrix inversion of Eq. (2). 2.2.2.Animal ModelSprague–Dawley rats (230–300 g, N=5 ) were initially anesthetized using halothane. The animals were tracheotomized and artificially ventilated using an oxygen/nitrogen mixture. Three catheters were placed in order to inject alpha chlorolose, draw blood samples, and monitor blood pressure. Hypoxia was induced by reducing the oxygen concentration in the breathing gas over a range of 100–18 with nitrogen as the balance. This reduced the arterial saturation from 100 to as low as 82. Typically the oxygen content was cycled as 100→40→20→18→100. Hypercarbia was induced by changing the breathing gas mixture from 90 O 2 /10 N 2 to 90 O 2 /10 CO 2 . Arterial blood gases were measured approximately 5 min after each gas mixture was cycled. Optical fibers were centrally placed at a distance Δ mm across the skull surface approximately 6 mm posterior to the earbar as shown in the inset of Figure 1. This was approximately the level of the somatosensory cortex. In order to test the pathlength dependence of the changes in oxygenation, measurements were performed with a fiber separation of Δ=5 and 8 mm. 2.2.3.Phantom Evaluation of Path Length Dependence on Optical AbsorptionAn important hypothesis in this discussion is that the pathlength of light remains constant during mild hypoxia and the activation challenge. To validate this, measurements were performed on a layered tissue like phantom system, illustrated in Figure 2. The phantom consisted of a 1.5 cm inner diameter (i.d.) clear plastic centrifuge tube which contained a light scattering medium of 7 intralipid (Sigma Chemicals). In order to change the optical absorption, human hemoglobin was dissolved in the intralipid at concentrations ranging from 0 to 0.22 mM. This range is roughly equivalent to a whole blood volume fraction of 0–10 at a normal hematocrit of 0.4. The centrifuge tube was placed inside an opaque Teflonshell to simulate skin and bone. Optical fibers were then mounted on the surface of the shell at a fiber spacing of approximately 5 mm. The effective path length is defined in terms of the optically measured change in total hemoglobin and the known change in total hemoglobin which is added to the intralipid solution, i.e., 3.Results3.1.Mild HypoxiaFigure 3 shows a typical time course for oxy-, deoxy-, and total hemoglobin as oxygen is cycled from 100 to 19 and back. Figure 3(a) shows results for a fiber spacing of 8 mm while Figure 3(b) shows the result with a spacing of 5 mm. This data illustrate the clear dependence of these parameters on the optical pathlength. Figure 4 shows an example of the change in transcranial oxygenation as a function of arterial oxygen saturation during mild hypoxia/hyperoxia. Over the range of arterial oxygenation studied and the fiber spacings used the changes in brain oxyhemoglobin concentration were approximately linear. Furthermore, it is apparent that for larger optode spacings the slope of the oxygen response curve becomes correspondingly larger. This is consistent with the light following a longer pathlength and thus the increase net absorption from chromophores should enhance the changes. If the oxygenation changes are homogeneous then Eq. (21) shows that the ratio of the slopes at each spacing corresponds to the pathlength ratio for this system. When averaged over all animals we found the oxyhemoglobin response slope to be 2.6±0.1 (mM mm /ΔYa ) for a spacing of 5 mm and 4.9±0.6 (mM mm/ ΔYa ) for a spacing of 8 mm. No significant changes in total hemoglobin concentration were observed for either optode spacing during mild hypoxia/hyperoxia, i.e., ΔC tot (5 mm)=0.01±0.03 (mM mm) and ΔC tot (8 mm)=−0.03±0.04 (mM mm). 3.2.HypercarbiaFigure 5 shows a typical time course for blood oxygenation, which shows the contrast in changes during hypoxia and hypercarbia. The data shown are as breathing gas is cycled from hyperoxia ( Ya=1.0 ) to mild hypoxia ( Ya=0.9 ) and then through mild hypercarbia. ( Ya=1.0 , PCO 2 increase by 11 mm.) The total hemoglobin is shown to change much more during hypercarbia which is consistent with the expected vasodilatory effects of increased carbon dioxide concentration in the blood. It is also interesting to note that the temporal response during hypercarbia was much slower than that of hypoxia which is probably indicative of the slower vasoactive responses of flow and volume in hypercarbia compared to the response time for hemoglobin desaturation in mild hypoxia. Figure 5Time course of oxy- deoxy- and total hemoglobin changes during mild hypoxia and hypercarbia. The gas concentrations are (A) 90 oxygen/10 nitrogen, (B) 19 oxygen/81 nitrogen, (C) 90 oxygen/10 carbon dioxide. 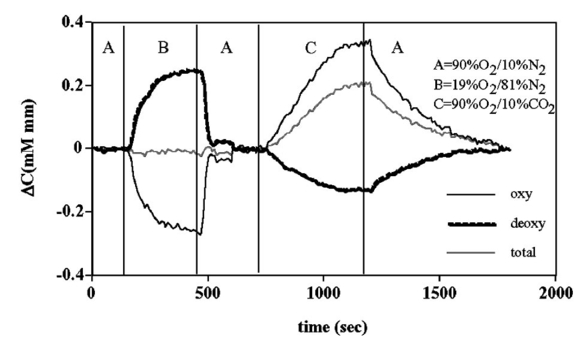 Figure 6 shows the results averaged over all experiments for the mean oxy- and deoxyhemoglobin changes during mild hypercarbia, in which the mean PCO 2 was raised from 30±4 to 44±8 mm as the optode spacing was increased from 5 to 8 mm. It is clear that for large spacing significantly larger concentration changes are observed which are associated with the increase in optical pathlength. Figure 7 shows a comparison of the changes in signal at different pathlengths by calculating the ratio of each oxygenation parameter and the normalized TOI with spacings of 8 and 5 mm. For oxy- and deoxy- and total hemoglobin, the paired ratio of signal changes, Δ8 mm /Δ5 mm , were 1.7±0.2, 1.9±0.15, and 1.7±0.4, respectively. It is apparent that when the data are normalized via the hyperoxia response the corresponding tissue oxygenation parameters show little dependence on the pathlength. The normalized paired ratios of oxy- deoxy- and total hemoglobin signal changes were 0.96±0.07, 1.07±0.15, and 0.97±0.2, respectively. The calculated volume changes during hypercarbia were ΔV/V rest =0.06±0.02 at 5 mm and 0.05±0.01 at 8 mm. The corresponding estimated changes in the tissue oxygenation index, ΔTOI/TOI, were 0.082±0.02 at 5 mm and 0.086±0.04 at 8 mm. This confirms that by normalizing the signal changes it is possible to obtain pathlength-independent information which can be compared across experiments. Figure 7Paired comparison of signal changes as a function of optode spacing during mild hypercarbia. Columns 1–3 denote the ratios of changes in signals at 8 and 5 mm without normalization, while columns 4–7 show the same results with oxygenation normalization. The normalized signals demonstrate little pathlength dependence as the fiber spacing is varied.  3.3.Phantom ResultsFigure 8(a) shows the optical absorption measured as a function of the hemoglobin concentration in the intralipid phantom. The range of hemoglobin concentrations is equivalent to blood volumes ranging from 2.5 to 10. For comparison, the typical resting cortical blood volume in the rat brain ranges from 2 to 5.31 Figure 8(b) shows the relative pathlength as a function of the hemoglobin concentration. The effective pathlength is normalized to the lowest hemoglobin concentration for presentation purposes. When averaged over all concentrations the effective pathlength was 27±2 mm. The data show that as optical absorption increases there is a systematic decrease in the relative pathlength. However, as the optical absorption is varied by more than fourfold there is less than a 15 change in the optical pathlength. During normal brain activation, venous blood oxygenation may change by as much as 5032 33 whereas the blood volume can be expected to change by a maximum of 10–20.34 35 For example, one can assume a relatively extreme case in which during activation the blood volume increases as ΔCBV/CBV=0.20. From a linear fit to the phantom data of Figure 8(b), the effective pathlength would change by less than 2. This would lead to an estimate of ΔCBV/CBV=0.18. It is probable that in most in vivo applications to the rat brain, the change in optical pathlength will be small compared to the change in absorption. While this layered is clearly a very rough approximation of tissue it illustrates the important point that as absorption is varied over a wide physiologic range the optical pathlength remains relatively invariant, although systematic errors can be introduced. Figure 8Results from phantom experiments. (a) Optical absorption as a function of the hemoglobin concentration. (b) Relative optical pathlength given by Eq. (29) as a function of the hemoglobin concentration in the phantom system. The pathlength data are normalized to the lowest Hb concentration to illustrate fractional changes.  4.Discussion and ConclusionsIt was demonstrated that by using a mild hypoxic challenge it is possible to normalize continuous-wave spectroscopic data to obtain pathlength-independent measures of tissue oxygenation and blood volume. The administration of 18 oxygen corresponds to a decrease in particle pressure of oxygen by 14. This would be equivalent to exposure at an altitude of 4000 ft, which is not generally hazardous.35 In anesthetized rats this leads to a maximal decrease in arterial saturation of Ya=0.8 , although on average the arterial saturation was reduced 10 relative to that of hyperoxia. Autoregulatory impairment is not expected when Ya>0.8 .26 27 28 29 30 In general, a change in arterial saturation fraction from Ya=1.0 to 0.9 was easily detected and therefore we feel that hypoxia need not go below this level for normalization purposes. Under certain pathological conditions where autoregulatory responses are compromised, it is expected that the response to oxygen will be altered. For example, transgenic mouse models of sickle cell disease have shown vascular responses to hyperoxia that are greater than those found in control animals.36 In such situations the oxygen response would not be useful as a normalization procedure, however we expect that the response to graded hypoxia could then be used as a means in itself to study the pathology. Physiologic normalization procedures have been utilized previously to study muscle function by normalizing signal changes to the maximally observed physiologic range obtained during cuff ischemia,37 however to date no means of quantifying this signal in the brain has been presented to our knowledge. We now discuss these results in terms of comparison with other NIRS methods, limitations, and interpretations of these results, and applications to optical imaging. 4.1.Diffusion Equation Methods for TOI EvaluationLight diffusion theory allows the evaluation of the tissue oxygenation index by measuring the dependence of change in light absorption on the optode spacing. For example, if one measures the local gradient of light attenuation, A=log(S) , with respect to source/detector spacing, ρ, one can determine the pathlength-independent product of the absorption and scattering via25 Assuming that changes in scattering are weak compared to changes in absorption during activation, as is also assumed in the normalization approach, Eq. (30) can be fit at various wavelengths and the tissue oxygenation index may be determined.25 38 39 Alternatively, using phase modulation or time of flight techniques it is also possible to obtain pathlength information. For diffusion theory to be valid, the optode spacing must be much greater than the optical scattering thus typically requiring fiber separations of 2–3 cm. While this is often employed in transcranial spectroscopy across the adult human head this cannot be achieved in small animal models where the separations are on the order of several millimeters. The hypoxia normalization method allows the changes in volume oxygenation to be determined without relying on explicit models of light diffusion. Therefore, under any conditions in which the pathlength is short relative to the scattering length it would be useful to perform physiologic normalization such as mild hypoxia. The primary assumptions in the normalization model are the validity of the Beer–Lambert approximation, as in Eqs. (1) and (2), and that the optical pathlength is not changed by the functional activation. The phantom study has shown that care must be taken in this assumption, however, for the range of absorption changes expected in the brain, the changes in pathlength are relatively small. This may not be valid in regions of higher blood volume, such as myocardial tissue, in which absorption changes will be more significant. 4.2.Partial Volume EffectsIt is important to note that the hypoxia method outlined above is only directly interpretable as changes relative to the entire area of tissue interrogated by the light. For example, if the area of activation were a small focal region with spatial extent smaller than the fiber spacings then it would be expected that upon charging the fiber spacing the relative volume and oxygenation changes for this region would be affected. This was clearly not the case for the hypercarbic challenge illustrated above although this would need to be confirmed for other conditions by performing similar pathlength alteration experiments. However, there are many cases where the methods outlined above should be useful to study less focal hemodynamic effects such as pharmaceutical drug dose responses and autoregulatory and systematic responses. The technique should still prove useful in comparing focal responses across subjects, in which case the normalized signal changes will represent a combination of the magnitude and spatial extent of the response. 4.3.Application to Multi Optode MappingThe use of recording from multiple optode arrays simultaneously allows one to map changes in blood oxygenation over the entire cortex.10 11 40 41 These methods have been exploited in the development of a variety of optical imaging systems. An implicit assumption in any continuous-wave mapping system is than when the spacing of optodes is constant the differential pathlength factor for all optodes is approximately equivalent and thus maps of relative hemoglobin changes truly reflect the degree of vascular activity. It is possible however that some optodes could be placed over regions with greater blood content than others, and thus responses would be weighted unequally. The hypoxia normalization technique could again provide a useful means by which to spatially normalize the response. Furthermore, if the assumption of equivalent pathlength is correct then maps of the oxygenation gradient, mY, response will provide a map of relative blood volume without the use of exogenous agents. In either case the implementation of this technique will improve the accuracy of the response maps and provide valuable quantitative data for cross-subject comparisons. AcknowledgmentsThe authors would like to thank Xiaoxian Ma for help with surgical preparations and Dr. Mary Fabry and Sandra Suzuka for assistance in the phantom experiments. REFERENCES
G. A. Milliken
,
“A simple photoelectric colorimeter,”
J. Physiol. (Paris) , 79 152
–158
(1933). Google Scholar
G. A. Milliken
,
“The oximeter, an instrument for measuring continuously the oxygen saturation of arterial blood in man,”
Rev. Sci. Instrum. , 13 434
–444
(1942). Google Scholar
F. F. Jobsis
,
“Noninvasive infrared monitoring of cerebral and myocardial oxygen sufficiency and circulatory parameters,”
Science , 198 1264
–1267
(1977). Google Scholar
M. Cope
and
D. T. Delpy
,
“System for long-term measurement of cerebral blood and tissue oxygenation on newborn infants by near intra-red transillumination,”
Med. Biol. Eng. Comput. , 26 289
–294
(1988). Google Scholar
J. C. Hebden
and
D. T. Delpy
,
“Diagnostic imaging with light,”
Br. J. Radiol. , 70 S206
–S214
(1997). Google Scholar
B. Chance
,
Z. Zhuang
,
C. Unah
,
C. Alter
, and
L. Lipton
,
“Cognition-activated low frequency modulation of light absorption in human brain,”
Proc. Natl. Acad. Sci. U.S.A. , 90 3770
–3774
(1993). Google Scholar
T. Kato
,
A. Kamei
,
S. Takashima
, and
T. Ozaki
,
“Human visual cortical function during photic stimulation monitoring by means of near infrared spectroscopy,”
J. Cereb. Blood Flow Metab. , 13 516
–520
(1993). Google Scholar
A. Villringer
,
J. Planck
,
C. Hock
,
L. Schleinkofer
, and
U. Dirnagl
,
“Near infrared spectroscopy (NIRS): A new tool to study hemodynamic changes during activation of brain function in human adults,”
Neurosci. Lett. , 154 101
–104
(1993). Google Scholar
M. Hoshi
and
M. Tamura
,
“Detection of dynamic changes in cerebral oxygenation coupled to neuronal function during metal work in man,”
Neurosci. Lett. , 150 5
–8
(1993). Google Scholar
A. Maki
,
Y. Yamashita
,
T. Ito
,
E. Watanabe
,
Y. Mayangi
, and
H. Koizumi
,
“Spatial and temporal analysis of human motor activity using non-invasive NIR topography,”
Med. Phys. , 22 1997
–2005
(1995). Google Scholar
A. Maki
,
Y. Yamashita
,
E. Watanabe
, and
H. Koizumi
,
“Visualizing human motor activity by using non-invasive optical topography,”
Front Med. Biol. Eng. , 7
(4), 285
–297
(1996). Google Scholar
E. Watanabe
,
A. Maki
,
F. Kawaguchi
,
Y. Yamashita
,
H. Koizumi
, and
Y. Mayanagi
,
“Non-invasive assessment of language dominance with near-infrared spectroscopic mapping,”
Neurosci. Lett. , 256 49
–52
(1998). Google Scholar
E. Watanabe
,
A. Maki
,
F. Kawaguch
,
Y. Yamashita
,
H. Koizumi
, and
Y. Mayanagi
,
“Non-invasive cerebral blood volume measurement during seizures using multichannel near infrared spectroscopic topography,”
J. Biomed. Opt. , 5
(3), 287
–290
(2000). Google Scholar
G. Taga
,
Y. Konishi
,
A. Maki
,
T. Tachibana
,
M. Fujiwara
, and
H. Koizumi
,
“Spontaneous oscillation of oxy- and deoxy-hemoglobin changes with a phase difference throughout the occipital cortex of newborn infants observed using non-invasive optical topography,”
Neurosci. Lett. , 282
(1–2), 101
–104
(2000). Google Scholar
G. Gratton
,
M. Fabini
,
P. M. Corballis
,
D. C. Hood
,
M. R. Goodman-Wood
,
J. Hirsh
,
K. Kim
,
D. Friedman
, and
E. Gratton
,
“Fast and localized event related optical signals (EROS) in the human occipetal cortex: Comparisons with the visual evoked potential and fMRI,”
Neuroimage , 6 168
–180
(1997). Google Scholar
E. Okada
,
M. Firbank
,
M. Schweiger
,
S. R. Arridge
,
M. Cope
, and
D. T. Delpy
,
“Theoretical and experimental investigation of near infrared light propagation in a model of the adult head,”
Appl. Opt. , 36
(1), 21
–31
(1997). Google Scholar
M. Hiraoka
,
M. Firbank
,
M. Essenpreis
,
M. Cope
,
S. R. Arridge
,
P. van der Zee
, and
D. T. Delpy
,
“A Monte Carlo investigation of optical pathlength in inhomogeneous tissue and its application to near-infrared spectroscopy,”
Phys. Med. Biol. , 38 1859
–1876
(1993). Google Scholar
A. Yodh
and
B. Chance
,
“Spectroscopy and imaging with diffusing light,”
Phys. Today , 48
(3), 34
–40
(1995). Google Scholar
R. A. DeBlasi
,
S. Fantini
,
M. A. Franceschini
,
M. Ferrari
, and
E. Gratton
,
“Cerebral and muscle oxygen saturation measurement by frequency-domain near-infra-red spectrometer,”
Med. Biol. Eng. Comput. , 33
(2), 228
–230
(1995). Google Scholar
M. S. Patterson
,
B. Chance
, and
B. C. Wilson
,
“Time resolved reflectance and transmittance for the non-invasive measurement of tissue optical properties,”
Appl. Opt. , 28
(12), 2331
–2336
(1989). Google Scholar
D. A. Benaron
and
D. K. Stevenson
,
“Optical time of flight and absorbance imaging of biological media,”
Science , 259 1463
–1466
(1993). Google Scholar
P. C. M. van Zijl
,
S. M. Eleff
,
J. A. Ultaowski
,
J. M. E. Oja
,
A. M. Ulug
,
R. J. Traystman
, and
R. A. Kauppinen
,
“Quantitative assessment of blood flow, blood volume, and blood oxygenation effects in functional magnetic resonance imaging,”
Nat. Med. , 4
(2), 159
–167
(1998). Google Scholar
G. Pawlik
,
A. Rackl
, and
R. J. Bing
,
“Quantitative capillary topography and blood flow in the cerebral cortex of cats: An in vivo microscopic study,”
Brain Res. , 113 27
–47
(1990). Google Scholar
M. Ferrari
,
T. Binzoni
, and
V. Quaresima
,
“Oxidative metabolism in muscle,”
Philos. Trans. R. Soc. London, Ser. B , 352 677
–683
(1977). Google Scholar
S. J. Matcher
,
P. Kirkpatrick
,
K. Nahid
,
M. Cope
, and
D. T. Delpy
,
“Absolute quantification methods in tissue near infrared spectroscopy,”
Proc. SPIE , 2389 486
–495
(1995). Google Scholar
J. S. Wyatt
,
M. Cope
,
D. T. Delpy
,
C. E. Richardson
,
A. D. Edwards
,
S. Wray
, and
E. O. Reynolds
,
“Quantitative of cerebral blood volume in human infants by near infrared spectroscopy,”
J. Appl. Physiol. , 68
(3), 1086
–1091
(1990). Google Scholar
H. Johannssen
and
B. K. Siesjo
,
“Cerebral blood flow and oxygen consumption in the rat in hypoxic hypoxia,”
Acta Physiol. Scand. , 93 515
–525
(1975). Google Scholar
A. D. Edwards
,
D. C. McCormick
,
S. C. Roth
,
C. E. Elwell
,
D. M. Peebles
,
M. Cope
,
J. S. Wyatt
,
D. T. Delpy
, and
E. O. R. Reynolds
,
“Cerebral hemodynamic effects of treatment with modified surfactant investigated by near infrared spectroscopy,”
Pediatr. Res. , 32
(5), 532
–536
(1992). Google Scholar
L. M. Adock
,
L. S. Wafelman
,
S. Hegemier
,
A. Moise
,
M. E. Speer
,
C. F. Contant
, and
J. Goodard-Finegold
,
“Neonatal intensive care application of near infrared spectroscopy,”
Clin. Perinatol. , 26
(4), 893
–903
(1999). Google Scholar
R. P. Kennan
,
B. E. Scanley
,
R. B. Innis
, and
J. C. Gore
,
“Physiologic basis for BOLD MR signal changes due to neuronal stimulation: Separation of blood volume and magnetic susceptibility effects,”
Magn. Reson. Med. , 40
(6), 840
–846
(1998). Google Scholar
Y. J. Liu
,
Y. L. Pu
,
P. T. Fox
, and
J. H. Gao
,
“Quantification of dynamic changes in cerebral venous oxygenation with MR phase imaging at 1.9 T,”
Magn. Reson. Med. , 41 407
–411
(1999). Google Scholar
J. B. Mandeville
,
J. J. A. Marota
,
K. B. E.
,
J. R. Keltner
,
R. Weissleder
,
B. R. Rosen
, and
R. M. Weiskoff
,
“Dynamic functional imaging of relative cerebral blood volume during rat forepaw stimulation,”
Magn. Reson. Med. , 39 615
–624
(1998). Google Scholar
M. E. Fabry
,
R. P. Kennan
,
C. Paszty
,
F. Constantini
,
E. M. Rubin
,
J. C. Gore
, and
R. L. Nagel
,
“Magnetic resonance evidence of organ hypoxia in a homozygous alpha-knockout of a transgenic mouse model for sickle cell disease,”
J. Clin. Invest. , 98
(11), 2450
–2454
(1996). Google Scholar
J. R. Wilson
,
K. Mancini
,
K. McCully
,
N. Ferrato
,
V. Lanoce
, and
B. Chance
,
“Noninvasive detection of skeletal muscle underperfusion with near-infrared spectroscopy in patients with heart failure,”
Circulation , 80 1668
–1703
(1989). Google Scholar
H. Liu
,
D. A. Boas
,
Y. Zhang
,
A. G. Yodh
, and
B. Chance
,
“A simplified approach to characterize optical properties and blood oxygenation in tissue using continuous near infrared light,”
Proc. SPIE , 2389 496
–502
(1995). Google Scholar
E. B. Sevick
,
B. Chance
,
J. Leigh
,
S. Nioka
, and
M. Maris
,
“Quantification of time- and frequency-resolved optical spectra from the determination of tissue oxygenation,”
Anal. Biochem. , 195 330
–351
(1991). Google Scholar
Q. S. Luo
,
S. Nioka
, and
B. Chance
,
“Functional near-infrared imager,”
Opt. Tomogr. Spectrosc. Tissue: SPIE, 2979 84
–93
(1997). Google Scholar
B. Chance
,
Q. Luo
,
S. Nioka
,
D. Alsop
, and
J. A. Detre
,
“Optical investigations of physiology: A study of intrinsic and extrinsic biomedical contrast,”
Philos. Trans. R. Soc. London, Ser. B , 352 707
–716
(1997). Google Scholar
|


CITATIONS
Cited by 8 scholarly publications.
Tissue optics
Blood
Hypoxia
Oxygen
Absorption
Near infrared spectroscopy
Tissues


