1.IntroductionColon cancer is one of the major causes of morbidity and mortality in both men and women. It is estimated that 135 400 will be diagnosed and 56 700 deaths will occur from colorectal cancer in 2001 in the U.S.1 If colorectal cancer is detected at an early stage, then the 5-year relative survival rate is 90; however only 37 of colorectal cancers are diagnosed at early stages. Hence, it is essential to device methods for early detection of the disease. Colorectal cancers have a broad range of neoplasms from benign growths to invasive cancer. There are three cells of lesions known, non-neoplastic polyps, neoplastic polyps (adenomatous polyps) and cancers. Polypoid lesion is defined as any mass projecting above the surface of normal mucosa.2 Non-neoplastic polyps are not generally considered precursors of cancer and adenomatous cells have a lot of clinical significance because they have a high probability of becoming malignant. Adenomatous polyps have three major subcells, tubular, tubulovillous, and villous, that are classified based on epithelial architecture. Apart from conventional methods of cancer diagnosis,3 4 5 6 there is a need to develop new approaches which are simple, objective, and noninvasive. Among the optical methods available, Fourier transform infrared (FTIR) spectroscopy has shown encouraging trends in the field of medicine. Various bimolecular components of the cell give a characteristic IR spectrum, which is rich in structural and functional aspects.7 8 The biochemical fingerprint of cells,9 tissues and fluids altered in a diseased state can be detected using IR spectroscopy. There are reports of the application of FTIR spectroscopy in the diagnosis of various cells of cancer.10 11 12 Gao et al.;13 carried out a FTIR study of the human breast, normal and carcinoma tissues, and their method of analysis resulted in nearly 100 diagnostic accuracy of carcinoma tissues from normal ones. The grading of breast tumors has also been achieved by FTIR successfully.14 Our group has previously reported that normal and malignant cells can be clearly distinguished using standard formalin-fixed tissues of colon cancer patients and FTIR microspectroscopy.15 There are no data available in the literature on FTIR of polypoid lesions, which may be vital in optical diagnosis of a pre-malignancy. In this article, we characterization adenomatous (pre-malignant) polyps and make a comparison with normal and cancerous tissues obtained from colon cancer patients. In addition, artificial neural network (ANN) analysis of spectra of different cells as a tool for diagnosis of the premalignant stage is also discussed. To our knowledge, this is the first report of FTIR data on polyp by advanced mathematical analysis. 2.Materials and Methods2.1.Sample PreparationFormalin-fixed, parafin-embedded tissues from colon adenocarcinoma patients were received from the histopathology files of Soroka University Medical Center (SUMC). The tissue samples selected for this study had normal, adenomatous polyp (pre-malignant) and malignant areas. Two thin (10 μm) parafin sections were cut from each biopsy; one was placed on a zinc–selenium slide and the other on a glass slide. The slide to be used for microscopic FTIR measurements was deparaffinized and dehydrated using a standard procedure.16 The second slide was stained with hematoxylin and eosin for a histology review. 2.2.FTIR MicrospectroscopyMicroscopic FTIR measurements were performed in transmission mode using the FTIR microscope IRscope II with a mercury–cadmium–telluride (MCT) detector coupled to the FTIR spectrometer (Bruker Equinox model 55/S, OPUS software). All three kinds of cells (normal, polyp, and malignant) in the tissue samples were obtained from each patient. Measurements were performed on normal, polyp, and cancerous epithelial cells from intestinal tissues using microscopic inspection in parallel with a detailed pathological analysis of the tissue architecture. During each measurement, the area of the sites measured was about 50×50 μm 2 , it had only a few cells. The spectra measured cover a wave number range of 600–4000 cm −1 in the mid-IR region. The number of co-added scans was increased to 128 to achieve a high signal to noise ratio. A data base of about 300 measured spectra at a resolution of 4 cm −1 was created. The spectra were normalized to an amide I peak after baseline correction for the entire spectrum using the rubber band method (a polynomial function). Spectral analysis was done using OPUS software. The integrated absorbance were calculated by a band fitting procedure that was reported previously.17 18 The error bar (standard error) was calculated for each sample (normal or malignant) separately for all patients reported in this article. 2.3.ANN Analysis of the FTIR Spectra of Normal, Polyp and Malignant Cells from Biopsy Tissue Samples of Colon Cancer PatientsArtificial intelligence (AI) is a well established area of computer science that focuses on the creation of software capable of performing highly sophisticated intelligent computational work similar to that of the brain. AI has two different classes, namely, the expert systems that simulate human experience using a set of rules and the other comprises systems modeling the function of the human brain.21 The human brain is the best recognition system in the world. In the recognition process, the biological neuron in a specific area of the brain identifies a given object by linking it with previous experience through past learning. ANN can be a computational model derived from hundreds of single units (like neurons) connected in a network. Each model [Figure 1(a)] is a processing element with weighted (the degree of importance) inputs, a transfer function (prescribed task) and the output. As the neurons are interconnected in the brain, the power of the ANN mainly depends on the number of connections between artificial neurons. ANNs can process huge amounts of data and make accurate predictions. There are various types of NNs (neural networks or models) designed that have different transfer functions and network connections. The applications of ANNs in medicine and biology are increasing rapidly.19 20 A detailed account of ANNs can be obtained from two excellent books21 22 and a review article.23 In our case, X(i) are the FTIR spectra, W(i) are the weights and Z is the assignment (prediction) given by the model f(w,x). Figure 1(a) Schematic of an artificial neuron. (b) Supervised network with a backpropagation learning rule. 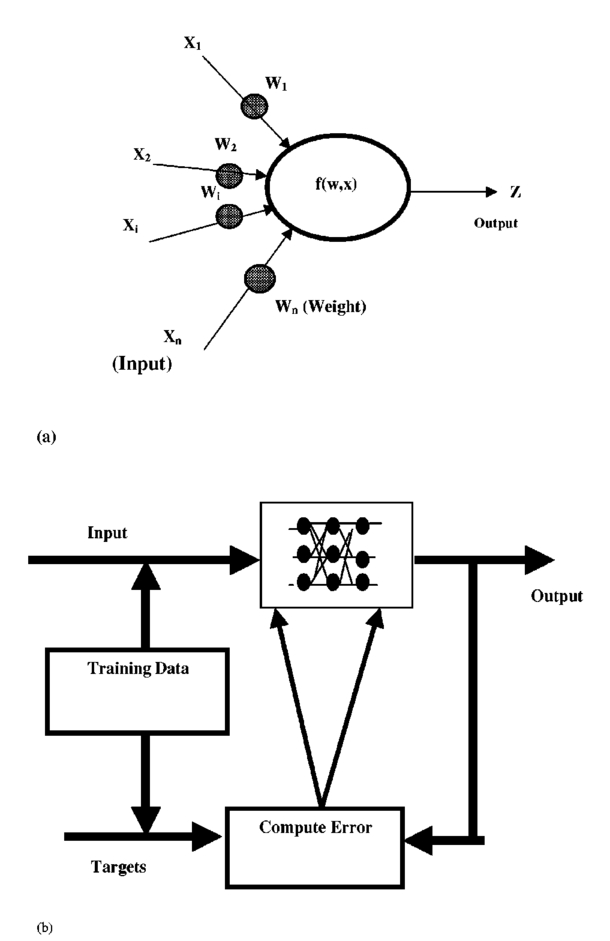 Multilayer perception (MLP) has commonly been used in many NN applications due to its simple implementation. The network consists of many processing elements connected in several layers. The output of one processing element is connected to the input paths of other processing elements through connection weights. When presented repetitively with the input and the desired output the MLP organizes internally, gradually adjusting the weights to achieve the input/output mapping desired. Given enough data it is possible to design and teach a MLP with one hidden layer to reproduce the behavior of any process, linear or nonlinear. The training process is shown in Figure 1(b), where the network is trained or “taught” by showing a set of examples, observing the network answers and correcting the “wrong” answers by changing or adapting the network weights. 2.4.Multiscale Decomposition by Fast Wavelet TransformAn appropriate description of a feature is considered to be one of the most important components of classification procedures. The result of feature extraction is a more concise description that still retains most of the spectrum characteristics. The use of features rather than the signal itself makes the classification process easier and faster. In this case, we have examined the performance of the NN based classifiers by performing multiscale decomposition of the spectrum.24 The wavelet transform provides an important tool for signal analysis and feature extraction.25 It provides a good local representation of the signal in both the time domain and the frequency domain. Shown in Figures 2(a) and 2(b) is the Fourier transform (FT), which is global and provides a description of the overall regularity of the signals, whereas the wavelet transform looks for the spatial distribution of singularities. While the FT decomposes the signal into a series of sinusoidal components, the fast wavelet transform (FWT) decomposes the signal into a series of wavelets of different scales and positions. Figure 2Graphic representation of a one-dimensional signal decomposition by (a) Fourier and (b) wavelet transforms. 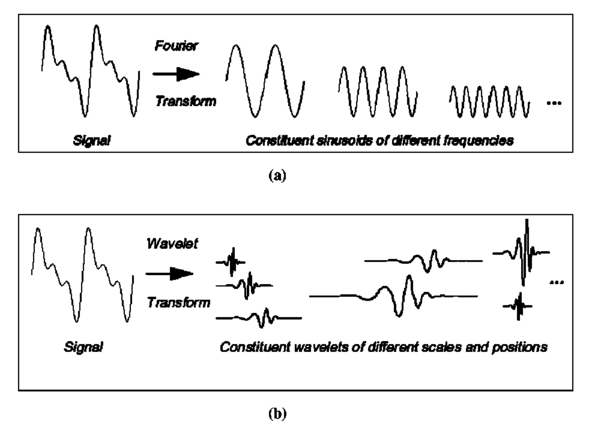 In this article, the FWT, proposed by Mallat and Zhong,25 was applied. The sampled spectrum is decomposed into an orthogonal set of wave forms that are the dilations, translations, and modulations of the Coiflet wavelet (the mother wavelet). The Coiflet wavelet was chosen because in practice it showed better results than other common wavelets that were tested. The wavelet transform is computed by convolving the spectrum with these dilated wavelets. The wavelets’ coefficients of the different scales offer a compact representation of the spectrum signal. It is evident that the transform involves differentiation and progressive smoothing. Details of the peaks are gradually lost as the downward slopes of the wave are picked up at higher scales. The number of scales is chosen by searching for the optimal signal representation. It was found that scales higher than the first five do not add significant information about the spectrum. In the present case, the performance of the MLP based classifier for different sets of wavelet coefficient features was examined (Table 1). The wavelet coefficients were located around the two main peaks of the spectra. Table 1
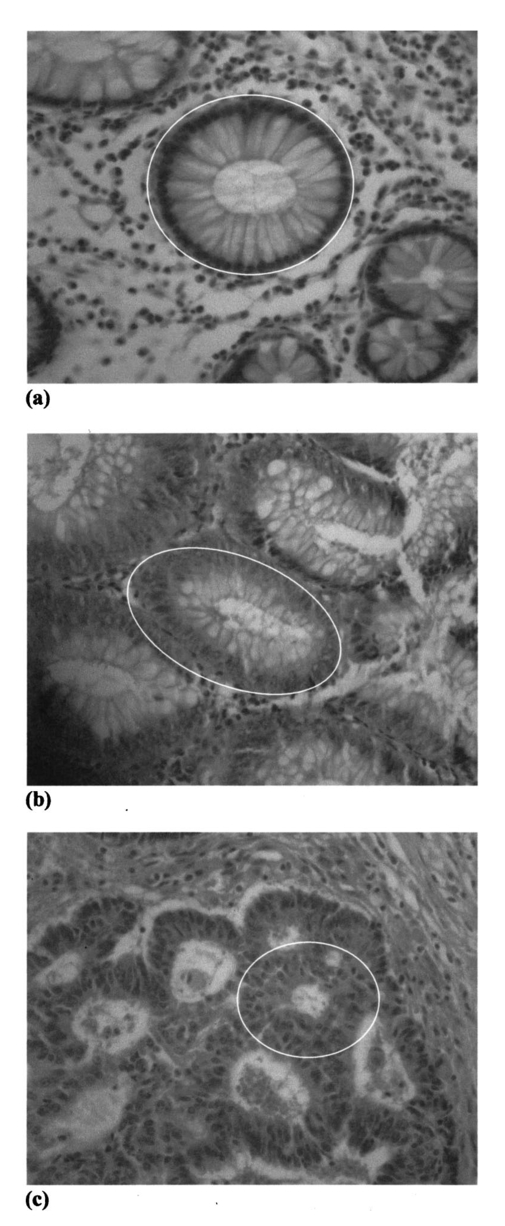
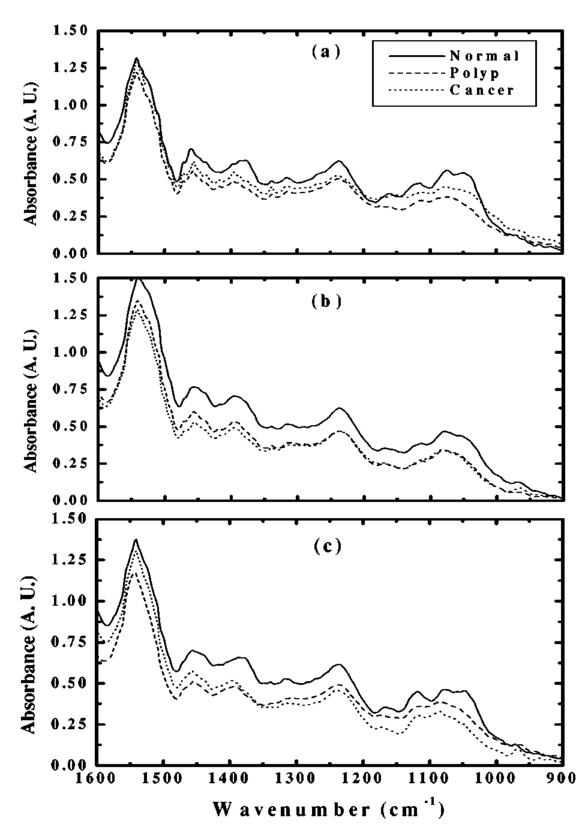
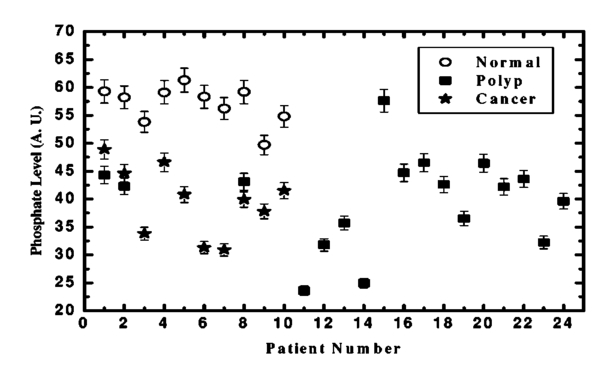
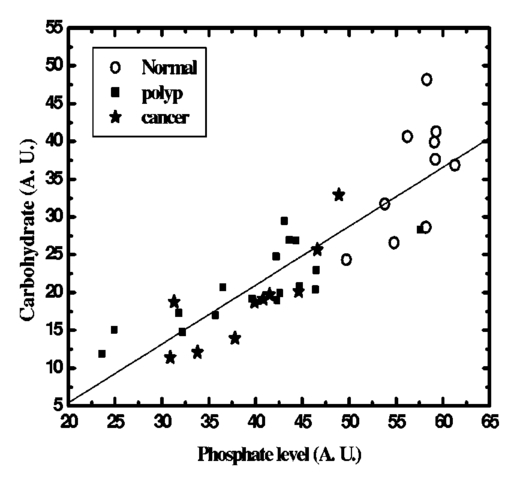
The data employed in this work was extracted from 25 patients. The data sets consist of three groups: the cancer group (83 records extracted from 11 patients), the control group (109 records extracted from 6 patients) and the polyp group (106 records extracted from 12 patients). A total of 298 records was available. The samples obtained were classified with the help of an expert pathologist and confirmed by clinical diagnosis using standard pathological methods. In this study, training and test sets were selected randomly from the same data sets. Seventy percent of each set was employed for training and the remainder was for testing. In addition, the simulations were repeated 100 times, with the same networks parameters but with different sets of randomly selected training vectors, and then the results were averaged. 3.Results3.1.Morphological Changes for Normal, Polyp and Malignant Lesions in Human Colonic TissueA histological cross section of formalin-fixed human colonic tissue is shown in Figure 3. The encircled areas in Figures 3(a)–3(c) show the site covered by FTIR-Monte Carlo (MC) measurements in this study. Figure 3(a) shows the crypts of the normal colonic mucosa. The epithelium surrounds a center opening and the lumen of the crypt. The normal epithelial cells show a single row of regular cells with small nuclei in the periphery of the cell and abundant cytoplasm. The nuclear to cytoplasm ratio is low. The extracellular matrix (lamina propria) around the epithelium consists of scattered lymphocytes and granulocytes (inflammatory cells) (dark dots). Figure 3(b) shows the neoplastic epithelial lesion (tubular adenoma), which shows a slight change from the normal architecture, with a slightly irregular crypt, and it has crowded nuclei. The nuclear to cytoplasm ratio is increased compared with that of normal colon tissue, while the lumen becomes narrow. Figure 3(c) depicts the adenocarcinoma of the colon, showing stratification of hyperchromatic nuclei with marked atypical cells. The glands become irregular and are back to back. The size of the lumen is uneven and contains cellular debris. There is a desmoplastic stromal reaction with a secondary inflammatory reaction. 3.2.FTIR Microspectroscopy (FTIR-MC) of Normal, Adenomatous Polyp and Malignant Human Colonic TissuesMicroscopic mid-IR spectra of normal, adenomatous polyp and malignant cells from biopsy tissue samples of three different patients of varying disease stages are shown in Figure 4. Patients (a), (b), and (c) are classified as those with early, moderate and advanced stages of malignancy, respectively, as assigned by group pathologists. Due to the limited availability of all three kinds of cells (normal, polyp, and malignant) in any given tissue sample, only three cases are given. The absorption due to normal tissue was higher than polyp and cancerous cells in this entire region of the spectrum in all three patients. In the early case [patient (a)], the absorbance of adenomatous polyp was higher than in the malignant cells. This trend was reversed in the advanced case [patient (c)]. This effect was more pronounced in the phosphate region compared to in other regions of the spectrum. There was a distinct change in the pattern in the region between 1000 and 1200 cm −1 for normal and abnormal tissue samples, which include polyp and malignant tissues. In the spectrum of normal cells, splitting can clearly be observed, whereas it disappeared in the case of adenomatous polyp and malignant cases. This has been observed in most of the cases studied by our group. No shifts in frequency were observed over the entire region (600–2000 cm −1 ) in any of the three cases. 3.3.Phosphate ContentThe variation of phosphate levels measured by integrating the absorbance between symmetric (1000–1150 cm −1 ) and asymmetric (1170–1310 cm −1 ) bands for 24 cases is presented in Figure 5. On average the phosphate level of polyp and malignant tissue samples was lower than that of the controls. The average content of polyp and malignant samples was equal. It is also clear from Figure 5 that the diversity among polyps was larger than for the malignant and the controls. 3.4.RNA/DNAThe ratio of absorbance at 1121/1021 provides an estimate of the RNA/DNA ratio in cells and it is found that this ratio increases with the stage of malignancy.26 Our analysis presented in Figure 6 indicates that the RNA/DNA ratio was lower for normal cells in comparison to that for polyp and malignant cells. Also, it is interesting to note that the RNA/DNA ratio was nearly constant for normal and polyp samples. But, there was a marked variation among the malignant samples obtained from different patients. 3.5.Two-dimensional Carbohydrate Versus Phosphate ContentIt is interesting to find the correlation between different metabolites among the different categories of cells. The two-dimensional (2D) plot shown in Figure 7 gives the relationship between carbohydrate and phosphate content in normal, polyp, and malignant cells. It is clear from Figure 7 that there is a linear correlation between these two metabolites. As was reflected in the earlier spectra, the normal samples had the highest carbohydrate and phosphate contents. There was no distinction between polyp and malignant samples. The perfect mixing of these two cells categorizes them into a single family. 3.6.Classification of Normal, Polyp and Malignant Samples by ANNA summary of the results obtained with the proposed classifier for five sets of features (Table 1) is shown in Table 2. The feature combinations were selected according to the biomarkers in their respective spectral regions. For example, the spectral region between 1055 and 1719 cm −1 includes the phosphate (both symmetric and asymmetric stretching bands) and total protein contents of the cells. The best results were obtained for the MLP with a set composed of 13 input feature coefficients located between 2465 and 2963 cm −1 which correspond to the absorption of phospholipids (set 1, Table 1). The MLP-based classifier resulted in sensitivity values of 89.4, 83.1, and 81.3 for normal, cancer, and polyp tissues, respectively. Although the sensitivity values obtained using this classifier were high, a careful analysis of Table 3 revealed that the false positive for normal was up to 10.6 which might be classified as either cancer (2.0) or polyp (8.6). On the other hand, the sum of the false negative and false positive for the polyp group was about 18.6 (about 9.7 of the polyp cases might be classified as normal while up to 8.9 might be classified as cancer). It is important to note that compared with the results obtained by the local density approximation (LDA)17 method for classification of normal and malignant samples from colon cancer patients, these results show good agreement and have greater consistency. Table 2
Table 3
4.DiscussionThe FTIR-MC spectra of normal, polyp, and malignant cells from tissue samples of different colon cancer patients showed the presence of two families: normal and abnormal and include polyp and malignant cells. The splitting pattern observed in the range between 1000 and 1150 cm −1 for normal cells and its absence in polyp and malignant cells clearly indicates that FTIR-MC is capable of detecting early malignancy among colon cancer patients using biopsied tissue samples. This observation has been consistent in many of our samples which have been studied and can be used as a reliable difference in the spectral pattern for diagnostic purposes. The grading of the malignancy has a profound effect on the variation in absorbance of the polyp with respect to malignant cells for the early and advanced stage patients shown in Figure 4. Our analysis showed that the spectral differences between polyp and malignant were not significant. Hence, more sophisticated computational tools are necessary to get good differentiation between these two kinds of cells, the results of which are discussed in the coming sections. The higher absorbance of normal relative to polyp and malignant cells may be attributed to the difference in the cellular life cycle in the tubular gland (called the crypt) between normal and malignant cells. Use of biological markers derived from IR spectroscopy in the identification of normal and malignant cells has been extensively investigated by many groups.27 Phosphate, one of the most abundant metabolites, clearly differentiates normal samples from both polyp and malignant classes. But, it fails to separate polyp from malignant cells in the tissue samples of colon cancer patients. The lower phosphate content for patients (sample Nos. 11 and 14) is possibly due to a reduction in the total carbohydrate level which is clear from the 2D plot shown in Figure 7. RNA/DNA can distinguish only normal cells from abnormal ones such as polyp and malignant. Again, the mixing of both polyp and malignant does not provide unambiguous identification of these two classes. Presently biological markers are not useful in the correct classification of polyp and malignant cells. Because the FTIR spectra and the biological markers were not capable of obtaining a good classification between polyp and malignant samples, we investigated the use of advanced computational methods. The correct diagnosis for normal cells was higher than that for polyp and malignant cells (Table 2). Therefore, normal can be differentiated from abnormal with good accuracy. Polyp and malignant classes have a similar classification percentage with various features. But, using selected regions of the spectrum provided better results in the case of polyp in comparison to malignant cells. The false negative diagnosis of polyp was about 20, indicating that progress still must be made to enhance the accuracy of identifying polyp at a high percentage. The ANN gives better classification for polyp and malignant cells than the other computational methods, such as cluster analysis and LDA (data not shown). The sensitivity of standard pathological methods using biopsies in the positive identification of adenoma is 83.6 and our method is comparable to this “gold standard” approach.28 In summary, our results using a limited data base are encouraging, and they are expected to improve dramatically with a larger data base and suitable changes in the computational methods. AcknowledgmentsThis research work was supported by the Israel Science Foundation (ISF Grant No:788/01), the Harry Stern Applied Research Grant Program and the Cancer Research Foundation of the Soroka University Medical Center in memory of Professor Tabb. Many thanks are due to Dr. V. Erukhimovitch for data collection and to Dr. B. Cohen for fruitful discussions. REFERENCES
T. J. Zuber
,
“Flexible sigmoidoscopy,”
Am. Fam. Physician , 6363 13751383
–13801388
(20012001). Google Scholar
T. Fibus
,
“Comparison of colonoscopy and double-contrast barium enema,”
N. Engl. J. Med. , 343 1728
–1729
(2000). Google Scholar
D. K. Rex
,
“Colon tumors and colonoscopy,”
Endoscopy , 32 874
–883
(2000). Google Scholar
H. Miyoshi
,
M. Oka
,
K. Sugi
,
O. Saitob
,
K. Katsu
, and
K. Uchida
,
“Accuracy of detection of colorectal neoplasia using an immunochemical occult blood test in symptomatic referred patients: Comparison of retrospective and prospective studies,”
Intern Med. , 39 701
–706
(2000). Google Scholar
M. Diem
,
S. Boydston-White
, and
L. Chiriboga
,
“Infrared spectroscopy of cells and tissues: Shining light onto a novel subject,”
Appl. Spectrosc. , 53 148A
–161A
(1999). Google Scholar
M. A. Cohenford
and
B. Rigas
,
“Cytologically normal cells from neoplastic cervical samples display extensive structural abnormalities on IR spectroscopy: Implications for tumor biology,”
Proc. Natl. Acad. Sci. U.S.A. , 95
(1998). Google Scholar
P. Lasch
and
D. Naumann
,
“FT-IR microspectroscopic imaging of human carcinoma thin sections based on pattern recognition techniques,”
Cell Mol. Biol. (Paris) , 44 189
–202
(1998). Google Scholar
S. Sukuta
and
R. Bruch
,
“Factor analysis of cancer Fourier transform infrared evanescent wave fiberoptical (FTIR-FEW) spectrum,”
Lasers Surg. Med. , 24 382
–388
(1999). Google Scholar
T. Gao
,
J. Feng
, and
Y. Ci
,
“Human breast carcinomal tissues display distinctive FTIR spectra: Implication for the histological characterization of carcinomas,”
Anal Cell Pathol. , 18 87
–93
(1999). Google Scholar
M. Jackson
,
J. R. Mansfield
,
B. Dolenko
,
R. L. Somorjai
,
H. H. Mantsch
, and
P. H. Watson
,
“Classification of breast tumors by grade and steroid receptor status using pattern recognition analysis of infrared spectra,”
Cancer Detect. Prev. , 23 245
–253
(1999). Google Scholar
J. Ramesh
,
A. Salman
,
S. Argov
,
J. Goldstein
,
I. Sinelnikov
,
S. Walfisch
,
H. Guterman
, and
S. Mordechai
,
“FTIR microscopic studies on mormal, polyp and malignant human colonic tissues,”
Subsurf. Sens. Technol. Appl. , 2 99
–117
(2001). Google Scholar
A. Salman
,
S. Argov
,
J. Ramesh
,
J. Goldstein
,
S. Igor
,
H. Guterman
, and
M. Shaul
,
“FTIR microscopic characterization of normal and malignant human colonic tissues,”
Cell Mol. Biol. (Paris) , 47
(22), OL159
–OL166
(2001). Google Scholar
G. W. Lucassen
,
P. J. Caspers
, and
G. J. Pupples
,
“In vivo infrared and Raman spectroscopy of human stratum corneum,”
Proc. SPIE , 3257 52
–60
(1998). Google Scholar
M. Hosseini
,
D. J. Madalena
, and
I. Spence
,
“Using artificial neural networks to classify the activity of capsaicin and its analogs,”
J. Chem. Inf. Comput. Sci. , 37 1129
–1137
(1997). Google Scholar
Z. Sun
,
X. Rao
,
L. Peng
, and
D. Xu
,
“Prediction of protein supersecondary structures based on the artificial neural network method,”
Protein Eng. , 10 763
–769
(1997). Google Scholar
S. Agatonovic-Kustrin
and
R. Beresford
,
“Basic concepts of artificial neural network (ANN) modeling and its application in pharmaceutical research,”
J. Pharm. Biomed. Anal , 22 717
–727
(2000). Google Scholar
S. G. Mallat
and
S. Zhong
,
“Characterization of signals from multiscale edges,”
IEEE Trans. Pattern Anal. Mach. Intell. , 10 710
–732
(1992). Google Scholar
P. G. Andreus
and
R. D. Strickland
,
“Cancer grading by Fourier transform infrared spectroscopy,”
Biospectroscopy , 4 37
–46
(1998). Google Scholar
D. Yang
,
D.J. Castro
,
I. H. El-Sayed
,
M. A. El-Sayed
,
R. E. Saxton
, and
N. Y. Zhang
,
“A Fourier-transform infrared spectroscopic comparison of cultured human fibroblast and fibrosarcoma cells: A new method for detection of malignancies,”
J. Clin. Laser Med. Surg. , 13 55
–59
(1995). Google Scholar
N. J. Petrelli
,
R. Letourneau
,
T. Weber
,
M. E. R. Nava
, and
M. Rodriguez-Bigas
,
“Accuracy of biopsy and cytology for the preoperative diagnosis of colorectal adenocarcinoma,”
J. Surg. Oncol. , 71 46
–49
(1999). Google Scholar
|
||||||||||||||||||||||||||||||||||||||||||||||||||||||||||||||||||||||||||||


CITATIONS
Cited by 149 scholarly publications and 6 patents.
FT-IR spectroscopy
Tissues
Colorectal cancer
Cancer
Imaging spectroscopy
Wavelets
Absorbance


