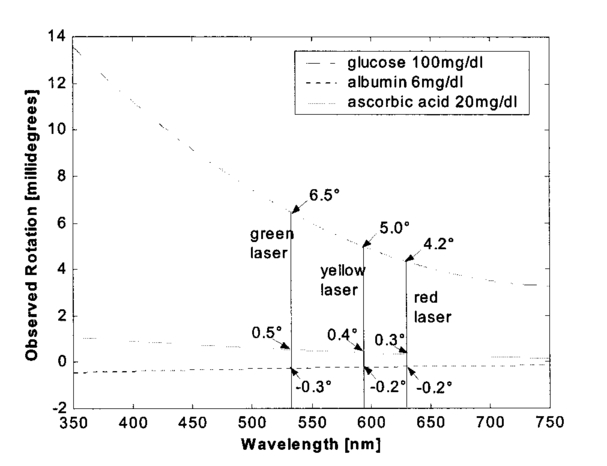
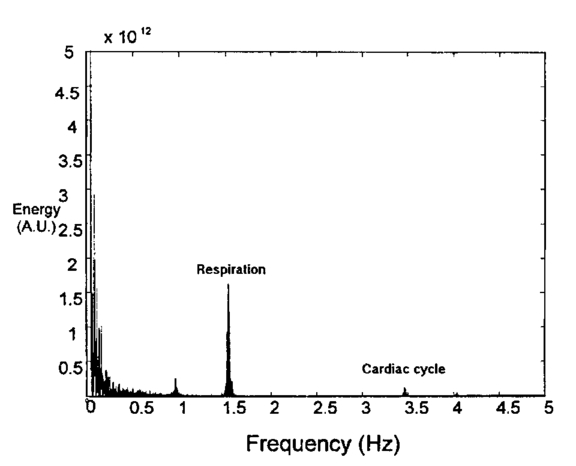
1.IntroductionThe disease diabetes mellitus currently afflicts over 100 million people worldwide and nearly 14 million in the United States.1 In the U.S., this disorder, along with its associated complications, is ranked as the sixth leading cause of death.2 Self-monitoring of blood glucose is recommended for diabetic patients as the current standard of care. Based on the findings released in the NIH-Diabetes Control and Complications Trial results,3 there is now no question that intensive management of blood sugars is an effective means by which to prevent or at least slow the progression of diabetic complications such as kidney failure, heart disease, gangrene, and blindness. The development of an optical polarimetric glucose sensor could potentially provide a means for the noninvasive measurement of blood glucose, thereby enabling an increased frequency of measurements to achieve tighter control of blood glucose, which will result in a reduction of secondary complications. The first documented use of polarized light to determine sugar concentration dates back to the late 1800s, where it was used for monitoring industrial sugar production processes.4 5 6 However, it is only in the last two decades that the use of polarized light has been applied to the physiological measurement of glucose. This initiative began in the early 1980s, when March, Rabinovich, and Adams7 8 proposed the application of this technique in the aqueous humor of the eye in order to develop a noninvasive blood glucose sensor. Their idea was to use this approach to noninvasively obtain aqueous humor glucose readings as an alternative to the invasively acquired blood glucose readings. Their findings, and that of prior work done by Pohjola,9 indicated that such a successful quantification of glucose concentration would correlate with actual blood glucose levels. During the same period, Gough10 reported that the confounding contributions of other optically active constituents in the aqueous humor may be a barrier for this technique to be viable. In the following decade, motion artifacts coupled to corneal birefringence,11 12 low signal-to-noise ratio,13 and the potential time lag between blood and aqueous humor concentrations during rapid glucose changes13 were identified as problems yet to be overcome for this technique to be viable. Throughout the 1990s considerable research was conducted toward improving the stability and sensitivity of the polarimetric approach using various systems while addressing the issue of signal size and establishing the feasibility of predicting physiological glucose concentrations in vitro, even in the presence of optical confounders.14 15 16 17 18 19 In particular, our group has developed a system with enough sensitivity to monitor glucose at physiologic concentrations (less than 0.4 mdeg rotation or rather less than 10 mg/dL glucose concentration).14 Our group has also identified the time lag between the blood and aqueous humor glucose levels to be less than 5 min using New Zealand white rabbits.20 Given the above background, the focus of this paper is to report on the latest results of our group, namely, the effect of pH and temperature on the signal and the problematic effects of corneal birefringence due to motion artifacts. 2.Materials and Methods2.1.Temperature and pH Effects on the Optical Rotatory Dispersion of Analytes in the EyeIn order to understand optical rotatory dispersion (ORD), one must first understand that the polarimetric approach is based on the fact that chiral molecules, such as glucose, due to their asymmetric nature rotate the azimuthal angle of the polarization vector of a propagating linear polarized beam by an amount, α, that is proportional to their concentration, C, for a given pathlength, L, pH, temperature, T, and wavelength, λ. The formula for this effect is given as where [α]λ,pH T is a particular molecule’s unique specific rotation.For a given chiral substance, the wavelength dependence of specific rotation provides the ORD characteristics of the constituent molecule. This is governed by Eq. (2), which is an approximation of Drude’s equation and is only useful between the absorption bands for a given molecule.21 The importance of this equation is that once the constants k0 and λ0 are computed by determining the specific rotation at two different wavelengths, one can then determine the specific rotation for any wavelength, λ, within the range, providing the pH and temperature are fixed. In a situation where more than one chiral component is present in a sample, determining the specific rotation at different wavelengths enables isolation of the contributions of a particular analyte of interest. This is accomplished by applying the superposition theorem to build a multispectral regression model.22 Knowing the ORD characteristics of each constituent chiral component enables the optimal selection of wavelengths to produce the best possible prediction model for the analyte of interest. For this study, we investigated the effects of variations in temperature and pH on the ORD visible spectrum for glucose and albumin, the major chiral protein in aqueous humor. The system that we designed and constructed to measure the ORD spectra is depicted in Figure 1. The system utilizes a xenon arc lamp (Oriel Corporation, Stratford, CT) as a white light source. The source light passes through a monochromator, Spex 270M (Spex Industries, Inc., Edison, NJ), that is controlled via a serial cable by a LABVIEW™ 5.1 (National Instruments, Austin, TX) program written to select individual wavelengths of interest. The selected wavelength of light is modulated at 1 kHz by an optical chopper (Oriel Corp.), then linearly polarized by a Glan–Thompson 100 000:1 polarizer (Newport Corporation, Fountain Valley, CA) oriented at +45° before passing through the sample. The sample is contained in a 10 cm optical-grade glass sample cell (Starna Cells, Inc., Atascadero, CA) immersed in an in-house built, insulated, temperature regulated, water bath. In order to extract only the optical rotation information from the polarized light beam, the output light from the sample is then separated into two orthogonal polarization components by a broadband polarizing beam splitter (Newport Corp.) before being detected by two dc-biased photodiode light detectors (Thorlabs, Inc., Newton, NJ). The two orthogonal output components are then individually amplified by wide bandwidth amplifiers (Melles Griot Electro-optics, Boulder, CO) before being sent to separate digital lock-in amplifiers (DLIAs) (Stanford Research Systems, Sunnyvale, CA). The DLIAs extract the detected signal modulated at 1 kHz and reject contributions by noise at all other frequencies. This information is routed to a Pentium II PC via a general purpose interface bus (GPIB). The data are processed to compute the ORD spectra. All spectra were collected for the wavelength range of 350–750 nm with a 5 nm step size. All voltage values were acquired by averaging six measurements for each wavelength. All sample solutions were prepared from research-grade chemicals (Sigma Chemical Co., St. Louis, MO) dissolved in de-ionized water and adjusted to the desired pH using drops of 2 N HCl and 2 N NaOH. All temperature readings were recorded with an Omega digital thermometer with ±0.1 °C precision. The results are given in Sec. 3.1. 2.2.Corneal BirefringenceBirefringence is the condition in which two orthogonally oriented differing refractive indices of light exist for a substance due to its physical and molecular structure. These are described as the ordinary refractive index, η0 (that along the slow axis), and the extraordinary refractive index ηe (that along the fast axis). The cornea of the eye is known to be a birefringent material. In our experiments the eye was modeled as a linear retarder. This means that, for a linear input polarization state, the eye’s linear birefringence causes a change in the state of polarization (SOP) from a linear to an elliptical state due to the phase retardance, δ, introduced and defined in Eq. (3).23 This then creates a change in the signal detected as the ellipticity of the ensuing elliptically polarized beam varies with the changes in birefringence (η0–ηe). If the cornea were a stable, fixed, birefringent element such as a wave plate, its effects could easily be theoretically eliminated. However, there is valid concern that corneal birefringence may become problematic when there is a motion artifact because the effect of nonstationary birefringence may mask the signature of glucose. To assess and quantify this problem the experimental system described in Figure 2 was developed. As depicted, a diode laser (Laser Max, Inc., Rochester, NY ) emitting 3.5 mW of power at a wavelength of 635 nm (red) is used as the light source. The laser beam is linearly polarized by the initial Glan–Thompson 100 000:1 polarizer present in the optical train. Modulation of the polarization vector is then provided by the initial Faraday rotator driven by a sinusoidal function generator at a frequency of 1.09 kHz and a modulation depth of approximately ±1°. This modulated signal propagates through a test tube that is designed with plane parallel windows and filled with saline for index matching. The test tube apparatus surrounds the anesthetized rabbit’s eye to allow propagation of light directly through the anterior chamber of the eye. A second Faraday rotator is used to provide feedback compensation within the system. The purpose of this component is to nullify or eliminate any rotation due to the optically active sample. Following the compensation Faraday is another cross-polarized Glan–Thompson polarizer known as the analyzer, which is oriented 90° with respect to the initial polarizer. This configuration of the analyzer transforms the modulation of the polarization vector into intensity modulation according to Malus’ law. The optical train is terminated by a biased photodiode light detector (Thorlabs, Inc.). This detector outputs a voltage proportional to the detected light intensity, which is used as input into the digital controller. Figure 2Block diagram of the digital closed-loop controlled polarimeter designed and implemented, in which the sample holder is used for in vitro samples and the eye coupling device is used for in vivo studies.  A digital lock-in amplifier (Stanford Research Systems, SR830) is used to measure the relative amplitude of the signal present at the modulation frequency. This information is sent via a GPIB connection to a PC as input into the digital control algorithm. The output of the algorithm is then transformed into a dc voltage that is sent back out through a GPIB controlled HP power supply. This output is used to drive the compensation Faraday rotator and to nullify the system. Mathematically, the operation of the system is based on Eq. (4), where θm is the depth of the Faraday modulation, ωm is the modulation frequency, and ϕ represents the rotation due to the optically active sample subtracted by any feedback rotation due to the compensation Faraday rotator. From Eq. (4), it is evident that, without an optical active sample and with the dc term removed, the signal detected only consists of the double modulation frequency (2ωm) term. However, when an optically active sample is present, such as glucose, or when there is corneal birefringence, the signal detected then becomes an asymmetric sinusoid, which contains both the fundamental (ωm) and the 2ωm modulation frequency terms. A spectral analysis of the data that was obtained from the lock-in amplifier was performed to isolate the source of the noise and these results are given in Sec. 3.2.1. In order to compensate for a motion induced corneal birefringence artifact one must have an understanding of how these birefringence changes affect the detected measurement signal. This was accomplished using both simulation and experimentation. The simulation results are given in Sec. 3.2.2. The experimental system used to characterize corneal birefringence is described below and the results given in Sec. 3.2.3. The experimental setup for assessing corneal birefringence in excised rabbit eyes is shown in Figure 3. The light source is a 3.5 mW 635 nm red diode laser (Laser Max, Inc.). An optical chopper wheel (Oriel Corp.) at a frequency of 1.1 kHz modulates the light beam from the laser. The modulated light beam is then separated into two orthogonal propagating beams by a nonpolarizing beamsplitter (Melles Griot). The beam propagating perpendicular with respect to the original input beam passes through a polarizer (Edmund Scientific, Barrington, NJ) before being detected by a biased photodiode detector (Thorlabs, Inc.), for use as a reference measurement. The beam propagating forward with respect to the original input beam is apertured before being passed through a Glan–Thompson 100 000:1 polarizer (Newport Corp.) that converts it into a linear horizontally polarized beam. This beam is then converted into a right circular polarized beam by a quarter wave plate (QWP) with a fast axis +45° with respect to the vertical axis. The circular polarized beam is apertured to a 0.5 mm diameter before probing the eye sample contained in a nonbirefringent, saline filled, eye sample cell holder that was made in house. The eye holder uses suction to fixate the eye in place and is mounted on a stage that can be adjusted both vertically and horizontally for placement of the eye in the beam’s path. The ensuing beam is passed through another Glan–Thompson polarizer, whose polarization axis is manually incrementally rotated through 210°, to produce a corresponding measurement intensity. The light intensity is detected by another pin photodiode detector (Thorlabs, Inc.). The two photodiode detectors convert the measured intensities to proportional voltages that are extracted by lock-in amplifiers SR830 and SR850 (Stanford Research Systems) using the 1.1 kHz optical chopper frequency reference. The output voltage from the lock-in amplifiers is then acquired for processing by a Pentium II PC via a NI (DAQ) broad operated by a LABVIEW 5.1 (National Instruments, Austin, TX) program. 3.Results and Discussion3.1.Temperature and pH ResultsIn order to enable the rotation of the input beam by the sample to be distinguished from the sample’s absorption spectra and from the system’s spectral response, a set of water reference spectra was used to nullify the system for one of the three temperature levels investigated. In Figure 4, it is evident that the two orthogonal component spectra are closely matched in shape and intensity. These water reference spectra were saved as the system calibration data set and all sample spectra were divided by their respective orthogonal reference spectrum. Figure 4Normalized smoothed spectra for parallel and perpendicular components of the water reference; here the x axis is the wavelength (nm) and the y axis is the intensity. 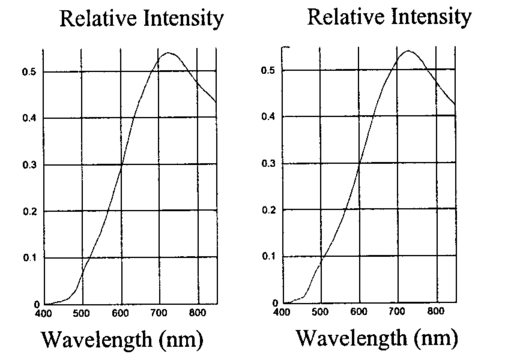 Depicted in Figure 5 are the ORD curves (λ from 350 to 750 nm) for albumin at two different temperatures (15 and 26 °C) and two different pH values (6.8 and 7.5). As is shown, the absolute value of the specific rotation rises substantially with the temperature and pH, particularly, below a wavelength range of 550–600 nm. For the glucose results taken at the same two temperatures (15 and 26 °C) a rise in the absolute value of the specific rotation is also seen (Figure 6). With a pH change of 6.4 to 7.1 a fall in the specific rotation was observed. Thus a third pH of 7.6 was tested and subsequently a rise in the specific rotation was observed. This observed fall then rise in specific rotation with the pH needs further confirmation by more pH values but this effect is a result that has been noted in the literature for other chemical constituents.24 Overall, the results show changes in the specific rotation for large swings in temperature and pH. However, for the wavelength region that we are interested in observing (above 635 nm) and for the normal variations in physiologic temperature and pH of less than a few degrees and tenths of pH units, the effect is expected to be negligible. In fact, as illustrated in Figure 7, for a given pH and temperature it can be seen that the contributions by albumin and another potential confounder (ascorbic acid), evaluated at their average physiological levels, are negligible, particularly at higher wavelengths. This is based on the assumption that any fluctuations in their concentrations within their full physiological ranges will be minimal and slow in the aqueous humor compared to those of glucose. In addition, these two components are contrarotatory and thus will partially cancel each other. Therefore, it is not likely that these optically active substances in the eye will significantly affect the glucose signal. However, if necessary, a multiwavelength system should enable the compensation of any confounding effects due to other chiral analytes. These conclusions are supported by the results from prior work done by this group (King et al.;25 and Cameron et al.;15) all of which indicate a significant decrease in glucose prediction errors, in the presence of confounders, utilizing a multiwavelength system compared to the results obtained using a single wavelength system. Figure 5Optical rotary dispersion graphs for albumin for two temperatures and two pH combinations. For a temperature of 15 °C, solid line=pH of 6.8; dashed line=pH of 7.5. For a temperature of 26 °C, x=pH of 6.8; +=pH of 7.5. Note that the absolute value of the specific rotation increases with both the temperature and pH.  Figure 6Optical rotary dispersion graphs for glucose for two temperatures and three pH combinations. For 15 °C, solid line=pH of 6.4; dashed line=pH of 7.1; stars=pH of 7.6. For 26 °C, circles=pH of 6.4; squares=pH of 7.1; +=pH of 7.6. Note that the specific rotation always increases with the temperature for a given pH while it decreases and then increases with an increase in pH for a given temperature.  3.2.Corneal Birefringence Results3.2.1.Characterization of Corneal Motion ArtifactAs depicted in Figure 8, the motion induced corneal birefringence artifact depicted on the detector of the system in Figure 2 for the in vivo rabbit experiment was found to be primarily due to respiratory motion and, to a limited extent, the cardiac cycle. Since this was a direct response to the respiration and the cardiac cycle and not to some random eye motion, this means that it cannot be entirely removed (for instance, in a human by asking the person to focus his vision straight ahead). Thus, this finding necessitates that one understands corneal birefringence across the eye and the development of a robust method for measurement in the presence of moving corneal birefringence. 3.2.2.Corneal Birefringence Simulation ResultsFigure 9 is a MATLAB generated simulation of the effects of linear birefringence. The birefringence values used for the simulation are within the range based on the measured refractive index variations available in the literature for the fast and slow axes of rabbit cornea.26 As reported in the literature, (η0–ηe) varies in the eye within the range of 0 at the apex or top of the cornea to 5.5×10⁻⁴ at the base of the cornea, where it attaches to the sclera. Therefore, a net change in the retardance, δ, can be calculated using Eq. (3) for a given corneal thickness, t, and wavelength, λ. Figure 9 substantiates the changes of a horizontal linear SOP into an elliptical SOP whose ellipticity changes with variations in the sample birefringence when the input SOP is aligned with neither the slow or fast axis of birefringence. For this simulation a fast axis of birefringence of 160° was used, comparable to that found experimentally, and the value of the retardance was varied by varying the refractive indices around the center of the eye (from 1.0×10⁻⁴ to 3.0×10⁻⁴) for a given corneal pathlength of 0.407 mm and wavelength of 633 nm. This variation showed a slight shift in the minimum as seen in Figure 9(a) and spreading of the ellipse, depicted in Figure 9(b). This would be comparable to slight changes in the retardance according to position of the beam on the cornea as is likely the case for the three eyes used in the experiment. Figure 9MATLAB derived simulations illustrating the effects of changing birefringence, (η0–ηe), on the detected intensities. [The difference in index varied from 1×10⁻⁴ (triangle) to 2×10⁻⁴ (diamond) to 3×10⁻⁴ (circle).] The plots were derived by rotating the analyzer with respect to the polarizer to determine the effect on a birefringent sample placed in between them. (a) For a birefringent crystal the intensities detected vary sinusoidally as the polarizer/analyzer plane is rotated through 180°. The birefringence has the effect of introducing a phase shift in the detected intensities. (b) This plot was produced by plotting the intensity detected at a given angle vs the normalized theoretical detection intensity for a polarizer and rotating analyzer combination without a sample (i.e., the cosine squared of the input angle). Without birefringence you would have a straight line. With a change in birefringence you can see the conversion of linear polarization into elliptical polarization states of varying ellipticity and azimuthal angle of the major axis.  3.2.3.Experimental Corneal Birefringence ResultsAs shown in Figure 10, the birefringence curves for three separate rabbit eyes were obtained using the experimental setup depicted in Figure 3. The light beam was centered at roughly the midpoint between the apex of the cornea and the base of the cornea (where it meets the sclera). As can be seen in Figure 10(a) the minimum point varies slightly between eyes. This is likely due to a slight change in the retardance between eyes as a result of a slightly different index of refraction change. In addition, this change in birefringence is shown in Figure 10(b) by the change in ellipticity. This is confirmed by the simulation depicted in Figure 9 in which the retardance was varied. The change in corneal retardance is likely caused by the well-documented change in corneal retardance according to the position with respect to the apex of the cornea. This confirms that slight changes in position with a motion artifact can greatly affect the polarization signal. These recent findings are encouraging and suggest that the birefringent portions of the corneal surface, in a rabbit model, all have a relatively universal fast axis located approximately 160° from the vertical axis, defined as a line that runs from the apex of the cornea through the pupil. Although more rabbit eyes need to be investigated with the light source at various locations across the cornea, this preliminary finding coupled with understanding of how birefringence affects the signal detected allows theoretical elimination of the effects of changing birefringence on measurement of the azimuthal rotation of the linear polarization vector due to glucose. Figure 10(a) Normalized plot of corneal birefringence from three different rabbit eyes showing a minimum and hence fast axis of birefringence at roughly 160°. (b) Plot of the cosine of the angle of the analyzer squared (from 0° to 180°) vs the normalized values in which the minimum for each plot was set to zero. This shows the characteristic elliptical birefringence.  4.ConclusionIn this paper, introduction of the use of polarized light into the aqueous humor of the eye was described as a potential means by which to noninvasively quantify blood glucose levels. The effect of large fluctuations in temperature and pH on the ORD curves of glucose and albumin was shown to be substantial, particularly below a wavelength of 600 nm. However, for normal physiologic ranges and for the wavelength range above 600 nm, their contributions are negligible. If necessary, the prediction errors for glucose can be improved if a multiwavelength system is utilized. In addition, the effect of changing corneal birefringence on our glucose measurements was characterized in vivo and the system was modeled and characterized for the eye in vitro. This information will enable the design and implementation of a closed loop multiwavelength system that will potentially facilitate accurate repeatable measurement of glucose in vivo. AcknowledgmentsThis work was supported, in part, by a grant from the National Medical Technology Testbed (NMTB), a subcontract under the U.S. Army Medical Research Acquisition Activity (Grant No. DAMD17-97-2-7016). The view, opinions, and/or findings contained in this paper are those of the authors and should not be construed as a position, policy, decision, or endorsement of the federal government or of National Medical Technology Testbed, Inc. REFERENCES
B. Rabinovitch
,
W. F. March
, and
R. L. Adams
,
“Noninvasive glucose monitoring of the aqueous humor of the eye. Part I. Measurement of very small optical rotations,”
Diabetes Care , 5 254
–258
(1982). Google Scholar
W. F. March
,
B. Rabinovitch
, and
R. L. Adams
,
“Noninvasive glucose monitoring of the aqueous humor of the eye. Part II. Animal studies and the scleral lens,”
Diabetes Care , 5 259
–265
(1982). Google Scholar
S. Pohjola
,
“The glucose content of aqueous humor in man,”
Acta Ophthalmol. , 88 11
–80
(1966). Google Scholar
D. A. Gough
,
“The composition and optical rotatory dispersion of bovine aqueous humor,”
Diabetes Care , 5 266
–270
(1982). Google Scholar
G. L. Cote´
,
“Noninvasive optical glucose sensing—An overview,”
J. Clin. Eng. , 22
(4), 253
–259
(1997). Google Scholar
G. L. Cote´
,
M. D. Fox
, and
R. B. Northrop
,
“Noninvasive optical polarimetric glucose sensing using a true phase technique,”
IEEE Trans. Biomed. Eng. , 39
(7), 752
–756
(1992). Google Scholar
D. C. Kloonoff
,
“Noninvasive blood glucose monitoring,”
Diabetes Care , 20
(3), 433
–437
(1997). Google Scholar
B. D. Cameron
and
G. L. Cote´
,
“Noninvasive glucose sensing utilizing a digital closed-loop polarimetric approach,”
IEEE Trans. Biomed. Eng. , 44
(12), 1221
–1227
(1997). Google Scholar
B. C. Cameron
,
H. W. Gorde
,
B. Satheesan
, and
G. L. Cote´
,
“The use of polarized light through the eye for noninvasive glucose monitoring,”
Diabetes Technol. Ther. , 1
(12), 135
–143
(1999). Google Scholar
C. Chou
,
C. Y. Han
,
W. C. Kuo
,
Y. C. Huang
,
C. M. Feng
, and
J. C. Shyu
,
“Noninvasive glucose monitoring in vivo with an optical heterodyne polarimeter,”
Appl. Opt. , 37 3553
–3557
(1998). Google Scholar
B.D. Cameron
,
J.S. Baba
, and
G.L. Cote´
,
“Measurements of the glucose transport time-delay between blood and aqueous humor of the eye for the eventual development of a noninvasive glucose sensor,”
Diabetes Technol Ther. , 3
(2), 201
–207
(2001). Google Scholar
V. Toome
and
G. Reymond
,
“Solvent and pH effects on sign of ORD spectrum of N-methyl-4-phenyl-7-methoxy-1,2,3,4-tetrahydroisoquinoline in visible spectral range,”
Spectrosc. Lett. , 8 595
–598
(1975). Google Scholar
T. W. King
,
G. L. Cote´
,
R. McNichols
, and
M. J. Goetz
,
“Multispectral polarimetric glucose detection using a single Pockels’ cell,”
Opt. Eng. , 33 2746
–2753
(1994). Google Scholar
J. Y. T. Wang
and
F. A. Bethtelheim
,
“Comparative birefringence of cornea,”
Comp. Biochem. Physiol., Part A: Mol. Integr. Physiol. , 51 89
–94
(1975). Google Scholar
|


CITATIONS
Cited by 67 scholarly publications and 5 patents.


