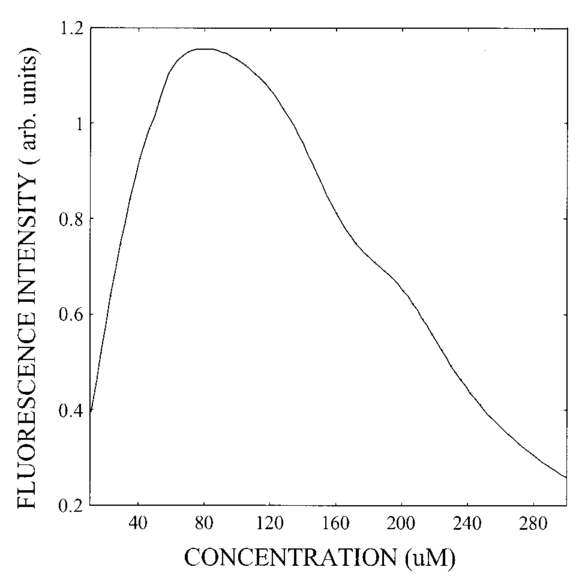
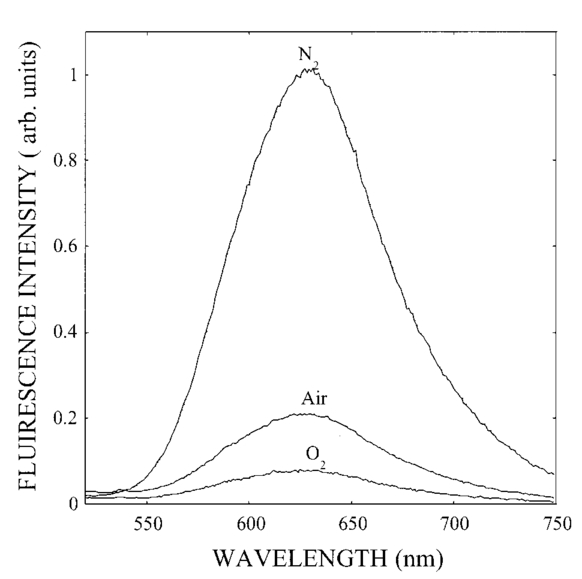
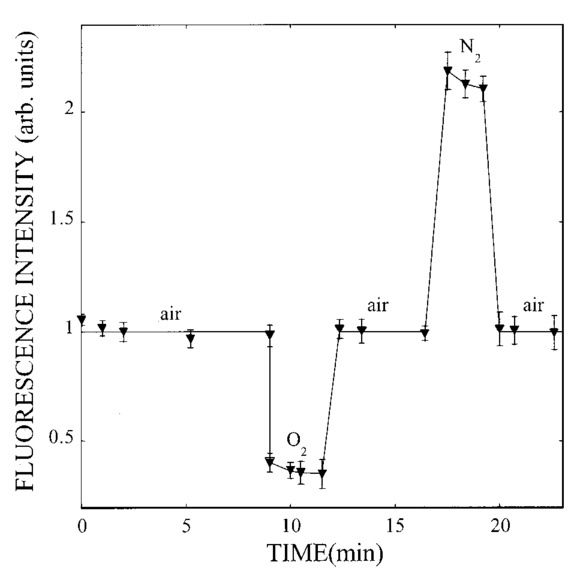
1.IntroductionIn spite of the significance of intracellular oxygen levels in numerous cellular processes, there are surprisingly few analytical methods to measure intracellular oxygen levels. The role of oxygen in cellular processes is mostly assessed by indirect data derived from measurements of the concentration of extracellular oxygen.1 2 This approach is ambiguous, as there is a difference between the intracellular and extracellular oxygen concentration.3 4 Clark electrodes have been widely used to measure extracellular oxygen level in cell culture media.1 5 However, when applied in intracellular studies, the electrodes may injure the cell due to the penetration. A Clark microelectrode can only measure the oxygen level in one cell at a time and is not suitable in applications that require fast cell screening. Furthermore, the technique often gives misleading data due to the abundance of interfering species in cytoplasm. Additionally, the consumption of oxygen by Clark electrodes can alter the oxygen level near the surface of the electrode and cause an error in the oxygen measurement. Fluorescence microscopy and spectroscopy are widely used techniques for cellular analysis. In 1970, Vaughan and Webber observed that oxygen concentrations in the physiological range quench the fluorescence of pyrenebutyric acid in solution.6 The observation led to the use of pyrenebutyric acid for intracellular oxygen measurements in isolated rat liver cells.7 8 9 The technique offered several advantages: First, the dye detected the intracellular oxygen concentration directly without consuming oxygen. Second, electromagnetic interference or changes due to stirring or fluid currents did not affect the accuracy of the technique. Third, loading of the indicator into cells was less invasive than the penetration of electrodes. Furthermore, chemical information was obtained from a large number of cells simultaneously and in real time. However, the lack of a suitable indicator limited the quantitative power of the technique. The excitation and emission of pyrene and its derivatives are in the ultraviolet (UV), overlapping with cellular autofluorescence. This resulted in high background that complicated the data interpretation. Additionally, these dyes show poor photostability and poor chemical stability in the cellular environment. Wilson et al.; introduced phosphorescence quenching as an alternative to fluorescence quenching of pyrene for intracellular and tissue measurements of molecular oxygen.9 10 11 The method dramatically extends the oxygen sensitivity range down to nanomolar scale, a parameter that no other techniques have achieved. The technique was applied to study oxygen distribution in perfused tissue,12 oxygen consumption by suspensions of mitochondria,13 and cellular energetics in cardiac myocytes.14 However, the long lifetime of the phosphorescent probes allows interactions between the probes and the environment. Most of the few available phosphorescent probes are pH and temperature sensitive, which limits the accuracy of the technique. In addition, due to the inefficient intersystem crossing rate, quantum yield of the indicators is low which requires a highly sensitive detection system. Ruthenium diimine complexes represent an important class of fluorescence-based oxygen indicators. The photophysics and photochemistry of these complexes have been extensively studied by Demas et al.;15 16 17 18 19 They show great photostability and high fluorescence quantum yield (0.1–0.6). Unlike pyrene and its derivatives the excitation wavelength of these complexes is in the visible range of the electromagnetic spectrum (450–460 nm). The emission maximum of these complexes is at 610 nm. This large Stokes shift increases the signal to noise ratio of the fluorescence measurements in biological samples because no cellular autofluorescence is observed at this wavelength. Additionally, the background scattering is lower than the background scattering observed when pyrene is used for oxygen measurements. This is because the scattering intensity decreases with the fourth power of the excitation wavelength. Ruthenium diimine complexes are particularly suitable for oxygen measurements because of their long excited state lifetime in the microseconds time scale. Molecular oxygen effectively quenches the fluorescence intensity and decreases the excited state lifetime of these complexes. In the last decade, tris (1,10 phenanthroline) ruthenium (II) chloride [Ru(phen)3] and tris (4,7 diphenyl, 1,10 phenanthroline) ruthenium (II) chloride [Ru(dpp)3] have been applied successfully in fiber optic sensors for oxygen and glucose20 21 22 23 in the gas phase (oxygen) and in solution (dissolved oxygen and glucose). Recently, we utilized tris(1,10-phenanthroline) ruthenium chloride [Ru(phen)3], a commonly used oxygen indicator for gas and aqueous samples, to monitor the effect of external hypoxia on J774 murine macrophages.23 24 The measurements were limited in sensitivity due to the chemical instability of Ru(phen)3. A constant negative signal drift was observed and explained by the degradation of Ru(phen)3 by cellular enzymes. A more chemically stable visible indicator for intracellular oxygen measurement is desired. In 1997, Schmehl et al.; reported the synthesis of a new ruthenium metal complex, ruthenium dibipyridine 4-(1″-pyrenyl)-2,2′-bipyridine chloride {[(bpy)2 Ru(bpy-pyr)]Cl 2}. 25 The complex is a ruthenium(II) diimine (donor)-pyrene (acceptor) complex linked by a single C–C bond. It was synthesized to understand the photophysical behavior of [(bpy)2 Ru(L)]2+ complexes. The complex displays strong emission via metal to ligand charge transfer with an excited state lifetime of 1.3 μs. It exhibits high molar absorption coefficient of 2×10⁴ M −1 cm −1 at 456 nm and an emission quantum yield of 0.5 at 632 nm. In this paper, we study the oxygen sensing properties of {[(bpy)2 Ru(bpy-pyr)]}Cl 2 in aqueous solutions and living cells. The application of this new indicator for intracellular oxygen measurements in J774 murine macrophages under the condition of hypoxia and hyperoxia is discussed. 2.Experiment2.1.Digital Fluorescence Imaging MicroscopyThe experimental setup used for fluorescence measurements of macrophages loaded with the indicator is shown in Figure 1. The system consisted of an inverted fluorescence microscope (Olympus LX-70) equipped with three detection ports. A 100 W mercury lamp was used for excitation. The fluorescence was collected by a 20×microscope objective with a numerical aperture (NA) of 0.50. A filter cube containing 480 nm narrow band excitation filter, 500 nm dichroic mirror, and 515 nm long pass emission filter was used to ensure spectral purity. A high performance charge-coupled device (CCD) camera (Rupert Scientific, model 256HB) with a 512×512 pixel array was used for digital fluorescence imaging of the samples. The Rupert Scientific software Winview 3.2 was used for image analysis. Figure 1Digital fluorescence imaging microscopy system. The experimental setup consists of an inverted fluorescence microscope equipped with a 20×objective (NA=0.5), a high performance charge-coupled device camera (Roper Scientific, 16-bit resolution, 512×512 chip size) and a microcomputer for image analysis.  2.2.Spectrofluorometry ExperimentsExcitation and emission spectra, as well as the spectral response of [(bpy)2 Ru(bpy-pyr)]Cl 2 in solution to different oxygen levels were conducted using a PTI model QM-1 spectrofluorometer (PTI, London, Ontario, Canada), equipped with a 75 W continuous Xe arc lamp as a light source. 2.3.Photostability Study of Ruthenium Diimine ComplexesSolutions of 20 μm of ruthenium diimine complexes in phosphate buffered saline (PBS) solution at pH 7.4 were continuously exposed to a 765 W xenon lamp in a Sunbox (Suntest CPS +, Atlas electric devices Co.) for 30 min. The fluorescence intensities of the indicators were acquired every 5 min using a spectrofluorometer. 2.4.Cell CultureCultures of J774 murine macrophages were maintained according to a protocol described by Gordon et al.;25 The cells were cultured in a Dulbecco’s modified Eagle’s medium supplemented with 4 mM L-Glutamine, 1.5 g/L sodium bicarbonate, 4.5 g/L glucose, 1.0 mM sodium pyruvate, and 10 fetal bovine serum. The cells were grown at 37 °C under 5 CO 2. The medium was replaced three times a week. To prepare subcultures, the cells were scraped in new medium and split into new plates. 2.5.Cell Culture on the Surface of a Chambered CoverglassThe macrophages were detached from the surface of a tissue culture plate by scraping. The cells were mixed with the growth medium by a glass pipette. The cell suspension (50 μL, ∼1×10⁶ cells/mL ) was then placed into a chambered coverglass. 950 μL fresh medium was added to the chamber. The cells were incubated to attach and grow on to the coverglass at 37 °C under 5 CO 2. Typically, an 80 confluence was achieved in 3 days. 2.6.Loading the Oxygen Indicator into MacrophagesA solution of 150 μL of 120 μM [(bpy)2 Ru(bpy-pyr)]Cl 2 in a phosphate buffered saline solution at pH 7.4 was added into the cell culture on a chambered coverglass. The medium and the dye solutions were mixed using a glass pipette. The cells were incubated at room temperature for 1 h to allow the permeation of the dye to take place. The excess dye was washed off with a PBS solution at pH 7.4. 2.7.Materials[(bpy)2 Ru(bpy-pyr)]Cl 2 was a gift from Dr. Russell H. Schmehll of Tulane University. Tris (1,10-phenanthroline) ruthenium chloride [Ru(phen)3], was purchased from Aldrich Chemical Company. Glucose, glucose oxidase from Aspergillus niger with enzymatic activity of 10 000 units/mL, Dulbecco’s modified Eagle’s medium and bovine serum albumin were purchased from Sigma. J774 murine macrophages were purchased from American Type Culture Collection. Lab-Tek II chambered coverglass was purchased from Fisher Scientific. Aqueous solutions were prepared with 18 MΩ deionized water from a purification system (Barnstead Thermolyne Nanopure). PBS solution at pH 7.4 was prepared from PBS tablets (Amresco). All reagents were used as received without further purification. 3.Results and Discussion3.1.Spectral Properties of Ru(bpy-pyr)(bpy) 2The chemical structure of Ru(bpy-pyr)(bpy)2 is shown in Figure 2(a). The excitation and emission spectra of a solution of 80 μM [(bpy)2 Ru(bpy-pyr)]Cl 2 in a PBS buffer at pH 7.4 are shown in Figure 2(b). A concentration dependence of the fluorescence intensity of Ru(bpy-pyr)(bpy)2 at 632 nm (λ=460 nm) in aqueous solution is shown in Figure 3. The fluorescence intensity of the dye increases with increasing dye concentration. This is explained by self-fluorescence quenching of the dye that occurs at concentrations greater than 80 μM. 3.2.Oxygen Sensing Properties of Ru(bpy-pyr)(bpy) 2 in Aqueous SolutionsFigure 4 shows the fluorescence spectra of Ru(bpy-pyr)-(bpy)2 in nitrogen-, air-, and oxygen-saturated solutions. Due to dynamic quenching by molecular oxygen, the fluorescence intensity of Ru(bpy-pyr)(bpy)2 in a nitrogen saturated solution, I(N 2), is higher than the fluorescence intensity in an air saturated one, I(air), which is also higher than the fluorescence intensity in an oxygen saturated solution, I(O 2). The response factor between nitrogen and oxygen, I(N 2)/I(O 2), is 13. The response is reversible. The dependence of the fluorescence intensity of Ru(bpy-pyr)(bpy)2 on the concentration of dissolved molecular oxygen is described by the Stern–Volmer equation where I0 is the fluorescence intensity of Ru(bpy-pyr)(bpy)2 in a nitrogenated solution, IC is the fluorescence intensity of Ru(bpy-pyr)(bpy)2 in a given dissolved oxygen concentration, and K SV is the Stern–Volmer quenching constant. Oxygen quenches the fluorescence intensity of Ru(bpy-pyr)-(bpy)2. In principle, higher quenching constants result in higher accuracy at low levels of oxygen. This is due to the larger signal change per oxygen concentration interval. However, high quenching constants result in a more limited linear dynamic range. We found that K SV for Ru(bpy-pyr)(bpy)2 is 13 333±3 M −1. The linear dynamic range is between 0.1 and 12 ppm molecular oxygen with a correlation coefficient of 0.996. It is commonly assumed that oxygen diffuse freely through cell membranes and therefore the intracellular oxygen tension would be very close in value to the extracellular oxygen tension. Under aerated conditions the level of intracellular oxygen tension is around 8 ppm well within the range of our oxygen indicator. The standard deviation between ten consecutive fluorescence measurements in air-saturated solutions is ∼3. The standard deviation increases up to 10 at high oxygen levels where the signal is lower.3.3.Photostability of Ru(bpy-pyr)(bpy) 2 in Aqueous SolutionThe photostability of the new indicator is determined by comparing its photobleaching rate with that of the highly photostable complex tris (1,10 phenanthroline) ruthenium chloride, Ru(phen)3. The two dyes are exposed to a 765 W xenon lamp light continuously for 1 h. Both dyes have a 50 drop of their fluorescence intensity in 30 min continuous exposure to light (data not shown). The photobleaching rates are comparable. 3.4.Stability of Loaded Cells with Respect to Dye Leakage and PhotostabilityRu(bpy-pyr)(bpy)2 permeates passively into the cells when the cells are incubated with a 50 μM dye solution for 1 h at room temperature. Transmission and fluorescence images of cells loaded with the dye are shown in Figure 5. The signal to background ratio in the fluorescence image is 37. The cellular structure remains intact for at least 5 h after the permeation of the dye. Monitoring the fluorescence intensity of the cells for 1 h shows an unnoticeable leakage of the indicator. Figure 5(a) A transmission image and (b) a digital fluorescence image of Ru(bpy-pyr)(bpy)2 labeled J774 macrophages in air-saturated PBS buffer at pH 7.4. The images are taken through a CCD with a 20×objective (NA=0.5). Exposure time is 0.5 s. 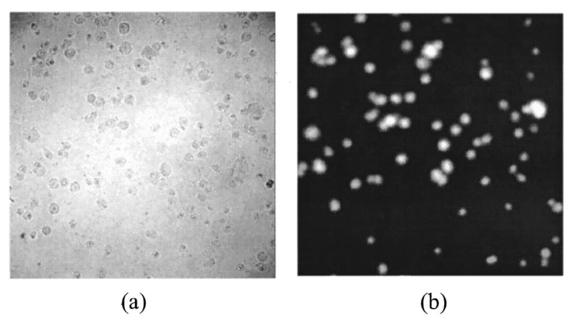 Excitation light at 480 nm is used to excite the dye loaded cells to minimize the photobleaching rate of Ru(bpy-pyr)-(bpy)2 and the effect of cellular autofluorescence on the signal to noise ratio. Additionally, a neutral density filter of 1.0 is applied to ensure the photostability of the indicator. To monitor the photobleaching rate of dye loaded cells under these conditions; a chambered coverglass of the loaded cells is placed on the microscope stage and illuminated continuously. The fluorescence intensity of the cells decreases by 5 in 30 min of illumination. During our kinetic measurements, the cells are exposed to the excitation light for 3 s in each measurement. Each experiment lasts less than 30 min and images are taken in 2–4 min intervals. It is fair to conclude that under our experimental conditions, the loaded cells remain photostable throughout the experiment. 3.5.Oxygen Sensing in Living MacrophagesThe intracellular oxygen sensing properties of Ru(bpy-pyr)-(bpy)2 were assessed by exposing the dye-loaded cells to oxygen, air and nitrogen saturated PBS at 7.4. The fluorescence intensity of the cells was acquired and plotted in Figure 6. The fluorescence intensity of the cells increases fourfold when the oxygenated solution is replaced with a nitrogenated one. Replacing the oxygenated or nitrogenated solutions with an air-saturated solution restores the signal to it original level. The response is reversible. It should be noted that such harsh treatments lead to cell death as verified by Trypan Blue staining. Under these stressful conditions, high level of reactive oxygen species may be present in cells. In spite of these conditions Ru(bpy-pyr)(bpy)2 maintains its oxygen sensitivity. It should also be noted that other commonly used ruthenium diimine complexes like tris 1,10 phenanthroline ruthenium chloride [Ru(phen)3] partially lose their oxygen sensing properties in the cellular environment under these conditions. It is possible that the addition of a large organic ligand prevents the degradation of the complex due to steric hindrances and/or stabilizing interactions with hydrophobic cellular components. The significance of these interactions is not clear at this time and further studies are needed to fully understand the structure/stability relationships of ruthenium diimine complexes in the cellular environment. 3.6.Response of Single Macrophages to Hypoxia induced by Glucose OxidaseTo test the sensitivity of Ru(bpy-pyr)(bpy)2 under less destructive conditions, we applied the indicator to monitor the kinetic response of individual macrophages to hypoxia induced by enzymatic oxidation of glucose. Glucose oxidase catalyzes the oxidation of glucose as follows: The enzymatic oxidation consumes molecular oxygen. The rate of oxidation and the steady state level of oxygen in the medium depend on the glucose concentration and glucose oxidase activity. Figure 7 describes the response of cells to hypoxia caused by different concentrations of glucose/glucose oxidase. Curve (c) describes the control experiment where Ru(bpy-pyr)(bpy)2 loaded cells are incubated in a PBS buffer at pH 7.4 in a glucose and glucose oxidase free solution. The curve shows that during a 10 min experiment, the fluorescence intensity of cells keeps constant. Curves (a) and (b) describe the fluorescence intensities of the cells when they are incubated with a medium containing 10 mM glucose and 1.5 mM glucose, respectively, with 5 units mL glucose oxidase. A 50 (a) and 40 (b) fluorescence increase is obtained in 2 and 4 min, indicating a decrease in intracellular oxygen levels to 4 and 3.2 ppm, respectively. The errors between data points obtained from two different batches of cells are ∼3 in the control experiment. The variation between the fluorescence intensities of loaded cells increases to about 6 with decreasing intracellular oxygen levels. This may be attributed to an increase in the percentage of dead cells. Once the glucose/glucose oxidase solution is replaced with a PBS solution at pH 7.4, the fluorescence intensity of the cells returns to its original value in 2 min, indicating that a normal intracellular oxygen level has been restored. Trypan Blue staining indicates that 85 of the cells survive this treatment.Figure 7The response of Ru(bpy-pyr)(bpy)2 loaded macrophages to hypoxia induced by glucose oxidase in a glucose solution. Curves (a) and (b) describe the fluorescence intensity of Ru(bpy-pry)(bpy)2 loaded cells when suspended in a solution containing (a) 10 mM glucose and 5 units/mL glucose oxidase; and (b) 1.5 mM glucose and 5 unit/mL glucose oxidase. Curves (c) is a control experiment where the loaded cells are suspended in a glucose and glucose oxidase free solution. 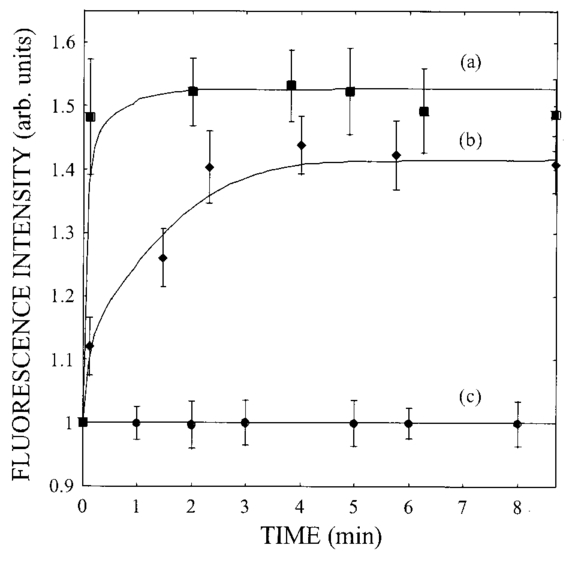 4.Summary and ConclusionsRu(bpy-pyr)(bpy)2 is utilized as an oxygen indicator for intracellular oxygen measurements. Aside from its strong visible absorption, efficient fluorescence, and relatively long-lived excited state, the new indicator exhibits high oxygen sensitivity, large Stoke shift, and high photo-/chemical stability in the cellular environment. Due to the long emission wavelength of the indicator the fluorescence signal is shifted away from cellular autofluorescence, which causes serious perturbation when UV sensing indicators are used. Ru(bpy-pyr)(bpy)2 maintains its oxygen sensing properties in living cells for at least 5 h after loading. Using high-resolution digital fluorescence imaging microscopy we were able to quantitatively monitor the kinetic response of macrophages loaded with Ru(bpy-pyr)(bpy)2 to hypoxia. We have clearly shown that a low oxygen level is produced in living cells when they are exposed to hypoxia. It is still possible that undesired interactions between the indicator and the complex cytoplasm contribute to the observed fluorescence readings. It is also possible that heterogeneity in dye distribution affects the fluorescence intensity of the cells and contributes to the cell-to-cell variations observed in our cellular measurements. Nevertheless, the ability to measure the average response of a large number of cells to conditions of hypoxia may prove to be valuable in studies designed to understand the effect of prolonged hypoxia on cells and tissues. Minimization of the interaction between the sensing indicator and cytoplasmic constituents is imperative to further improve the accuracy of intracellular oxygen measurements. Currently, we are developing a new intracellular oxygen sensor where Ru(bpy-pyr)(bpy)2 is immobilized to the surface of phospholipid coated polystyrene particles. The phospholipid membrane is permeable to molecular oxygen but protects the fluorescence indicator from the cellular environment. These sensors will be applied in a variety of intracellular studies including intracellular oxygen measurements in macrophages. AcknowledgmentsThis work is supported by the National Science Foundation through CAREER Grant No. CHE-9874498. The authors thank Tom Weise from Xavier University of Louisiana School of Pharmacy for the use of his cell culture laboratory. The authors thank Dr. Russell H. Schmehll from Tulane University Department of Chemistry for the gift of the oxygen indicator Ru(bpy-pyr)(bpy)2. REFERENCES
Y. Y. Lau
,
T. Abe
, and
A. G. Ewing
, Anal. Chem. , 64
(15), 1702
–1705
(1992). Google Scholar
K. Chen
,
C. E. Ng
,
J. L. Zweier
,
P. Kuppusamy
,
J. D. Glickson
, and
H. M. Swartz
, Magn. Reson. Med. , 31
(6), 668
–672
(1994). Google Scholar
M. Robiolio
,
W. L. Rumsey
, and
D. F. Wilson
, Am. J. Physiol. , 256 C1207
–C1213
(1989). Google Scholar
J. F. Glockner
,
H. M. Swartz
, and
M. A. Pals
, J. Cell Physiol. , 140
(3), 505
–511
(1989). Google Scholar
E. Titovets
, Anal. Biochem. , 166
(1), 79
–82
(1987). Google Scholar
W. M. Vaughan
and
G. Weber
, Biochemistry , 9 464
–473
(1970). Google Scholar
J. A. Knopp
and
I. S. Longmuir
, Biochim. Biophys. Acta , 279 393
–397
(1972). Google Scholar
D. M. Benson
,
J. A. Knopp
, and
I. S. Longmuir
, Biochim. Biophys. Acta , 591
(1), 187
–197
(1980). Google Scholar
N. Opitz
and
D. W. Lubbers
, Adv. Exp. Med. Biol. , 180 261
–267
(1984). Google Scholar
W. Rumsey
,
J. M. Vanderkooi
, and
D. F. Wilsonm
, Science , 241 1649
–1651
(1988). Google Scholar
J. M. Vanderkooi
,
G. Maniara
,
T. J. Green
, and
D. F. Wilson
, J. Biol. Chem. , 262
(12), 5476
–5482
(1987). Google Scholar
M. Pawlowski
and
D. F. Wilson
, Adv. Exp. Med. Biol. , 316 179
–185
(1992). Google Scholar
D. F. Wilson
,
W. L. Rumsey
,
T. J. Green
, and
J. M. Vanderkooi
, J. Biol. Chem. , 263
(6), 2712
–2718
(1988). Google Scholar
W. L. Rumsey
,
C. Schlosser
,
E. M. Nuutinen
,
M. Robiolio
, and
D. F. Wilson
, J. Biol. Chem. , 265
(26), 15392
–15402
(1990). Google Scholar
E. R. Carraway
,
J. N. Demas
,
B. A. DeGraff
, and
J. R. Bacon
, Anal. Chem. , 63 337
–342
(1991). Google Scholar
L. Sacksteder
,
J. N. Demas
, and
B. A. DeGraff
, Anal. Chem. , 65 3480
–3483
(1993). Google Scholar
J. N. Demas
and
B. A. DeGraff
, Anal. Chem. , 63 829A
–837A
(1991). Google Scholar
W. Xu
,
R. C. McDonough III
,
B. Langsdorf
,
J. N. Demas
, and
B. A. DeGraff
, Anal. Chem. , 66 4133
–4141
(1993). Google Scholar
Z. Rosenzweig
and
R. Kopelman
, Anal. Chem. , 67 2650
–2654
(1995). Google Scholar
Y. Zhao
,
A. Richman
,
C. Storey
,
N. B. Radford
, and
P. Pantano
, Anal. Chem. , 71
(17), 3887
–3893
(1999). Google Scholar
N. Velasco-Garcia
,
M. J. Valencia-Gonzalez
, and
M. E. Diaz-Garcia
, Analyst (Cambridge, U.K.) , 122
(11), 1405
–1409
(1997). Google Scholar
J. K. Asiedu
,
J. Ji
,
M. Nguyen
,
N. Rosenzweig
, and
Z. Rosenzweig
, J. Biomed. Opt. , 6
(2), 116
–121
(2001). Google Scholar
J. A. Simon
,
S. L. Curry
,
R. H. Schmehl
,
T. R. Schatz
,
P. Piotrowiak
,
X. Jin
, and
R. P. Thummel
, J. Am. Chem. Soc. , 119 11012
–11022
(1997). Google Scholar
S. Gordon
, BioEssays , 17
(11), 977
–986
(1995). Google Scholar
|


CITATIONS
Cited by 46 scholarly publications.


