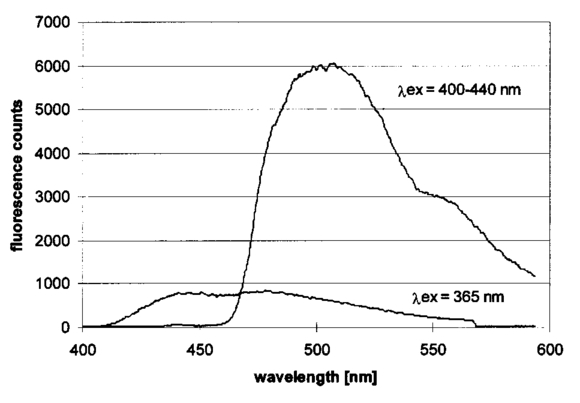
1.IntroductionCollimated laser beams have proven to be useful tools for micromanipulation of transparent particles, e.g., single cells.1 2 3 Due to the deflection of incident photons, these particles are kept within the focus of a laser beam and can be moved by scanning either the beam or the sample. In addition to their light trapping capabilities (optical tweezers), collimated laser beams have been used as optical scalpels for cutting, e.g., chromosomes or actomyosin fibrils within living cells.3 4 An important step towards in vitro fertilization was achieved by drilling small holes into the zona pellucida of oozytes and by insertion of sperms using optical tweezers.5 So far, continuous wave (cw) lasers in the red or near infrared part of the spectrum have been used as optical tweezers, since cell damage due to one-photon or two-photon absorption was relatively low at those wavelengths.6 7 8 In contrast, pulsed ultraviolet lasers with wavelengths between 337 and 355 nm (Refs. 3 and 5) or pulsed visible lasers at 532 nm (Ref. 7) have been used for cutting, ablation, or drilling. Recently, near infrared femtosecond lasers that caused multiphoton absorption proved to be a promising alternative for “nanosurgery” inside cells without perturbing the plasma membrane.9 Laser-assisted optoporation was previously shown to be a valuable tool for loading cells with larger molecules or small beads. After irradiation by short laser pulses plasma membranes were made permeable due to laser-induced shock waves.10 As an alternative local heating of the plasma membrane using continuous laser irradiation together with an absorbing dye was applied to increase membrane permeability.11 Local heating was reversible and seemed to be relatively harmless to the irradiated cells. The present experiments were stimulated by this kind of dye-assisted laser optoporation,11 however, in comparison with data in the literature the laser power and the illuminated spot size were reduced considerably. In addition, the efficiency of cell transfection was measured for the first time on the basis of single cells using a green fluorescent protein (GFP)12 coding plasmid as a reporter gene. Cell transfection was finally compared with the established method of lipofection.13 Individual steps in the present work include (a) qualitative experiments on morphological changes and the efflux of a fluorescent dye (calcein) after laser-assisted optoporation, (b) quantitative measurements of cell viability after application of various doses of light, (c) qualitative and quantitative measurements of cell transfection after addition of the GFP coding plasmid to the incubation medium prior to laser-assisted optoporation, and (d) studies of membrane dynamics upon laser exposure using an appropriate fluorescent dye (laurdan). 2.Materials and Methods2.1.Cell CultureCHO-K1 Chinese hamster ovary cells (ATTC No. CCL 61) were used. The cells were routinely cultured in a F-10 HAM nutrient mixture supplemented with 10 fetal calf serum (FCS), 7.5 sodium bicarbonate and antibiotics at 37 °C and 5 CO 2. For qualitative measurements of laser-assisted optoporation about 300 cells/mm2 were seeded on microscope object slides and examined 24 h later in an open chamber at 35 °C using a 63×/0.90 water immersion objective lens. Part of the cells were incubated for 40 min in the culture medium described above with calcein acetoxymethylester at a concentration of 5 μM followed by reincubation for 10 min with a calcein-free medium. Due to enzymatic cleavage of the ester group, pronounced green fluorescence of calcein was measured all over the cytoplasm. Its efflux after laser irradiation was used as a qualitative measure of optoporation. For quantitative measurements of cell viability and transfection, up to 60 single cells were seeded within individual chambers of a chamber slide (Nunc, Wiesbaden, Germany; Marienfeld, Lauda–Ko¨nigshofen, Germany) and kept under sterile conditions. Cells within half of the chambers were irradiated by an argon ion laser (see below) 18 h after seeding, whereas cells within the second half served as controls. A 40×/0.60 long distance objective lens was used for irradiation and microscopic measurements. Prior to all experiments the culture medium was replaced by a medium containing the same supplements, except for 5 FCS and an increased amount (40 μM) of phenol red which was used as a noncytotoxic light absorbing dye with a molar extinction coefficient of ε=7572 L/(mol×cm) at 488 nm. The temperature in the chamber slides was 35 °C and it decreased to about 32 °C during a 3 min period of irradiation. Due to the lack of temperature stabilization of the chamber slides, cells were warmed to 35 °C after each period. 2.2.GFP Coding PlasmidThe plasmid pGREEN LANTERN™-1 (Gibco, Heidelberg, Germany) was used as a positive control for monitoring expression in eukaryotic cells. The plasmid contains the reporter gene for GFP from Aequorea Victoria jellyfish. To proliferate the GFP plasmid, 50 μL of the competent Escherichia coli strain DH5a was thawed. Then 10 ng of plasmid DNA in 5 μL of 10 mM tris buffer ( pH 7.5) was added and mixed. The mixture was incubated on ice for 30 min, subjected to heat shock at 42 °C for 20 s, and then put on ice again for 2 min. A 950 μL Luria–Bertani (LB) medium without antibiotics was added, and the reaction was shaken for 1 h at 37 °C. Thereafter, 100 μL of the bacterial suspension was plated onto a LB agar plate containing ampicillin at a concentration of 100 μg/mL agar. The agar plate was incubated overnight. The next day a single clone was picked up from the plate and transferred with a sterile toothpick into 500 mL of LB medium and incubated for 36 h. Then the E. coli suspension was spun down, and the E. coli pellet was treated by alkaline lysis, purified through DNA binding columns, and subjected to isopropanol precipitation using the QIAGEN Plasmid Maxi Kit™ (Qiagen, Hilden, Germany). The plasmid DNA was dried in a vacuum concentrator and finally resolubilized in an appropriate volume of distilled water. The amount of DNA was measured by a spectrophotometer (DU640, Beckton Instruments, Fullerton, CA) at 260 and 280 nm. 2.3.ApparatusFor all experiments on laser-assisted optoporation a 2 W argon ion laser (488 nm, Innova 90, Coherent, Santa Clara, CA) was integrated into a fluorescence microscope (Axioskop, Carl Zeiss, Jena, Germany) using a monomode fiber with an integrated collimator (Point Source, Winchester, UK), shown in Figure 1. The collimator provided an almost parallel beam of 0.7 mm diameter, which was expanded by telescopic optics (consisting of three lenses with focal lengths of −16, 100, and 150 mm) such that the microscope’s aperture of 5 mm was fully illuminated, and a diffraction limited spot of diameter d=1.22λ/A was obtained in the plane of the sample (λ being the laser wavelength and A the numerical aperture of the microscope’s objective lens). Experimentally, by using a microscope line standard, beam diameters of d≈1.0 or ≈0.7 μm were verified for objective lenses of 40×/0.60 or 63×/0.90, respectively. Laser powers on the samples were 3.4 mW (63× lens) or 7.2 mW (40× lens) so that power densities of 1.0 MW/cm2 were achieved in both cases. When using irradiation times of 1 or 2.5 s, the total irradiance was 1 or 2.5 MJ/cm2, respectively. In addition, by doubling the laser power, an irradiance of 5 MJ/cm2 was achieved after irradiation of 2.5 s. The incident laser beam was deflected onto the sample by a dichroic mirror for 510 nm. The transparency of this mirror at λ⩾510 nm allowed simultaneous observation of the samples by phase contrast or interference contrast microscopy. After insertion of an additional long pass filter (λ⩾520 nm) the highly attenuated laser beam could be observed together with the samples. Figure 1Microscopic setup for light trapping, laser-assisted optoporation, and fluorescence excitation. Light trapping by the Nd:YAG laser was not used for these experiments. The objective lens and the sample are not shown.  For fluorescence microscopy a high pressure mercury lamp (HBO 50), a band pass filter for 400–440 nm, a dichroic mirror for 460 nm, and a long pass filter λ⩾470 nm were used for detection of GFP, whereas a band pass filter for 450–490 nm, a dichroic mirror for 510 nm, and a long pass filter λ⩾520 nm were used for detection of the cytoplasmatic marker calcein. For additional measurements of autofluorescence a band pass filter for 365 nm, a dichroic mirror for 460 nm, and a long pass filter λ⩾470 nm were used. Fluorescence images were recorded using an air-cooled integrated charge coupled device (CCD) camera (MC-3254R/MFGS, AVT Horn, Aalen, Germany). Alternatively, a polychromator in combination with an image intensifier and a diode array (IMD 4562, Hamamatsu Photonics, Ichino-Cho, Japan)14 was used for detection of emission spectra. Power densities of the irradiation with the mercury lamp were about 20 mW/cm2 at 365 nm, 60 mW/cm2 at 400–440 nm, and 45 mW/cm2 at 450–490 nm, respectively. In all cases photobleaching during exposure times of 10–20 s was negligible. 2.4.Cell ViabilityThe colony forming capability of individual cells seeded within chamber slides was examined after laser irradiation. Eighteen hours after seeding, up to 32 individual cells of each chamber were exposed to single laser shots with light doses of 1, 2.5, or 5 MJ/cm2 at a wavelength of 488 nm. In each case, cells in 16 chambers were irradiated, whereas cells in 3×16=48 chambers were used as controls. Colony formation and colony size were determined for all irradiated cells and controls 48 h later, i.e., 66 h after seeding. Colonies were related to originally seeded cells by using a bidirectional scanning table with a step motor (EK32, Merzha¨user, Wetzlar, Germany) together with a computer program made specifically to regain cell coordinates. The percentage of colony formation (with colonies consisting of at least two cells) and the average number of cells per colony were determined for each chamber. Median values and median absolute deviations (MADs) were calculated in each case for 16 chambers of irradiated cells as well as for 48 chambers of control cells. 2.5.Cell TransfectionGFP coding plasmid DNA was added to the incubation medium (containing 40 μM phenol red) at a concentration of 8.3 μg/mL. Eighteen hours after seeding of individual cells (up to 60 per chamber) the original incubation medium was replaced by the medium containing the plasmid. Thereafter, cells within 13 chambers of a chamber slide were irradiated, whereas cells within another 10 chambers served as controls. Cell transfection was defined through pronounced green fluorescence after 24 h (corresponding to 42 h after seeding), which was at least five times higher than intrinsic fluorescence of the cells, and which was distributed over the cytoplasm. After 42 h either single cells or colonies consisting of up to four cells were observed and related to the original seeded cells. Cell recovery was examined as well as cell transfection defined by green fluorescence for either a single cell or at least one cell of a colony. The percentage of recovered and transfected cells was determined for each chamber; median values and median absolute deviations were calculated for all chambers of irradiated cells and controls. 2.6.Membrane Dynamics Probed by Laurdan FluorescenceIn an additional experiment changes in membrane dynamics were evaluated after laser exposure. CHO cells were incubated for 60 min with the fluorescent membrane marker 6-dodecanoyl-2-dimethylamino-naphthalene (laurdan, 8 μM in the culture medium), whose emission maximum was reported to be shifted from about 440 to 480–490 nm when the membrane dynamics (in particular the membrane fluidity) increased.15 In the literature15 16 this has been related to the interaction of laurdan and water dipoles when cellular lipids passed from a so-called gel phase to a liquid cristalline phase. Following incubation with laurdan, the CHO cells were reincubated with a culture medium containing 40 μM phenol red prior to laser irradiation (488 nm, 1 MJ/cm2) at an environmental temperature of 35 °C. The fluorescence of intracellular laurdan was excited by a 391 nm laser diode (PDL 800B, Picoquant GmbH, Berlin, Germany) at an average power of 280 μW focused onto an area of about 2 mm2. Emission spectra of single cells were recorded before and immediately after laser irradiation using the polychromator and image intensifying system described above. 3.ResultsIndividual cells were exposed to the incident laser beam, such that the beam was focused on their upper membrane [Figure 2(a)]. After 1 or 2.5 s of irradiation, the cells were examined visually using interference contrast microscopy. Small circular black spots of approximately the same size as the focused laser beam appeared [Figure 2(b)] and were often surrounded by concentric interference rings. These structures disappeared within about 5 min when the cell morphology was the same as that before irradiation. Only if cells were irradiated for periods longer than 5 s were permanent changes of morphology observed. When the cells were loaded with the cytoplasmic marker calcein, their fluorescence intensity was reduced by a factor of 5–10 after laser irradiation. This fading was observed over the whole cell, but appeared most pronounced at the site of irradiation. A decrease of fluorescence after irradiation was also observed when a cultivation medium without or with a lower amount (3.4 μM) of phenol red was used. This decrease was by a factor of around 3 and therefore less than that after using 40 μM phenol red. This indicates that photobleaching of calcein fluorescence by scattered laser light occurred in all cases, but that some additional decrease of fluorescence might result from an efflux of calcein out of the cells after laser-assisted optoporation when using the absorber dye at the highest concentration (40 μM). Figure 2CHO cells (a) during laser irradiation (phase contrast) and (b) after laser irradiation (interference contrast) (488 nm, 1 MW/cm2, 2.5 s). The arrow marks the irradiated spot. Image size: 100×100 μm 2.  Results of colony formation of CHO cells after application of various light doses are shown in Figure 3; 82±8 of initially seeded control cells were able to form colonies (plating efficiency). This percentage changed only slightly after application of light doses up to 2.5 MJ/cm2; corresponding values are 69±19 for 1 MJ/cm2 and 79±13 for 2.5 MJ/cm2. A more pronounced reduction of the cell viability, however, was obtained after application of a light dose of 5 MJ/cm2, when only 52±15 of initially seeded cells were able to form colonies. The average size of colonies of nonirradiated controls 66 h after seeding was eight cells. This number was reduced by about 25 after application of 1 or 2.5 MJ/cm2 and by about 50 after application of 5 MJ/cm2. According to these results a light dose of 1 MJ/cm2 appeared appropriate for the following experiments on cell transfection. Figure 3Colony formation of CHO cells as a measure of the cell viability after application of various light doses (488 nm) as well as for nonirradiated controls after the addition of 40 μM phenol red to the culture medium. Median values and MADs of 16 chambers (irradiated cells) and 48 chambers (controls).  Twenty-four hours after incubation of the CHO cells with the medium containing the plasmid DNA and laser exposure (488 nm, 1 MJ/cm2), two populations of cells could be distinguished. Most of the cells showed weak blue fluorescence with maxima around 440 and 470 nm when excited by near ultraviolet light (365 nm) and weak green fluorescence with a maximum around 520 nm when excited by blue light (400–440 nm). According to the literature,17 18 19 these emission bands are attributable to intrinsic fluorophores, in particular protein-bound and free nicotinamid adenine dinucleotide (NADH) at 440 and 470 nm, respectively, as well as flavin mononucleotide (FMN) or flavin dinucleotide (FAD) around 520 nm. In addition, part of the cells showed intrinsic blue fluorescence after near UV excitation, but pronounced green fluorescence after excitation at 400–440 nm [Figure 4(a)], which was 5–20 times more intensive than the autofluorescence [Figure 4(b)]. According to its maximum around 510 nm and its shoulder at 540–550 nm this fluorescence band was attributed to the GFP.20 Green fluorescent cells were related to the original seeded cells described above. In Figure 5 the percentages of plated cells that were recovered and/or transfected 42 h after seeding (i.e., 24 h after incubation with the plasmid) are shown for the case of laser exposure (488 nm, 1 MJ/cm2) as well as for the nonirradiated controls. The recovery rate was 67±9 for the irradiated and 70±12 for the nonirradiated cells, whereas the overall transfection rate was 13±7 for the irradiated cells and 5±2 for the nonirradiated cells. In the course of the experiments, which were carried out with increasing ages of the subcultures (from subculture 12 up to subculture 37), the transfection rate decreased from about 30 to less than 10 after laser irradiation and from 5–10 to about 3 for the controls. Therefore, an additional evaluation that considers only subcultures 12–21 resulted in transfection rates of 29±10 (seven chambers) and 6±2.5 (six chambers) for the irradiated and the nonirradiated cells, respectively. These data are also depicted in Figure 5. Figure 4a(a) Fluorescence image of a single CHO cell 24 h after transfection with the GFP coding plasmid. Image size: 80×60 μm 2. (b) Fluorescence spectra of a single transfected CHO cell using excitation wavelengths of 365 (20 mW/cm2) or 400–440 nm (60 mW/cm2), respectively. Spectral resolution: 10 nm.  Figure 5Cell recovery and transfection rate of CHO cells after laser-assisted optoporation as well as of nonirradiated controls. The transfection rates were determined separately for subcultures 12–37 and 12–21.  Fluorescence spectra of the membrane marker laurdan within an individual CHO cell before and immediately after laser irradiation (488 nm, 1 MJ/cm2) are depicted in Figure 6. The fluorescence intensity around 440 nm (I440) decreased considerably, whereas the intensity at 480–490 nm (I490) remained almost constant after laser irradiation. Using the so-called “generalized polarization” (GP)=(I440−I490)/(I440+I490) as a measure of membrane dynamics,21 this corresponds to a decease of GP from +0.05 to −0.03. A similar decrease in GP was observed when the temperature was increased from 35 to 38–41 °C (data not shown). Figure 6Fluorescence spectrum of a single CHO cell after incubation with the membrane marker laurdan (8 μM, 60 min) before (upper curve) and after (middle curve) exposure to Ar + laser irradiation (488 nm, 1 MJ/cm2). The difference between the two spectra is depicted in the lower curve. Excitation wavelength: 391 nm. 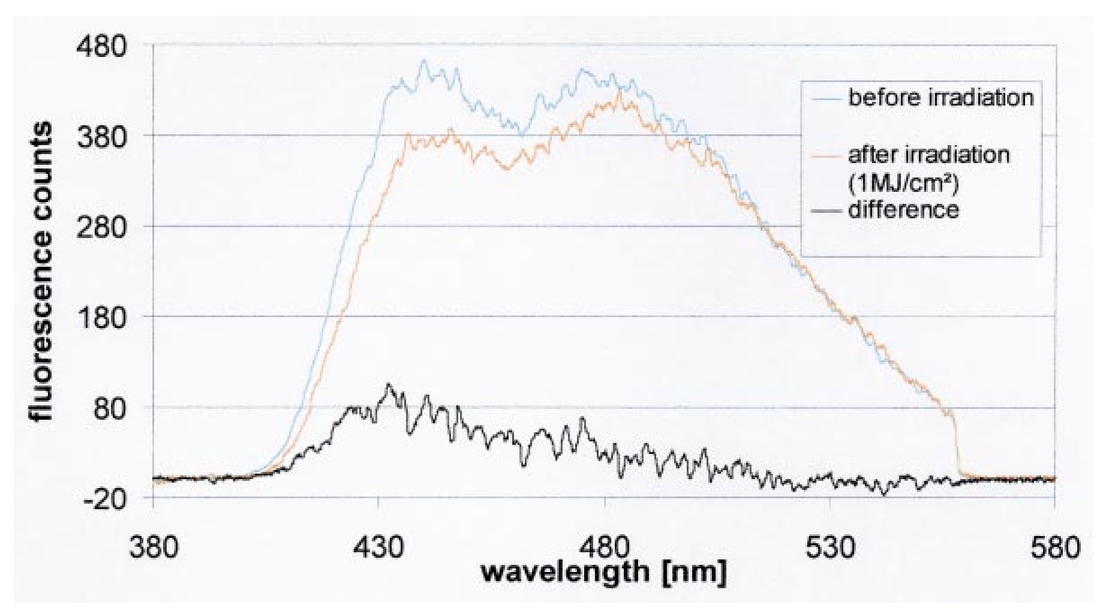 4.DiscussionObservations after laser-assisted optoporation (the formation of small circular black spots which disappear within a few minutes) were similar to findings reported in the literature with the same concentration of phenol red being used.11 There, the formation of circular spots was reported to be related to a local transient increase in temperature which might be concomitant with an increase of membrane permeability. An increase in temperature of 1.15±0.25 °C per 100 mW of laser power was previously reported for a focused near infrared Nd:YAG laser beam (λ=1064 nm). 22 In that case laser light was mainly absorbed by water with an absorption coefficient of α≈0.15 cm −1. In the present experiments absorption was mainly related to phenol red with α=ε×c×ln 10=0.70 cm −1 [with the molar extinction coefficient ε=7572 L/(mol×cm) and the concentration c=4×10⁻⁵ mol/L ]. Therefore, an increase in temperature appears possible even after application of a few milliwatts of laser power. The membrane dynamics of CHO cells were reported to change significantly in a temperature range of 15–45 °C due to a transition of the cellular lipids from gel phase to liquid crystalline phase.23 When the plasma membrane was examined selectively using total internal reflection fluorescence spectroscopy, a rather small temperature interval could be assigned to the phase transition of BKEz-7 endothelial cells from calf aorta24 (35 °C⩽T⩽41 °C). In the present experiments the CHO cells were kept at a temperature of about 35 °C which was expected to increase after laser irradiation. Following laser exposure (488 nm, 1 MJ/cm2, in presence of 40 μM phenol red) a pronounced change of the GP of laurdan occurred, which indicates an increase in membrane dynamics and permeability. This increase may account for the observed increase in transfection rates. For a comparison of transfection rates a standard method of lipofection was used, whereby a commercial DOTAP solution (Roche Diagnostics, Mannheim, Germany) was added to a buffer solution containing the plasmid DNA. For this method, the transfection rate of CHO cells was 15–20, i.e., similar to in laser-assisted optoporation. Similar transfection rates of 14–20 have been reported in the literature for Chinese hamster fibroblasts using lipofection as well as electroporation.25 However, several parameters of laser optoporation remain to be optimized, in particular the temperature of the incubation medium (which so far has varied between 35 and 32 °C) and the age of the cell cultures. For subcultures 12–21 the transfection rate after laser-assisted optoporation (29±10) was distinctly above the transfection rate of the controls (6±2.5), whereas for older cells the transfection rates of irradiated cells and controls approximated each other. Pronounced changes of membrane dynamics with cell aging were correlated with increasing amounts of cholesterol,26 consequently the phase transition from the gel phase to the liquid crystalline phase either shifted toward higher temperatures or did not even occur.24 26 Exclusion of aging cells from experiments of laser-assisted optoporation can therefore increase the transfection rate. After incubation with the plasmid DNA, cell recovery was around 70 for irradiated as well as for nonirradiated cells (Figure 5). Without DNA incubation, the cell variation of nonirradiated controls was 82±8 (Figure 3), and the recovery rate in this case was around 90. This implies that a small portion of the cells were “lost” in the transfection experiment. Possibly the plasmid DNA was slightly cytotoxic at a concentration of 8.3 μg/mL in the cultivation medium. Although this concentration was revealed as being optimal with respect to cell transfection, it should be reduced in future experiments. To summarize, laser-assisted optoporation appears to be a versatile tool for cell transfection that has various advantages over established methods, e.g., lipofection,13 electroporation,25 27 28 viral transfection,29 or ballistic methods (gene gun).30 Once the experimental setup is perfectly adjusted, the method is easy to perform and can be used under visual control. It can possibly be applied to a large variety of cells, including those cells which are difficult to transfect with conventional methods, e.g., hematopoetic cells, and particularly dendritic cells. The transfection rate may still be increased by optimization of all parameters, as mentioned above. A prerequisite for the application of the method is to use an absorbing dye which is noncytotoxic; phenol red seems to fulfill this requirement. In comparison with previous work on laser-assisted optoporation11 the illuminated area (0.7–1 μm compared with the 6–8 μm diameter) and therefore the laser power (7.2 mW compared with about 500 mW in the plane of the samples) were considerably smaller. Therefore, miniaturization of the equipment using a small air-cooled argon ion laser or a diode laser appears possible in view of the versatile and inexpensive instrumentation of laser-assisted optoporation. AcknowledgmentsThis work was supported by the Ministerium fu¨r Wissenschaft, Forschung und Kunst (MWK), Baden–Wu¨rttemberg. The authors thank Marco Lyttek, Michael Wagner, and Martina Kretzschmar for their cooperation as well as Sandra Hu¨bsch and Claudia Hintze for their skillful technical assistance. The CHO-K1 cells were supplied by T. M. A. R. Dubbelman (University of Leiden, The Netherlands). REFERENCES
A. Ashkin
,
“Optical trapping and manipulation of neutral particles using lasers,”
Proc. Natl. Acad. Sci. U.S.A. , 94 4853
–4860
(1997). Google Scholar
M. W. Berns
,
W. H. Wright
, and
R. Wiegand-Steubing
,
“Laser microbeam as a tool in cell biology,”
Int. Rev. Cytol. , 129 1
–44
(1991). Google Scholar
H. Liang
,
W. H. Wright
,
S. Cheng
,
W. He
, and
M. W. Berns
,
“Micromanipulation of chromosomes in PTK2 cells using laser microsurgery (optical scalpel) in combination with laser-induced optical force (optical tweezers),”
Exp. Cell Res. , 204 110
–120
(1993). Google Scholar
A. Clement-Sengewald
,
K. Schu¨tze
,
A. Ashkin
,
G. A. Palma
,
G. Kerlen
, and
G. Brem
,
“Fertilization of bovine oocytes induced solely with combined laser microbeam and optical tweezers,”
J. Assist Reprod. Genet. , 13 259
–265
(1996). Google Scholar
K. Ko¨nig
,
H. Liang
,
M. W. Berns
, and
B. J. Tromberg
,
“Cell damage by near-IR microbeams,”
Nature (London) , 377 20
–21
(1995). Google Scholar
H. Liang
,
K. T. Vu
,
P. Krishnan
,
T. C. Trang
,
D. Shin
,
S. Kimel
, and
M. W. Berns
,
“Wavelength dependence of cell cloning efficiency after optical trapping,”
Biophys. J. , 70 1529
–1533
(1996). Google Scholar
H. Schneckenburger
,
A. Hendinger
,
R. Sailer
,
M. H. Gschwend
,
W. S. L. Strauss
,
M. Bauer
, and
K. Schu¨tze
,
“Cell viability in optical tweezers: High power red laser diode versus Nd:YAG laser,”
J. Biomed. Opt. , 5 40
–44
(2000). Google Scholar
K. Ko¨nig
,
“Multiphoton microscopy in life sciences,”
J. Microsc. (Paris) , 200 83
–104
(2000). Google Scholar
J. S. Soughayer
,
T. Krasieva
,
S. C. Jacobson
,
J. M. Ramsey
,
B. J. Tromberg
, and
N. L. Allbritton
,
“Characterization of cellular optoporation with distance,”
Anal. Chem. , 15 1342
–1347
(2000). Google Scholar
G. Palumbo
,
M. Caruso
,
E. Crescenzi
,
M. F. Tecce
,
G. Roberti
, and
A. Colasanti
,
“Targeted gene transfer in eucaryotic cells by dye-assisted laser optoporation,”
J. Photochem. Photobiol., B , 36 41
–46
(1996). Google Scholar
C. W. Cody
,
D. C. Prasher
,
W. M. Westler
,
F. G. Prendergast
, and
W. W. Ward
,
“Chemical structure of the hexapeptide chromophore of the Aequorea green fluorescent protein,”
Biochemistry , 32 1212
–1218
(1993). Google Scholar
M. Schmitt
,
H. Ikeda
,
Y. Nagata
,
X. Gu
,
L. Wang
,
K. Kuribayashi
, and
H. Shiku
,
“Involvement of T-cell subsets and natural killer (NK) cells in the growth supression of murine fibrosarcoma cells transfected with interleukin-12 (IL-12) genes,”
Int. J. Cancer , 72 505
–511
(1997). Google Scholar
H. Schneckenburger
,
M. H. Gschwend
,
R. Sailer
,
H.-P. Mock
, and
W. S. L. Strauss
,
“Time-gated fluorescence microscopy in molecular and cellular biology,”
Cell Mol. Biol. (Paris) , 44 795
–805
(1998). Google Scholar
T. Parasassi
,
G. de Stasio
,
A. d’Ubaldo
, and
E. Gratton
,
“Phase fluctuation in phospholipid membranes revealed by laurdan fluorescence,”
Biophys. J. , 57 1179
–1186
(1990). Google Scholar
T. Parasassi
,
E. K. Krasnowska
,
L. Bagatolli
, and
E. Gratton
,
“Laurdan and prodan as polarity-sensitive fluorescent membrane probes,”
J. Fluoresc. , 4 365
–373
(1998). Google Scholar
J. E. Aubin
,
“Autofluorescence of viable cultured mammalian cells,”
J. Histochem. Cytochem. , 27 36
–43
(1979). Google Scholar
J.-M. Salmon
,
E. Kohen
,
P. Viallet
,
J. G. Hirschberg
,
A. W. Wouters
,
C. Kohen
, and
B. Thorell
,
“Microspectrofluorometric approach to the study of free/bound NAD(P)H ratio as metabolic indicator in various cell types,”
Photochem. Photobiol. , 36 585
–593
(1982). Google Scholar
R.-J. Paul
and
H. Schneckenburger
,
“Oxygen concentration and the oxidation-reduction state of yeast: Determination of free/bound NADH and flavins by time-resolved spectroscopy,”
Naturwissenschaften , 82 32
–35
(1996). Google Scholar
M. Chalfie
,
Y. Tu
,
G. Euskirchen
,
W. W. Ward
, and
D. C. Prasher
,
“Green fluorescent protein as a marker for gene expression,”
Science , 263 802
–805
(1995). Google Scholar
T. Parasassi
,
G. de Stasio
,
G. Ravagnan
,
R. M. Rusch
, and
E. Gratton
,
“Quantitation of lipid phases in phosopholipid vesicles by the generalized polarization of laurdan fluorescence,”
Biophys. J. , 60 179
–189
(1991). Google Scholar
Y. Liu
,
D. K. Cheng
,
G. J. Sonek
,
M. W. Berns
,
C. F. Chapman
, and
B. J. Tromberg
,
“Evidence for localized cell heating induced by infrared optical tweezers,”
Biophys. J. , 68 2137
–2144
(1995). Google Scholar
C. F. Chapman
,
Y. Liu
,
G. J. Sonek
, and
B. J. Tromberg
,
“The use of exogenous fluorescent probes for temperature measurements in single cells,”
Photochem. Photobiol. , 62 416
–425
(1995). Google Scholar
H. Schneckenburger
,
K. Stock
,
J. Eickholz
,
W. S. L. Strauss
,
M. Lyttek
, and
R. Sailer
,
“Time-resolved total internal reflection fluorescence spectroscopy: Application to the membrane marker laurdan,” in Laser Microscopy, K. Ko¨nig, H. J. Tanke, H. Schneckenburger, Eds.,”
Proc. SPIE , 4164 36
–42
(2000). Google Scholar
S. Vanderbyl
,
N. MacDonald
, and
G. de Jong
,
“A flow cytometry technique for measuring chromosome-mediated gene transfer,”
Cytometry , 44 100
–105
(2001). Google Scholar
T. Parasassi
,
A. M. Gonsti
,
M. Raimondi
, and
E. Gratton
,
“Abrupt modifications of phospholipid bilayer properties at critical cholesterol concentrations,”
Biophys. J. , 68 1895
–1902
(1995). Google Scholar
W. Chen
and
J. McCluskey
,
“Electroporation of antigen-presenting cells for T-cell recognition and cytotoxic T-lymphocyte priming,”
Methods Mol. Biol. , 48 73
–81
(1995). Google Scholar
S. Lohmann
,
K. Galle
,
J. Knop
, and
A. H. Enk
,
“
CD83+human
dendritic cells transfected with tumor peptide
cDNA
by electroporation induce specific T-cell responses: A potential tool for gene immunotherapy,”
Cancer Gene Ther. , 7 605
–614
(2000). Google Scholar
H. Tahara
,
H. J. Z. Zeh
,
W. J. Storkus
,
I. Pappo
,
S. C. Watkins
,
U. Gubler
,
S. F. Wolf
,
P. D. Robbins
, and
M. T. Lotze
,
“Fibroblasts genetically engineered to secrete interleukin-12 can suppress tumor growth and induce anti-tumor immunity to a murine melanoma in vivo,”
Cancer Res. , 54 182
–189
(1994). Google Scholar
L. Zitvogel
,
B. Couderc
,
J. I. Mayordomo
,
P. D. Robbins
,
M. T. Lotze
, and
W. J. Storkus
,
“IL-12 engineered dendritic cells serve as effective tumor vaccine adjuvants in vivo,”
Ann. N.Y. Acad. Sci. , 795 284
–293
(1996). Google Scholar
|


CITATIONS
Cited by 101 scholarly publications and 7 patents.
Luminescence
Laser irradiation
Green fluorescent protein
Argon ion lasers
Linear filtering
Optical tweezers
Laser cutting


