
1.IntroductionRecent progress in analytical instrumentation has enabled dramatic advances in gene sequencing and protein identification techniques. Using the information produced by these techniques, the attention of biomedical researchers is now increasingly focused on understanding how chemical species interact in living organisms by the use of imaging techniques which simultaneously provide both morphological and chemical information within cells and tissues. Today intensive research in experimental biology, spectroscopy, and analytical instrumentation is seeking new ways to image chemical information within living cells. For correct elucidation of the cellular chemistry it is imperative to maintain the viability of the cell during and after the collection of the chemical image. Most imaging research has focused on the application of fluorescent probes that locate and identify a specific chemical event within the cell by the addition of a labeling compound. A major concern is the viability of the cell and possible biochemical changes as a result of the monitoring and imaging process. To enhance viability by the reduction of bond breaking and ionization during fluorescent measurements, two-photon excitation at longer wavelengths has been used to lower the toxic effects of potentially bond-breaking UV or visible radiation on the sample.1 2 3 4 However, even this has recently been linked to apoptosis-like death.3 In contrast to fluorescent labeling techniques, synchrotron radiation-based Fourier transform infrared (SR-FTIR) spectromicroscopy has the ability to monitor the chemistry occurring within an individual living cell without the need for labels and with even lower photon energies. Infrared (IR) spectroscopy is a sensitive analytical chemistry technique for studying biological systems. Many common biomolecules, such as nucleic acids, proteins, and lipids have characteristic and well-defined IR-active vibrational modes.5 6 Combining IR spectroscopy with microscopy yields a powerful tool for nondestructively probing bio systems on a small size scale.7 With the recent addition of a synchrotron light source8 9 10 11 12 one can now obtain diffraction-limited spot sizes with high signal intensity in an IR microscope. This high brightness is of great advantage when measuring samples with a spatial resolution near the diffraction limit of 3–10 μm. The sample can be small and/or heterogeneous, for example, individual living cells, microorganisms, and larger biological systems in which local biochemistry may have significant spatial variations. Recent uses of synchrotron infrared spectromicroscopy include the examination of biological samples such as individual living cells,13 14 15 16 17 18 19 tissue samples,20 21 22 23 microbe–chemical interactions in environmental settings,24 25 protein conformations,26 27 and plant–soil interactions.28 It is crucial to know if the synchrotron radiation-based mid-infrared (SR-IR) source causes any short- or long-term effects on the living biological samples under study. Mid-infrared photons are significantly lower in energy (0.05–0.5 eV) than the excitation sources used in fluorescence probes including the newer two-photon techniques (photon energies of approximately 1 eV), implying that photoinduced effects will be minimal. However, to be assured that the SR-IR beam does not perturb living samples via other mechanisms, more detailed studies are required. SR-FTIR spectromicroscopy is an excellent tool for monitoring the biochemistry taking place within a cell. In all studies to date13 14 15 16 17 18 19 20 21 22 23 24 25 26 27 28 no changes have been observed in the IR spectra during the exposure to the synchrotron beam. This indicates no immediate changes in the overall biochemical composition of the exposed cell(s). Although mid-IR photons are too low in energy to directly break bonds or cause ionization, other effects from the SR-IR source may occur, including sample heating, drying, or other more subtle interactions which could influence long-term metabolic and other cellular physiological processes. We recently demonstrated that sample heating from the synchrotron IR beam is minimal (∼0.5 °C).29 The present paper presents the results of in vitro studies to determine if the SR-IR beam causes any detectable cytotoxic effects on living cells. Two classes of cyctotoxic effects were measured in this study: (1) immediate and/or short-term effects in cell viability, cell-cycle progression, cell metabolism, and (2) long-term effects on the proliferative/metabolic capacity of exposed cells. Four widely accepted cellular and molecular assays were selected to measure these potentially deleterious effects on cells subjected to different doses of the SR-IR beam. Finally, infrared spectra were also recorded for exposed and nonexposed cells, and were compared in detail to identify possible immediate chemical changes as a result of exposure to the SR-IR beam. 2.Materials and Methods2.1.Cells and Cell SynchronizationA human T-1 cell line from an established aneuploid cell line derived from human tissue was used in this study.30 It was selected partly because of its high plating efficiency (>90), and partly because it has been previously used as a model biological system in studies of the effects of radiation and oxygen on human cells.31 32 33 34 35 The T-1 cells were originally obtained from Dr. G. W. Barensen of the Radiobiological Institute of the Organization for Health Research, Rijswijk, The Netherlands, in 1976. They were maintained in growth medium consisting of minimum essential medium with eagle’s balanced salt solution supplemented with 15 fetal calf serum (HyClone, Logan, Utah), 1 mM L-glutamine, and pen strep antibiotics at pH 7.4. All chemicals were from Gibco/BRL unless noted. Cells were grown at 37 °C in a humidified atmosphere of 5 CO 2 and 95 air. Cells were subcultured every 3–4 days. Radiation effects on T-1 cells are cell-cycle dependent, and are most damaging for G 1 and mitotic phase cells because their repair capacity is significantly less.32 Even within the G 1 phase, the repair capacity has been reported to be negligible during the early G 1 phase, and improves as cells progress to the G 1/S boundary.32 In order to study a uniform G 1 -phase cell population, T-1 cultures were grown to confluence to ensure para synchronization. Immediately prior to each experiment cells were trypsinized from confluent cultures. Fluorescence-activated cell sorting analysis demonstrated that 85 of the cells in these cultures were synchronized to G 0/G 1 phases. Cells were plated onto 60 mm petri dishes at a density of 1×10² cells/dish for the colony forming assay (see below), and 1×10⁵ cells/dish for all other assays. Gold-coated glass microscope slide pieces (0.25 cm2) were plated with 100 μL of a 1×10⁵ cells/ml cell suspension for SR-FTIR measurements and confirmation of other assays. Cells were incubated in growth medium for 2 h (just long enough for the cells to attach) in a 37 °C and 5 CO 2 incubator before they were subjected to the tests detailed below. 2.2.Synchrotron Infrared FacilityThis work was performed at the infrared spectromicroscopy beamline 1.4.3 at the Advanced Light Source (ALS) in Berkeley, CA.10 11 12 The synchrotron light is used as an external source for a Nicolet 760 FTIR bench and Nic-Plan™ IR microscope with a computer-controlled x–y–z sample stage. The synchrotron infrared beam can be easily switched on and off via automated optics inside the microscope which can be controlled manually or by software. The ALS storage ring produces pulses of synchrotron light across a broad energy range from the far IR to the hard x-ray. The front-end optics of beamline 1.4.3 [bare aluminum coated optics and a chemical vapor deposition-grown diamond window] only pass photons with energies <3 eV. The synchrotron light is then collimated and sent into the FTIR bench where it passes through a Ge coated KBr beamsplitter. This beamsplitter only allows light between ∼400 and ∼10 000 cm−1 to continue on to the sample. Within this spectral bandwidth, we have measured an average power of ∼1 mW at the focused sample position within the IR microscope. The ALS light pulses are 40 ps in duration with a 500 MHz repetition rate. Therefore, the peak power at the sample is 50 times higher than the average power, or ∼50 mW. Conventional tungsten thermal IR sources, for example, a Globar™ source, provide, as measured in our instrument, approximately one half of the total average power over the same spectral bandwidth. The synchrotron infrared light is focused to a diffraction-limited (3–10 μm-diameter) spot, while the thermal light is focused into a spot of approximately 100 μm in diameter. This results in a brightness advantage of ∼150 for the synchrotron source compared with the thermal source ( 1.3×10⁻² mW/μm 2 for the synchrotron versus 8.6×10⁻⁵ mW/μm 2 for the thermal source). A custom on-stage mini incubator was used to maintain the proper moisture and growth environment for the cells while allowing in situ FTIR spectromicroscopy measurements. The mini incubator was temperature controlled via circulating water from a water bath, and infrared transparent CaF 2 windows on the top cover were separately temperature controlled to avoid condensation. The location of the synchrotron infrared beam within the field of the microscope was fiducialized to approximately 1 μm by mapping a titanium on silicon calibration target.36 2.3.Exposure of Individual Cells to the Synchrotron Infrared BeamImmediately prior to synchrotron infrared exposure, the growth medium was replaced with fresh medium (100 μL per 60 mm dish, or 1 μL per glass slide piece inside the humidified on-stage mini incubator as described earlier). Media plus 10 mM Hepes was added to keep the cells hydrated, and the medium at pH 7.4 throughout the exposure duration. Every exposure experiment was conducted at 37 °C and lasted for less than 1 h. To ensure all test and control cells used in this study were synchronized (they were initially para synchronized), we selected visually in the field of the infrared microscope only those single cells that had the shape and size typical of G 1 -phase T-1 human cells. The selected cells were exposed to the focused synchrotron infrared beam for a specified duration of 5, 10, or 20 min. These times were chosen to greatly exceed the normal exposure time for data acquisition on an individual cell, typically between 20 s and 2 min. After the allotted time had passed, the beam was switched off, and the next test cell was located. Once completed, fresh growth media were replaced on the dish and returned to the standard 37 °C and 5 CO 2 incubator. Both negative and positive control cells were also tested. Negative controls were nonexposed cells located in the same field of the petri dish or gold-coated slide pieces (internal controls), and therefore experienced the same handling. Positive controls were cells that were either exposed to 70 ethanol solution, or allowed to progressively dehydrate as a result of evaporation of the growth medium at the edges of the samples under study. 2.4.Alcian Blue Assay for Monitoring Short-Term Effect on Cell ViabilityThe standard alcian blue dye-exclusion assay37 was used to detect if a cell remained viable and had an intact membrane 6, 12, and 24 h after exposure to the synchrotron infrared beam. Viable cells are impermeable to the alcian blue molecules, whereas moribund cells are stained dark blue because of the breakdown in their membrane integrity. This short-term assay relies on the active transport of alcian blue molecules back out of the living cell using energy derived from metabolism at the time of the assay. Test and control cells were incubated for the specified times at 37 °C and 5 CO 2 with growth medium and then fixed with 3 glutaraldehyde in Milliong’s buffer, and 0.3 alcian blue (as stain) was added to give a final dye concentration of 0.03. Glutaraldehyde fixation was chosen because it can best preserve structural features of the cell membrane.37 Individual cells were then revisited with an optical microscope to determine the presence (or absence) of blue color—blue indicates cell death. 2.5.Colony-Forming Assay to Test Long-Term SurvivalIn addition to the above dye exclusion method of short-term toxicity, we used the standard colony-forming assay31 to look for any potential effects of SR-IR beam on the long-term survival and proliferation on T-1 cells. This assay began with plating cells at a low density of ∼100 per 60-mm-diam petri dish to ensure resulting colonies would not overlap. Test cells were again identified visually in the field of the IR microscope according to their morphological characteristics including cell shape and cell size, and exposed by the synchrotron beam for the appropriate time of irradiation. The medium was replaced and the dishes were returned to the standard 37 °C and 5 CO 2 incubator and allowed to grow for ten days. Colony formation was determined by the following procedure. The cells were fixed and stained with 30 ethanol and 0.2 methylene blue at room temperature for 1 h. The stain was then rinsed off, and the dishes were allowed to air dry. The sites of exposed and control cells were revisited under a microscope, and the number of cells that had grown for ten days after the test event was recorded. Any cell that developed into a colony of at least 50 cells was considered to have maintained reproductive integrity.31 Any colony of less than 50 cells was considered to suffer from cytotoxic effects from the SR-IR beam. Resultant cell colonies from test and control cells were photographed in an optical microscope using fiduciary guides to relocate the original cells used for the SR-IR exposure. The reproductively proficient fraction of exposed and control cells were compared and the percent surviving fraction was calculated. 2.6.BrdU Assay for the in situ Detection of Immediate Cell-Cycle Progression EffectsWe evaluated the effect of SR-IR beam exposure on the cell-cycle progression by detecting when exposed and nonexposed T-1 cells reach their S phase (DNA synthesis) after the release from confluence. The onset of DNA synthesis was detected in situ with the two-antibody bromodeoxyuridine (BrdU) assay according to the protocol (No. 1170 376) provided by Boehringer Mannheim. This standard assay relies on pulse labeling the test and control cells with a final concentration of 10 μM BrdU 1 h before the estimated onset of DNA synthesis. BrdU, a thymidine analog, is known to be specifically incorporated into DNA during DNA synthesis. A conventional two-antibody method is used for identifying cells that have incorporated BrdU. In our experiment BrdU was added to the growth medium 11 h after cell release and 10 h postinfrared exposure. They were incubated for 1 h in the presence of 10 μM BrdU (protected from light). Eleven hours plus 1 h BrdU incubation was selected because previous studies of T-1 cell cycling indicated that T-1 cells are synthesizing DNA 12 h into the cell cycle.33 We checked this timing by initiating BrdU uptake at 6, 12, or 24 h after their release. We found indeed the majority (67) of our para-synchronized T-1 cells began synthesizing DNA at about 12 h postrelease, whereas less than 20 of cells began synthesizing DNA at 6 and 24 h. Therefore, all the reported BrdU assay results below were from tests with BrdU added 11 h after cell setup. After a 1 h incubation in the BrdU-containing growth medium, cells were rinsed once with phosphate buffer saline (PBS) without calcium and magnesium, and fixed with −20 °C 70 ethanol. Dishes with fixed cells on them were denatured by floating them on an 80 °C waterbath for 1 min in a fume hood with two mL of 70 formamide in a 2X saline-sodium citrate buffer solution (Sigma) at 80 °C. Cells were then rinsed in PBS at room temperature, dehydrated for 2 min with −20 °C 70 ethanol followed by −20 °C 100 ethanol for 2 min, and dried. After denaturing and alcohol dehydration, cells were rehydrated in 0.1 bovine serum albumin (BSA) blocking buffer in PBS. The primary mouse anti-BrdU antibody (Boehringer-Mannheim, Indianapolis, Indiana) was added at 1:20 in the BSA blocking buffer, protected from light, and incubated for 1 h at room temperature. Cells were washed twice with PBS and then incubated with the secondary antibody, Alexa 594 (red) (Molecular Probe, Eugene, Oregon), diluted 1:100 in PBS for 1 h. Cells were counter stained with 0.25 μg/mL DNA-specific fluorochrome DAPI (4,6-diamidino-2-phenylindole, from Sigma) for 5 min at room temperature, rinsed with PBS, and covered with Vectashield and a clean microscope slide coverslip. Individual cells were examined with a fluorescent microscope. Cells with red fluorescence in their nuclei (BrdU positive) were judged to be undergoing DNA synthesis. Those without red fluorescence were BrdU negative. The blue fluorescence of DAPI was used to identify the location of DNA in both BrdU-positive and BrdU-negative cells. 2.7.MTT Assay to Assess Immediate Metabolic Activity EffectsThe extent of cellular metabolic activity (or biological redox reactions) in cells was detected in situ with the modified 3-[4,5-Dimethylthiazol-2-yl]-2,5-diphenyltetrazolium bromide (MTT) technique according to the protocol (No. TOX-1, 7H258) provided with the assay kit (Sigma, St. Louis, Missouri). This modification of the protocol eliminated the use of a UV/visible spectrometer because our study requires the evaluation of individual cells. The method relies on the ability of mitochondrial dehydrogenases produced in living cells to reduce the yellowish solution of tetrazolium salt (3-[4,5-Dimethylthiazol-2-yl]-2,5-diphenyltetrazolium bromide) to an insoluble purple formazan. Test and control cells already subjected to 5, 10, and 20 min IR exposures were incubated for 2 h in medium containing tetrazolium salts at a final concentration of 1 mg/mL without phenol red. Cells were then revisited with an optical microscope. Cells that had a blue color were judged to have active mitochondrial dehydrogenases that reduce tetrazolium salt, and thus were metabolically active in this test. Cells that were not blue were considered metabolically inactive. 2.8.SR-FTIR Spectromicroscopy to Look for Overall Cellular Chemical ChangesWe used SR-FTIR spectromicroscopy18 for detecting chemical vibrational mode changes in nonexposed controls and in cells exposed to the SR-IR beam. All SR-FTIR spectra were recorded in the 4000–600 cm−1 region as this mid-IR region contains unique molecular absorption fingerprints for cellular chemistry.38 Because the CaF 2 window of the on-stage mini incubator does not transmit IR below 800 cm−1, some spectra were acquired by removing the CaF 2 windows from the mini incubator such that data extending to 600 cm−1 could be examined. Every IR measurement consisted of 128 co-added spectra at a spectral resolution of 4 cm−1. All spectra were obtained in the double-pass transmission geometry and ratioed to a reference spectrum measured from a bare gold-coated slide, then absorbance values were computed. Residual water vapor and CO 2 spectral features from imperfect purging of the spectrometer and IR microscope were subtracted using an appropriately scaled reference spectrum of air. The acquired spectra for the control and exposed cells were compared in detail to look for any spectral changes which could be caused by the exposure to the SR-IR beam. 3.Results and DiscussionTable 1 lists the number of individual cells tested by each cytotoxicity assay. Table 2 summarizes the analyzed results of these assays. For each biological assay we photographed the results for control and test cells that had been exposed to the SR-IR beam for 5, 10, or 20 min. Figures 1 2 3 4 show representative photographs for each assay. In no case did we find a result differing with the representative ones shown in the figures. Figure 1Photograph showing results from alcian blue assays of cells exposed to the SR-IR beam for (a) 5 min, (b) and (c) 10 min, and (d) 20 min. Other cells in the field were not exposed and were used as negative controls. No cells show retention of the blue dye demonstrating that no immediate cytotoxicity is observed. 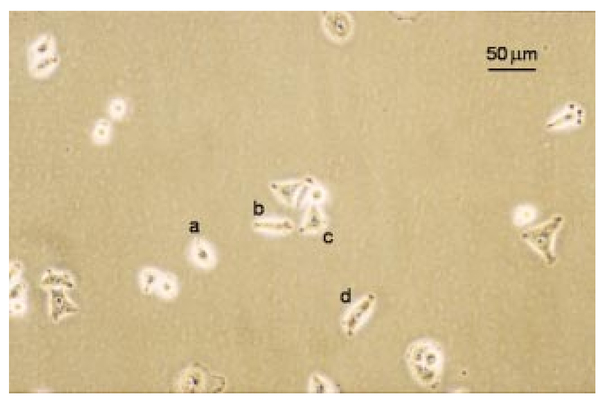 Figure 2Photographs showing typical results for colony forming from (a) a negative control cell and (b) a test cell that had been exposed to the SR-IR beam for 20 min. Both cells proliferated into similar sized colonies after ten days.  Figure 3Photographs showing BrdU assay results for cells exposed to the SR-IR beam for (a) 5 min, (b) 10 min, and (c) 20 min. Two other cells in the field were unexposed and used as negative controls. In the lower panel, the blue color indicates DNA and the red color indicates BrdU incorporation during DNA synthesis. All test and control cells show the same incorporation of BrdU into the DNA.  Figure 4Photograph showing typical MTT assay results for control and test cells that had been exposed to the SR-IR beam for (a) 5 min, (b) 10 min, and (c) 20 min. Other cells in the field were unexposed and are used as controls. All test and control cells show the same blue color indicating the same level of metabolic activity. 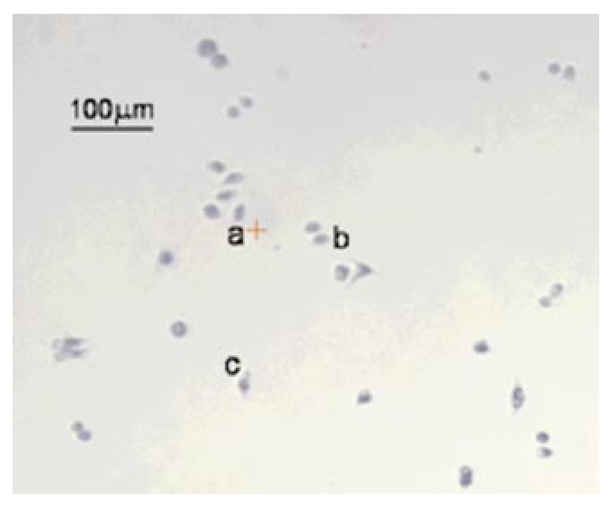 Table 1
Table 2
3.1.SR-IR Beam has no Short-Term Effect on Cell ViabilityAlcian blue assays were carried out as described above. As shown in Figure 1, neither cells exposed to up to 20 min of synchrotron IR beam nor nearby nonexposed cells retained the blue dye 6 h after exposure. This indicates that the SR-IR beam did not produce detectable effects on the viability of exposed cells. Other exposed cells remained free of stain 12 and 24 h after exposure indicating that their membranes stillremained intact. In contrast, dead positive control cells were stained blue as expected, as their membranes had become permeable to the dye molecules. 3.2.Cells Survive and Continue to Proliferate Days Post ExposureWhile the aforementioned short-term test has revealed that cells were viable at the time of the alcian blue assay, the long-term colony-forming assay demonstrates that the exposed cells also continue to proliferate into colonies. The exposed test cells and nearby nonexposed cells proliferated into colonies of similar size (Figure 2), well > 50 cells per colony in ten days. The positive control cells, on the contrary, had detached from the petri dish and disappeared from the field. Since none of the 46 SR-IR exposed test cells developed into colonies with less than 50 cells, we interpret this as an indication that SR-IR beam does not impact cell survival and proliferative activities. 3.3.Exposure to SR-IR Does not Compromise Cell-Cycle ProgressionAs described above the experiment was designed to specifically answer the question, “Do SR-IR beam exposed cells progress into S phase at the same time as unexposed control cells?” Cell-cycle progression in exposed cells was monitored by the incorporation of BrdU into newly synthesized DNA at 11 h after cell setup and 10 h post SR-IR exposure. Both exposed cells and nonexposed controls had reached the DNA synthetic phase (S phase) of cell cycle at this 12 h observation point. For example, the upper photo in Figure 3 shows an image of 5, 10, or 20 min exposed cells and their neighboring nonexposed controls. The lower photo in Figure 3 shows that all three exposed cells as well as the controls have incorporated BrdU into the DNA, which is identified by the double color labeling of red for BrdU and blue for DNA. The similarities among the immunofluorescent staining of BrdU (and DAPI) labeled cells indicate that the exposed cells are not compromised in their ability to enter their S phase in the cell cycle after exposure to the SR-IR beam. Furthermore, the lack of detectable uptake of BrdU into DNA in exposed and control cells at 6 or 24 h after their release demonstrates that the cell-cycle progression of SR-IR exposed cells remains uninterrupted. 3.4.ATP and NAD + -Associated Metabolic Activity is not Impaired by the SR-IR BeamThe 2 h MTT assay was carried out as described above on exposed, negative, and positive controls. Representative photos of the results are shown in Figure 4. Cells exposed for 20 min and nearby nonexposed controls show similar purple-blue stain. On the contrary, tetrazolium salt solution remained yellow in the killed (positive) controls with no purple-blue stain uptake. Results were identical for 5 and 10 min exposures. This implies that both the exposed and negative control cells produced mitochondrial dehydrogenases during the 2 h MTT assay. Mitochondrial dehydrogenases are associated with the ubiquitous metabolic pathway of glycolysis39 that generates the critical biomolecules of Adenosine triphosphate (ATP) and Nicotinamide adenine dinucleotide (NAD +). These results indicate that the SR-IR beam has negligible effects on this important metabolic pathway which provides energy to cells. 3.5.SR-FTIR Spectra Indicate no Changes in Chemistry Inside Exposed CellsFigure 5 shows spectra acquired for two nearby cells, one nonexposed and one that was exposed to the SR-IR beam for 30 min prior to data acquisition. The IR spectra were acquired using the synchrotron source for 70 s (128 co-added scans) as described earlier. The measured signal to noise ratio of the synchrotron IR spectra shown in Figure 5 is excellent, 1250:1. The two spectra are nearly identical with every peak position reproduced exactly and only slight overall intensity variations due to a small difference in the thickness of the two cells. These results indicate that there are no chemical changes happening in the cell upon exposure to the SR-IR beam. We also performed IR measurements repeatedly on one living cell every 10 min for 30 min and the IR spectrum remained unchanged to within 0.005 absorbance units across the entire mid-IR spectral range. Longer exposure times can be tested, however the living cell continues growing through its cell cycle, which results in other previously reported spectral changes.19 Figure 5Infrared spectra for a control cell (black line) and a cell exposed to the SR-IR beam for 30 min (red line). The small intensity variation between the two spectra is due to a slight difference in thickness between the two cells. Otherwise, the spectra are very much the same, indicating no overall change in biochemistry has occured.  In all five assays studied (alcian blue, colony formation, BrdU, MTT, and SR-IR spectra) we found no detectable changes between cells exposed for 5, 10, and 20 min to the synchrotron infrared beam and nearby nonexposed controls. Two hundred sixty seven individual cells were tested using standard biochemical assays with zero tests showing any measurable cytotoxic effects (counting statistics error is ±6.1 ), with over 1000 control cells used. Additionally, infrared spectra that are a measure of the overall biochemistry within a cell were obtained from test and control cells, and showed no spectral changes. These results show that the high-brightness mid-IR synchrotron beam is not only nondestructive, but also causes no effects on both the short- and long-term viability, proliferation, and metabolism within living human T-1 cells. Although the present study has focused on only one established human cell line, we anticipate that these results will be generally applicable to most, if not all, living biological systems. The results reported here lay an important foundation for future biomedical and biological applications of synchrotron infrared spectromicroscopy, which will complement other biochemistry and microscopy techniques. SR-FTIR spectromicroscopy enables the successive monitoring of biochemical changes in individual cells nondestructively without having to treat cells with exogenous dyes, fluorescent labels, or stains, or to resort to destructive techniques. The noninvasive and nondestructive nature of the technique allows each cell in a population to be studied sequentially over a period extending to hours or even days. By monitoring individual cells over time it will be possible to detect the onset of disease and other cellular changes, and to probe the heterogeneity of responses to various treatments or insults within a population of living cells. The development of SR-FTIR spectromicroscopy will result in a broadly applicable and powerful research tool available to the scientific community. AcknowledgmentsThe authors thank Kelly Knutsen and Richard Saykally for assistance with the synchrotron beam power measurements. This research was supported by the Office of Science, Office of Biological and Environmental Research, Medical Science Division and the Office of Science, Office of Basic Energy Sciences, Materials Sciences Division, of the U.S. Department of Energy under Contract No. DE-AC03-76SF00098 at Lawrence Berkeley National Laboratory. REFERENCES
A. Diaspro
,
“Introduction to two-photon microscopy,”
Microsc. Res. Tech. , 47
(3), 163
–164
(1999). Google Scholar
K. Konig
,
“Multiphoton microscopy in life sciences,”
J. Microsc. , 200
(PT2), 83
–104
(2000). Google Scholar
U. K. Tirlapur
,
K. Koenig
,
C. Peuckert
,
R. Kreig
, and
K.-J. Halbhuber
,
“Femtosecond near-infrared laser pulses elicit generation of reactive oxygen species in mammalian cells leading to apoptosis-like death,”
Exp. Cell Res. , 263
(1), 88
–97
(2001). Google Scholar
J. M. Squirrell
,
D. L. Wokosin
,
J. G. White
, and
B. D. Bavister
,
“Long-term two-photon fluorescence imaging of mammalian embryos without compromising viability,”
Nat. Biotechnol. , 17
(8), 763
–767
(1999). Google Scholar
M. Diem
,
S. Boydston-White
, and
L. Chiriboga
,
“Infrared spectroscopy of cells and tissues: Shining light onto a novel subject,”
Appl. Spectrosc. , 53
(4), 148A
–161A
(1999). Google Scholar
J. A. Reffner
,
P. A. Martoglio
, and
G. P. Williams
,
“Fourier transform infrared microscopical analysis with synchrotron radiation - the microscope optics and system performance,”
Rev. Sci. Instrum. , 66
(2), 1298
–1302
(1995). Google Scholar
G. L. Carr
,
J. A. Reffner
, and
G. P. Williams
,
“Performance of an infrared microspectrometer at the NSLS,”
Rev. Sci. Instrum. , 66
(2), 1490
–2
(1995). Google Scholar
W. R. McKinney
,
C. J. Hirschmugl
,
H. A. Padmore
,
T. Lauritzen
,
N. Andreson
,
G. Andronico
,
R. Patton
, and
M. Fang
,
“The first infrared beamline at the ALS: design, construction, and initial commissioning,”
Proc. SPIE , 3153 59
–67
(1997). Google Scholar
W. R. McKinney
,
M. C. Martin
,
J. M. Byrd
et al.;,
“First infrared beamlines at the ALS: final commissioning and new end stations,”
Proc. SPIE , 3775 37
–45
(1999). Google Scholar
L. M. Miller
,
G. L. Carr
,
G. P. Williams
, and
M. R. Chance
,
“Synchrotron infrared microspectroscopy as a means of studying chemical composition at a cellular level,”
Biophys. J. , 72
(2 ), A214
(1997). Google Scholar
N. Jamin
,
P. Dumas
,
J. Moncuit
,
W.-H. Fridman
,
J.-L. Teilland
,
G. L. Carr
, and
G. P. Williams
,
“Highly resolved chemical imaging of living cells by using synchrotron infrared microspectrometry,”
Proc. Natl. Acad. Sci. U.S.A. , 95
(9), 4837
–4840
(1998). Google Scholar
N. Jamin
,
P. Dumas
,
J. Moncuit
,
W. H. Fridman
,
J. L. Teilland
,
G. L. Carr
, and
G. P. Williams
,
“Chemical imaging of nucleic acids, proteins and lipids of a single living cell. Application of synchrotron infrared microspectrometry in cell biology,”
Cell Mol. Biol. (Paris) , 44
(1), 9
–13
(1998). Google Scholar
H.-Y. N. Holman
,
M. Zhang
,
R. Goth-Goldstein
,
M. C. Martin
,
M. Russell
,
W. R. McKinney
,
M. Ferrari
, and
J. C. Hunter-Cevera
, Proc. SPIE , 3606 55
–63
(1999). Google Scholar
H.-Y. N. Holman
,
R. Goth-Goldstein
,
M. C. Martin
,
M. L. Russel
, and
W. R. McKinney
,
“Low-dose responses to 2,3,7,8-tetrachlorodibenzo-p-dioxin in single living human cells measured by synchrotron infrared spectromicroscopy,”
Environ. Sci. Technol. , 34
(12), 2513
–2517
(2000). Google Scholar
H.-Y. N. Holman
,
M. C. Martin
,
E. A. Blakely
,
M. Bjornstad
, and
W. R. McKinney
,
“IR spectroscopic characteristics of cell cycle and cell death probed by synchrotron radiation based Fourier transform IR spectromicroscopy,”
Biopolymers: Biospectrosc. , 57
(6), 329
–335
(2000). Google Scholar
L.-P. I. Choo
,
D. L. Wetzel
,
W. C. Halliday
,
M. Jackson
,
S. M. Levine
, and
H. H. Mantsch
,
“In situ characterization of beta-amyloid in Alzheimer’s diseased tissue by synchrotron Fourier transform infrared microspectroscopy,”
Biophys. J. , 71
(4), 1672
–1679
(1996). Google Scholar
L. M. Miller
,
C. S. Carlson
,
G. L. Carr
, and
M. R. Chance
,
“A method for examining the chemical basis for bone disease: Synchrotron infrared microspectroscopy,”
Cell Mol. Biol. (Paris) , 44
(1), 117
–127
(1998). Google Scholar
F. Briki
,
B. Busson
,
L. Kreplak
,
P. Dumas
, and
J. Doucet
,
“Exploring a biological tissue from atomic to macroscopic scale using synchrotron radiation: Example of hair,”
Cell Mol. Biol. (Paris) , 46
(5), 1005
–1016
(2000). Google Scholar
L. M. Miller
,
J. Tibrewala
, and
C. S. Carlson
,
“Examination of bone chemical composition in osteoporosis using fluorescence-assisted synchrotron infrared microspectroscopy,”
Cell Mol. Biol. (Paris) , 46
(6), 1035
–1044
(2000). Google Scholar
H.-Y. N. Holman
,
D. L. Perry
,
M. C. Martin
,
G. M. Lamble
,
W. R. McKinney
, and
J. C. Hunter-Cevera
,
“Real-time characterization of biogeochemical reduction of Cr(VI) on basalt surfaces by SR-FTIR imaging,”
Geomicrobiology J. , 16
(4), 307
–324
(1999). Google Scholar
J. T. Geller
,
H. Y. Holman
,
G. Su
,
M. E. Conrad
,
K. Preess
, and
J. C. Hunter-Cevera
,
“Flow dynamics and potential for biodegradation of organic contaminants in fractured rock vadose zones,”
J. Contam. Hydrol. , 43
(1), 63
–90
(2000). Google Scholar
L. M. Miller
,
A. J. Pedraza
, and
M. R. Chance
,
“Identification of conformational substates involved in nitric oxide binding to ferric and ferrous myoglobin through difference Fourier transform infrared spectroscopy (FTIR),”
Biochemistry , 36
(40), 12199
–12207
(1997). Google Scholar
A. H. Xie
,
Q. He
,
L. Miller
,
B. Scalvio
, and
M. R. Chance
,
“Low frequency vibrations of amino acid homopolymers observed by synchrotron far-IR absorption spectroscopy: Excited state effects dominate the temperature dependence of the spectra,”
Biopolymers , 49
(7), 591
–603
(1999). Google Scholar
T. K. Raab
and
M. C. Martin
,
“Visualizing rhizosphere chemistry of legumes with midinfrared synchrotron radiation,”
Planta , 213 881
–887
(2001). Google Scholar
M. C. Martin
,
N. M. Tsvetkova
,
J. H. Crowe
, and
W. R. McKinney
,
“Negligible sample heating from synchrotron infrared beam,”
Appl. Spectrosc. , 55
(2), 111
–113
(2001). Google Scholar
J. van der Veen
,
L. Bots
, and
A. Mes
,
“Establishment of two human cell strains from kidney reticulosarcoma of lung,”
Arch. Gesamte Virushorsch , 8 230
–238
(1958). Google Scholar
G. W. Barendsen
,
C. J. Koot
,
G. R. Van Kersen
,
P. K. Bewley
,
S. B. Field
, and
C. J. Parnell
,
“The effect of oxygen on impairment of the proliferative capacity of human cells in culture by ionizing radiations of different LET,”
Int. J. Radiat. Biol. Relat. Stud. Phys. Chem. Med. , 10
(4), 317
–27
(1966). Google Scholar
E. A. Blakely
,
P. Y. Chang
, and
L. Lommel
,
“Cell-cycle-dependent recovery from heavy-ion damage in
G1
-phase cells,”
Radiat. Res. , 104
(2 ),
(1985). Google Scholar
E. A. Blakely
,
R. J. Roots
,
P. Y. Chang
et al.;,
“Cell-cycle dependence of x-ray oxygen effect role of endogenous glutathione,”
NCI Monogr. , 6 217
–224
(1988). Google Scholar
E. A. Blakely
,
“Cell inactivation by heavy charged particles,”
Radiat. Environ. Biophys. , 31
(3), 181
–196
(1992). Google Scholar
E. A. Blakely
,
C. A. Tobias
,
T. C. Yang
,
K. C. Smith
, and
J. T. Lyman
,
“Inactivation of human kidney cells by high-energy monoenergetic heavy-ion beams,”
Radiat. Res. , 80
(1), 122
–60
(1979). Google Scholar
A. C. Thompson
,
J. H. Underwood
,
E. H. Anderson
,
S. A. McHugo
, and
B. P. Lai
,
“Characterization of the focal quality of micron-size beams from x-ray mirrors and zone plates,”
Proc. SPIE , 4145 16
–21
(2000). Google Scholar
D. K. Yip
and
N. Auersperg
,
“The dye-exclusion test for cell viability: persistence of differential staining following fixation,”
In Vitro , 7
(5), 323
–329
(1972). Google Scholar
T. F. Slater
,
B. Sawyer
,
U. Strauli
,
“Studies on succinate-tetrazolium reductase systems, III Points of coupling of four different tetrazolium salts,”
Biochim. Biophys. Acta , 77 383
(1963). Google Scholar
|
|||||||||||||||||||||||||||||||||||||||||||||||||||||||


CITATIONS
Cited by 76 scholarly publications and 1 patent.
Synchrotrons
Infrared radiation
Infrared spectroscopy
Microscopes
FT-IR spectroscopy
Photography
Biochemistry


