1.IntroductionZinc is an ion of growing importance in many fields of biology and medicine. In particular, recent work has demonstrated the excitotoxic role(s) of zinc in the brain,1 2 3 as well as its potential role as a signaling ion in the brain4 which recent evidence suggests participates in long term potentiation.5 Elsewhere in the body, zinc seems to play a role in the immune response,6 and is a prevalent constituent of semen, as well as an essential cofactor in many enzymes7 and the ubiquitous “zinc fingers” of transcription factors.8 The role of zinc in apoptosis is the subject of controversy,9 and there is no consensus as to how zinc is distributed in the body, allocated among its many role(s), or how these processes are regulated. The availability of selective, sensitive, quantifiable fluorescent calcium indicators beginning with Quin-2, Fura-2, and Indo-110 has revolutionized our understanding of calcium, and if analogous indicators were available for zinc, perhaps comparable progress could be made. Despite substantial effort,9 11 12 13 14 15 16 it is only recently that fluorescent zinc indicators have been made which offer adequate selectivity over potential interferents such as Ca and Mg; reliable quantitation through intensity ratios, anisotropy, or fluorescence lifetime; and useful sensitivity. In particular, the recently introduced FuraZin-1 and Newport Green DCF from Molecular Probes offer selectivity (Thompson et al.;, J. Neurosci. Methods, in press), micromolar sensitivity, and quantitation by excitation intensity ratio (FuraZin) and fluorescence lifetime (Newport Green). However, substantial recent evidence suggests that, as in the case of calcium, elucidation of the biology of zinc will require in many cases significantly better sensitivity than the above indicators offer. In particular, release of zinc into the ventricle of rabbit brain following transient global ischemia or blunt force trauma yields peak levels in the nanomolar range, against a background of less than five nanomolar (Frederickson et al.;, in preparation). The affinity of the NR2A subunit of AMPA receptor for Zn(II) has been measured in vitro to be 20 nM [Williams, 1996 #404],17 suggesting that it responds to zinc levels in this regime. Ordinarily the free Zn(II) concentration in serum is 1 nM or less, based on measurements and calculations incorporating the affinities of the two principal Zn buffers, α2 -macroglobulin and serum albumin.18 Recent work suggests that free Zn(II) concentrations may be very low in bacterial cells.19 While other recent results (Thompson et al.;, J. Neurosci. Methods, in press)20 indicate that the stimulus-induced release of zinc in hippocampus is in the micromolar range, the lower range indicated by the above measurements suggests that it will be necessary to measure lower concentrations, particularly inside cells. Our laboratories have developed a series of fluorescent zinc indicators based on the high affinity (1 pM) and outstanding selectivity of human apocarbonic anhydrase II (CA).21 22 23 24 The selectivity of CA for Zn(II) is outstanding: Ca(II) and Mg(II) do not interfere at concentrations of 10 and 50 mM, respectively, and other divalent cations which bind (Cu, Cd, Ni, and Co) are seldom found above trace levels in most organisms. Moreover, these metals do not promote binding of sulfonamides and the concomitant fluorescent change, so they do not create a false positive response, but do affect quantitation. In measurements in organotypic cell cultures,25 hippocampal slices,26 and extracellular fluid (Thompson et al.;, J. Neurosci. Methods, in press; Frederickson et al.;, in preparation), the interference is evidently quite small. Most CA-based Zn determinations take advantage of the propensity of the holo form of CA to bind aryl sulfonamides in the anionic form as a fourth ligand to the active-site Zn(II), replacing the water molecule usually found there.27 In the absence of zinc, binding of the aryl sulfonamide is usually at least 1000-fold weaker.28 If the aryl sulfonamide is fluorescent, binding to the protein nearly always causes a change in its fluorescence anisotropy,29 and for selected aryl sulfonamides there may be changes in intensity, spectral properties, quantum yield and lifetime.25 28 30 31 The fluorescent changes of the sulfonamide can thus be related to its fractional occupancy of the binding site on the protein, which is in turn determined by the presence of zinc therein; since the zinc binding is a simple function of the free zinc concentration, the fluorescence changes can be used to determine the free zinc concentration. An example of this is Dapoxyl sulfonamide, which upon binding to the holoprotein exhibits a 60 nm blueshift of its emission, and a 20-fold increase in its lifetime and quantum yield, permitting determination of zinc by lifetime, intensity changes, or the ratio of intensity changes at two emission wavelengths31 (Figure 1). Figure 1Schematic of Zn(II) determination by fluorescence using apocarbonic anhydrase and Dapoxyl sulfonamide. 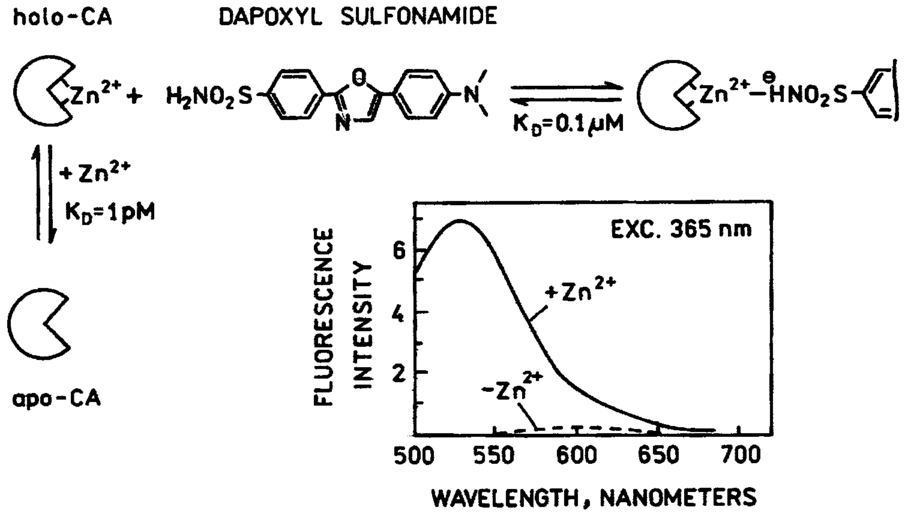 However, for quantitative analysis by fluorescence microscopy, only certain transduction modes are preferred, or even useful. Intensity ratios at two different emission or excitation wavelengths, as well as anisotropy or lifetime measurements, offer facile calibration and relative freedom from artifact compared with intensity measurements. While several fluorescence lifetime microscopes have been demonstrated,32 33 34 and are commercially available from two manufacturers, such instruments are not yet in widespread use. Similarly, although fluorescence polarization microscopy has been demonstrated by Axelrod and Verkman,35 36 this technique is also not in widespread use. Particularly for calcium imaging, intensity ratios have been preferred, and especially the ratio of emission intensity at two differing excitation wavelengths. This is because in the fluorescence microscope changing excitation wavelengths has little impact on the image quality, whereas changing the emission wavelength often affects the image quality. Moreover, changing the excitation wavelength can be done quickly using acousto-optic tunable filters to image rapidly changing specimens, whereas this is harder on the emission side. Currently there are a large number of fluorescence microscopes capable of excitation ratiometric measurements in use. While some of the fluorescent aryl sulfonamides exhibit shifts in their excitation upon binding,25 30 these shifts are too small to be useful. We developed a Fo¨rster resonance energy transfer (FRET) approach to selectively observe the binding of an arylsulfonamide as a change in intensity at two different excitation wavelengths. This is illustrated in Figure 2. Dapoxyl sulfonamide binds to holoprotein tightly (Kd=0.2 μM), 31 exhibiting a 20-fold increase in quantum yield and lifetime upon excitation at 365 nm, and approximately a 60 nm blueshift in its emission (Figure 3). If the Dapoxyl is in the presence of holo-CA covalently labeled at a position close to the binding site with a fluorophore (such as Alexa Fluor 594) which absorbs well at wavelengths where bound Dapoxyl sulfonamide emits (about 550 nm), the Dapoxyl sulfonamide will bind to the protein and (being thus in close proximity) transfer its energy by the Forster mechanism to the label, which in turn emits at about 610 nm. Naturally, the efficiency of the energy transfer depends on the proximity of the label and Dapoxyl sulfonamide, their relative orientation, and their spectral overlap.37 The introduction of cysteine residues into the protein structure at predetermined points by site directed mutagenesis permits the covalent label to be positioned optimally for energy transfer.38 With excitation at 365 nm, the emission at 617 nm should be fairly strong, because, although the Alexa Fluor absorbs poorly at this excitation wavelength, Dapoxyl absorbs well and transfers its energy to the Alexa Fluor which emits well at 617 nm. Exciting this mixture at 548 nm yields the strong fluorescence of the Alexa Fluor label only, since Dapoxyl does not absorb at this wavelength. The wavelengths 365 and 548 nm are mercury emission lines, and chosen for the convenient use of that excitation source; other wavelengths nearby will also work, although the numerical value of the ratio is changed somewhat. In the absence of Zn(II) the protein is in the apo form, and the Dapoxyl sulfonamide does not bind; as a result its emission is weak, and there is no propensity to transfer energy to the Alexa Fluor 594 since on the average the Dapoxyl sulfonamide will be thousands of angstroms away from the Alexa Fluor 594-labeled protein at micromolar concentrations, and energy transfer will be negligible. Thus in the absence of zinc the only emission expected at 617 nm with excitation at 365 nm will be the weak emission of the Alexa Fluor 594 (which absorbs poorly) and the weak emission of free Dapoxyl sulfonamide. With excitation in the green at 548 nm the emission at 617 is essentially unchanged, since one only excites the Alexa Fluor at this wavelength. Consequently, at low zinc concentrations we expect a low ratio of emission excited at 365 and observed at 617 nm to that excited at 548 nm and observed at 617 nm; whereas at higher zinc concentrations we anticipate the ratio to increase since the intensity excited at 365 nm and observed at 610 nm will increase. 2.Materials and MethodsThe L198C variant of human apocarbonic anhydrase II was constructed, expressed in E. coli BL21 cells, and purified as previously described.39 The protein was conjugated with Alexa Fluor 594 maleimide (Molecular Probes, Eugene, OR) at the introduced cysteinyl residue and the zinc ion removed also as previously described.40 Dapoxyl sulfonamide was synthesized as described,31 and further purified from the residual sulfonic acid form by silica gel column chromatography in chloroform : methanol 3:1; the purification may be assessed by monitoring the blue fluorescence of the acid form and the yellowish fluorescence of the sulfonamide under 365 nm excitation. Steady state fluorescence spectra were acquired on a Spectronics AB-2 fluorometer, and zinc ion buffers were formulated using the MINEQL program (Environmental Research Software, Hallowell, Maine). 3.ResultsFrom the overlap of the emission spectrum of the Dapoxyl sulfonamide with the excitation spectrum of Alexa Fluor 594 (Figure 3), it is apparent that Fo¨rster transfer will occur from the former to the latter if they are brought into close proximity, and their dipoles are not rigid and orthogonal. In fact, by attaching the Alexa Fluor at position 198, it should be quite close, less than 10 Å from the Dapoxyl sulfonamide if it binds in a manner similar to dansylamide.41 Calculating the overlap integral from the spectra and assuming the fluorophores exhibit an orientation factor (κ2=2/3) indicates that the R0, the so-called Fo¨rster distance where transfer is 50 efficient, is 38 Å, and that the transfer efficiency of the bound Dapoxyl sulfonamide to the Alexa Fluor should be greater than 99. That the energy transfer depends on free zinc binding and not solely due to zinc-independent binding of the sulfonamide may be seen in Figure 4, which depicts the emission spectra of fixed concentrations of Alexa Fluor 594-labeled apo L198C and Dapoxyl sulfonamide as a function of zinc concentration. The increase in intensity of the emission at 617 nm is due to energy transfer from the Dapoxyl, as may be seen from the increase in apparent ultraviolet absorbance in the excitation spectra (Figure 5). The Alexa Fluor emission does not change significantly with varying zinc concentration in the absence of Dapoxyl sulfonamide (results not shown). The emission at 560 nm also increases with zinc concentration, but not as much as in the absence of the Alexa-fluor label.31 This behavior occurs if the energy transfer is not quantitative, and, in fact, the 2.5-fold enhancement observed (instead of 20-fold) is greater than expected with the 99+ energy transfer efficiency anticipated above. Three potential explanations for this “leakage” of Dapoxyl sulfonamide emission include the presence of small amounts of unlabeled L198C carbonic anhydrase, distortion of the protein structure such that the donor and acceptor are farther away than suggested by the crystal structure, and unfavorable orientation of rigidly bound donor and acceptor moieties such that the orientation factor (κ2) is not 2/3. In fact the 2/3 approximation which is widely used presumes that either the donor or acceptor (or both) rotates rapidly on the time scale of the donor lifetime, which seems unlikely. Resolving the issue would appear to require structural data not in hand, and in any case it does not affect the utility of the assay. Figure 4Emission spectra of 80 nM apoL198C-Alexa Fluor 594 and 1 μM Dapoxyl sulfonamide in the presence of solutions buffered at (in ascending order at 610 nm) 0.002, 10, 54, and 0.5 nM free Zn(II); excitation at 365 nm.  Figure 5Excitation spectra of 50 nM apoL198C-Alexa Fluor 594 and 2 μM Dapoxyl sulfonamide in the absence (—) and presence of 50 nM free Zn(II) (– –); emission at 617 nm.  If the ratio of fluorescence intensity with emission at 617 nm and excitation at 365 nm compared to that with excitation at 548 nm is plotted as a function of free zinc concentration, one observes binding saturation at concentrations well above 100 pM (Figure 6). The free zinc concentrations were maintained at these low levels using zinc buffers. The dependence on free zinc in the picomolar range is as expected, based on the known affinity of apo-CA for zinc.42 The saturating behavior at higher zinc concentrations and the very low free zinc concentrations at which the effects are observed clearly indicate that the zinc dependence is not a collisional process but a binding phenomenon. The best fit single site binding isotherm to the data in Figure 6 is indicated by the line and yields an apparent KD of 56±8 pM. This is significantly higher than that of the wild-type protein (1 pM), but such differing affinities of variant CA’s have frequently been observed. The absolute value of the ratio is not large because of the strong emission of the Alexa Fluor when excited at 548 nm, where its extinction coefficient is approximately 31 400 M −1 cm −1, whereas the extinction coefficient of the Dapoxyl sulfonamide is approximately 25 000 M −1 cm −1 at 365 nm, and the excitation intensity is less as well. The ratio increases 60 upon binding of the zinc, which is a usable change. The exact value of the ratio in any case depends on the relative excitation strength at the two excitation wavelengths, and the wavelengths chosen, thus the calibration in Figure 6 is instrument specific. From Figure 6, the detection limit is in the vicinity of 10 pM. These results demonstrate that free zinc ion can be quantitated by an excitation ratiometric approach at picomolar levels, and suggest that ratiometric images may be obtained through the microscope as well. 4.DiscussionThe carbonic anhydrase-based FRET sensor has several advantages over other zinc indicators. First, the fact that it is ratiometric makes it less sensitive to many artifacts and easier to calibrate, unlike most other zinc probes.9 11 14 Also, it is extremely selective due to the properties of the carbonic anhydrase zinc ion binding site.23 It is more than 10 000-fold more sensitive than the most selective ratiometric indicator (FuraZin-1), and at least five orders of magnitude more selective than the most sensitive ratiometric indicator (Fura-2).10 This approach has several advantages beyond those inherent in excitation ratios. A key issue in quantitating free Zn(II) in cells using apo CA and aryl sulfonamides are the unknown and potentially variable amounts of carbonic anhydrase likely to be found therein. In this case one only observes the emission from the Alexa Fluor 594-labeled protein, so Dapoxyl bound to CA in the cell does not contribute significantly. Although Dapoxyl sulfonamide exhibits fluorescence when bound to membranes that is comparable to that when bound to holocarbonic anhydrase,31 the fact that it is not in close proximity to the Alexa Fluor-labeled carbonic anhydrase II means that energy transfer is unlikely and no increase in Alexa Fluor emission should be observed. A key issue is how the quantitation of zinc is affected by the presence of varying amounts of Dapoxyl sulfonamide. However, in this case (except for the weak emission from the free Dapoxyl) again one is only observing the Alexa Fluor emission, and if excess Dapoxyl sulfonamide over Alexa Fluor-labeled CA is present, it will contribute only minimally. Of course, if either Dapoxy sulfonamide or Alexa Fluor-labeled protein is present at concentrations significantly under the KD of 0.2 μM, the fractional saturation with the sulfonamide will be less than that of the zinc in the active site, and the zinc concentration will be under reported. Thus at intermediate concentrations at least the ratio is likely to be largely independent of the Dapoxyl sulfonamide concentration. This biosensing approach thus has substantial potential for measuring very low levels of zinc in biological systems. Note that the affinity for zinc and its selectivity with respect to other metals can be tuned over a broad range by subtle modification of the carbonic anhydrase structure.23 It is ideal for extracellular measurements. For intracellular determinations it is necessary to introduce the protein component by any of several means: microinjection, gene gun, lipid vesicle fusion, or introduction as a PEBBLE,43 Dapoxyl sulfonamide is rapidly cell permeant. Such intracellular measurements will be undertaken out in the near future. AcknowledgmentsThe authors are grateful to the National Institutes of Health and the Office of Naval Research for support. REFERENCES
D. W. Choi
and
J. Y. Koh
,
“Zinc and brain injury,”
Annu. Rev. Neurosci. , 21 347
–375
(1998). Google Scholar
C. J. Frederickson
,
S. W. Suh
,
D. Silva
,
C. J. Frederickson
, and
R. B. Thompson
,
“Importance of zinc in the central nervous system: the zinc-containing neuron,”
J. Nutr. , 130 1471S
–1483S
(2000). Google Scholar
J. H. Weiss
,
S. L. Sensi
, and
J.-Y. Koh
,
“Zn(II): a novel ionic mediator of neural injury in brain disease,”
Trends Pharmacol. Sci. , 21 395
–401
(2000). Google Scholar
C. J. Frederickson
and
A. I. Bush
,
“Synaptically released zinc: Physiological functions and pathological effects,”
BioMetals , 14 353
–366
(2001). Google Scholar
Y. Li
,
C. J. Hough
,
C. J. Frederickson
, and
J. M. Sarvey
,
“Induction of mossy fiber-CA3 long term potentiation requires translocation of synaptically released zinc,”
J. Neurosci. , 21 8015
–8025
(2001). Google Scholar
P. J. Fraker
and
W. G. Telford
,
“A reappraisal of the role of zinc in life and death decisions of cells,”
Proc. Soc. Exp. Biol. Med. , 215 229
–236
(1997). Google Scholar
B. L. Vallee
and
K. H. Falchuk
,
“The biochemical basis of zinc physiology,”
Physiol. Rev. , 73 79
–118
(1993). Google Scholar
J. M. Berg
and
Y. Shi
,
“The galvanization of biology: a growing appreciation for the roles of zinc,”
Science , 271 1081
–1085
(1996). Google Scholar
P. D. Zalewski
,
I. J. Forbes
, and
W. H. Betts
,
“Correlation of apoptosis with change in intracellular labile Zn(II) using Zinquin [(2-methyl-8-p-toluenesulphonamido-6-quinolyloxy)acetic acid], a new specific fluorescent probe for Zn(II),”
Biochem. J. , 296 403
–408
(1993). Google Scholar
G. Grynkiewicz
,
M. Poenie
, and
R. Y. Tsien
,
“A new generation of calcium indicators with greatly improved fluorescence properties,”
J. Biol. Chem. , 260 3440
–3450
(1985). Google Scholar
C. J. Frederickson
,
E. J. Kasarskis
,
D. Ringo
, and
R. E. Frederickson
,
“A quinoline fluorescence method for visualizing and assaying histochemically reactive zinc (bouton zinc) in the brain,”
J. Neurosci. Methods , 20 91
–103
(1987). Google Scholar
T. Budde
,
A. Minta
,
J. A. White
, and
A. R. Kay
,
“Imaging free zinc in synaptic terminals in live hippocampal slices,”
Neuroscience , 79 347
–358
(1997). Google Scholar
S. C. Burdette
,
G. K. Walkup
,
B. Spingler
,
R. Y. Tsien
, and
S. J. Lippard
,
“Fluorescent Sensors for
Zn2+
based on a fluorescein platform: synthesis, properties, and intracellular distribution,”
J. Am. Chem. Soc. , 123 7831
–7841
(2001). Google Scholar
G. K. Walkup
,
S. C. Burdette
,
S. J. Lippard
, and
R. Y. Tsien
,
“A new cell-permeable fluorescent probe for
Zn2+,
,”
J. Am. Chem. Soc. , 122 5644
–5645
(2000). Google Scholar
T. Hirano
,
K. Kikuchi
,
Y. Urano
,
T. Higuchi
, and
T. Nagano
,
“Novel zinc fluorescent probes excitable with visible light for biological applications,”
Angew. Chem. Int. Ed. Engl. , 39 1052
–1054
(2000). Google Scholar
E. Kimura
and
S. Aoki
,
“Chemistry of zinc(II) fluorophore sensors,”
BioMetals , 14 191
–204
(2001). Google Scholar
P. Paoletti
,
P. Ascher
, and
J. Neyton
,
“High-affinity zinc inhibition of NMDA NR1-NR2A receptors,”
J. Neurosci. , 17 5711
–5725
(1997). Google Scholar
J. G. Reyes
,
“Zinc transport in mammalian cells,”
Am. J. Physiol. , 270 C401
–410
(1996). Google Scholar
C. E. Outten
and
T. V. O’Halloran
,
“Femtomolar sensitivity of metalloregulatory proteins controlling zinc homeostasis,”
Science , 292 2488
–2492
(2001). Google Scholar
Y. Li
,
C. Hough
,
S. W. Suh
,
J. M. Sarvey
, and
C. J. Frederickson
,
“Rapid translocation of
Zn2+
from presynaptic terminals into postsynaptic hippocampal neurons after physiological stimulation,”
J. Neurophysiol. , 86 2597
–2604
(2001). Google Scholar
S. Lindskog
and
P. O. Nyman
,
“Metal-binding properties of human erythrocyte carbonic anhydrases,”
Biochim. Biophys. Acta , 85 462
–474
(1964). Google Scholar
J. A. Hunt
,
M. Ahmed
, and
C. A. Fierke
,
“Metal binding specificity in carbonic anhydrase is influenced by conserved hydrophobic amino acids,”
Biochemistry , 38 9054
–9060
(1999). Google Scholar
C. A. Fierke
and
R. B. Thompson
,
“Fluorescence-based biosensing of zinc using carbonic anhydrase,”
BioMetals , 14 205
–222
(2001). Google Scholar
R. B. Thompson
,
W. O. Whetsell Jr.
,
B. P. Maliwal
,
C. A. Fierke
, and
C. J. Frederickson
,
“Fluorescence microscopy of stimulated Zn(II) release from organotypic cultures of mammalian hippocampus using a carbonic anhydrase-based biosensor system,”
J. Neurosci. Methods , 96 35
–45
(2000). Google Scholar
K. Listiak
,
S. W. Suh
,
B. Bell
,
J. Chen
,
D. Silva
,
M. Motamedi
,
G. Schneider
,
W. Whetsell
,
R. B. Thompson
, and
C. J. Frederickson
,
“Detection of pathological zinc accumulation in neurons: methods for autopsy, biopsy, and cultured tissue,”
J. Histochem. Cytochem. , 47 969
–972
(1999). Google Scholar
R. B. Thompson
and
E. R. Jones
,
“Enzyme-based fiber optic zinc biosensor,”
Anal. Chem. , 65 730
–734
(1993). Google Scholar
D. Elbaum
,
S. K. Nair
,
M. W. Patchan
,
R. B. Thompson
, and
D. W. Christianson
,
“Structure-based design of a sulfonamide probe for fluorescence anisotropy detection of zinc with a carbonic anhydrase-based biosensor,”
J. Am. Chem. Soc. , 118 8381
–8387
(1996). Google Scholar
R. B. Thompson
,
B. P. Maliwal
, and
C. A. Fierke
,
“Expanded dynamic range of free zinc ion determination by fluorescence anisotropy,”
Anal. Chem. , 70 1749
–1754
(1998). Google Scholar
R. B. Thompson
,
B. P. Maliwal
, and
H. H. Zeng
,
“Zinc biosensing with multiphoton excitation using carbonic anhydrase and improved fluorophores,”
J. Biomed. Opt. , 5 17
–22
(2000). Google Scholar
K. Fushimi
,
J. A. Dix
, and
A. S. Verkman
,
“Cell membrane fluidity in the intact kidney proximal tubule measured by orientation-independent fluorescence anisotropy imaging,”
Biophys. J. , 57 241
–254
(1990). Google Scholar
T. Forster
,
“Intermolecular energy migration and fluorescence (Ger.),”
Ann. Phys. (Leipzig) , 2 55
–75
(1948). Google Scholar
R. B. Thompson
,
Z. Ge
,
M. W. Patchan
, and
C. A. Fierke
,
“Performance enhancement of fluorescence energy transfer-based biosensors by site-directed mutagenesis of the transducer,”
J. Biomed. Opt. , 1 131
–137
(1996). Google Scholar
J. F. Krebs
and
C. A. Fierke
,
“Determinants of catalytic activity and stability of carbonic anhydrase II as revealed by random mutagenesis,”
J. Biol. Chem. , 268 948
–954
(1993). Google Scholar
J. B. Hunt
,
M. J. Rhee
, and
C. B. Storm
,
“A rapid and convenient preparation of apocarbonic anhydrase,”
Anal. Biochem. , 79 614
–617
(1977). Google Scholar
S. K. Nair
,
D. Elbaum
, and
D. W. Christianson
,
“Unexpected binding mode of the sulfonamide fluorophore 5-dimethylamino-1-naphthalene sulfonamide to human carbonic anhydrase II: Implications for the development of a zinc biosensor,”
J. Biol. Chem. , 271 1003
–1007
(1996). Google Scholar
J. A. Hunt
and
C. A. Fierke
,
“Selection of carbonic anhydrase variants displayed on phage: aromatic residues in zinc binding site enhance metal affinity and equilibration kinetics,”
J. Biol. Chem. , 272 20364
–20372
(1997). Google Scholar
H. A. Clark
,
M. Hoyer
,
M. A. Philbert
, and
R. Kopelman
,
“Optical nanosensors for chemical analysis inside single living cells. 1. Fabrication, characterization, and methods for intracellular delivery of PEBBLE sensors,”
Anal. Chem. , 71 4831
–4836
(1999). Google Scholar
|


CITATIONS
Cited by 33 scholarly publications.


