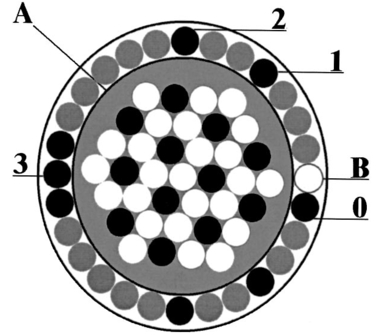
1.IntroductionCervical cancer is the third most common cancer in women worldwide and the leading cause of cancer mortality for women in developing countries.1 When precancerous lesions are detected early they are easily treatable by ablation or excision. At more advanced stages, cervical cancer often requires hysterectomy, chemotherapy, radiation therapy, or combined chemoradiation therapy.2 In the developed world we have good screening and detection programs, but these are cumbersome and costly. Kurman et al.; estimated that $6 billion are spent on the diagnostic evaluation and treatment of 2.5 million atypias and low-grade squamous intraepithelial lesions (LGSILs) alone.3 In the developing world, resources for screening are not available and, as a result, many young women die of a preventable disease. Currently, screening for cervical cancer and its precursors is accomplished using the Papanicolaou (Pap) smear, which is unable to achieve a concurrently high sensitivity and high specificity; values for sensitivity and specificity range from 11 to 99 and from 14 to 97, respectively.4 Results are typically available in two weeks; an abnormal Pap smear is followed by a colposcopy. In colposcopy a mounted magnifying lens is used to view the cervix after a 3–6 acetic acid solution (vinegar) is applied to increase the contrast between the normal cervix and areas of precancer, which turn white after application of acetic acid. Colposcopy provides excellent sensitivity (>90), but poor specificity (<50) for localizing cervical neoplasia, even in the hands of experienced practitioners.5 Because the specificity is poor, a directed biopsy is required to confirm the diagnosis, with results typically available one week later, thereby requiring a return visit for the patient if treatment is indicated. Currently, women often wait up to eight weeks to be treated as part of the standard of care in the diagnosis and treatment of the abnormal Pap smear. Many groups have demonstrated that techniques based on quantitative optical spectroscopy have the potential to fulfill the need for improved screening and diagnosis of neoplasia.6 7 8 Optical measurement of tissue provides quantitative information that can be analyzed instantaneously and produce an objective diagnosis even in the hands of a nonexpert operator. Devices to make these measurements have become inexpensive,9 robust, and portable because of advances in computing, fiber optics, and semiconductor technology. Approaches based on reflectance, fluorescence, and Raman spectroscopies have shown potential for improved detection of epithelial neoplasia.7 8 10 11 12 13 14 15 16 17 18 19 20 21 22 23 24 25 26 27 28 29 30 31 32 33 34 35 In particular, investigations using reflectance spectroscopy indicate initial success in the diagnosis of neoplasia in the bladder,26 uterine cervix,36 and gastrointestinal tract.37 In reflectance spectroscopy, light remitted from tissue has undergone a combination of elastic scattering and absorption, providing information about tissue absorbers and scatterers, which are believed to change with neoplastic conversion. The development of neoplasia is accompanied by local architectural changes at the cellular and subcellular levels, including (1) changes in the nuclear-to-cytoplasmic ratio of epithelial cells;2 38 39 (2) neovascularization;2 40 and (3) changes in stromal properties.2 28 These changes are hypothesized to affect the elastic scattering properties of tissue as follows. (1) Electromagnetic modeling predicts that the intensity of cellular light scattering increases with the progression of cervical precancer because of changes in nuclear size and DNA content.38 Mourant et al.; measured changes in scattering in tumorigenic and nontumorigenic cells which confirmed increased scattering from tumorigenic cells from 500 to 790 nm.39 (2) Dellas et al.; found that neoplastic lesions show increased angiogenesis compared with adjacent normal cervical epithelium—a process that significantly progresses with the severity of the precancer.40 (3) Tromberg presented a pilot study that indicated that differences in the tissue absorption and scattering coefficients in the near-infrared (NIR) spectral regions can be used to discriminate between normal and precancerous cervical epithelia.28 Neoplasia had up to a 15 decrease in absorption and scattering relative to normal tissue. Because of the large source–detector separations used in Ref. 28, changes in scattering likely represent changes in stromal optical properties. Reflectance spectra from normal and neoplastic tissue have been measured in vivo and analyzed using both model-based and empirical approaches. Following the approach of Farrell et al.;,41 Zonios et al.; modeled reflectance spectra of colon tissue to extract the hemoglobin concentration, hemoglobin oxygen saturation, and effective scatterer density and size.42 Zonios et al.; found that precancerous areas showed increased hemoglobin concentration and increased effective scatterer size in a pilot study of data from 13 patients. Coppelson et al.;36 developed a fiber optic probe (Polarprobe) to measure cervical tissue reflectance at four wavelengths in the visible and NIR. An empirical algorithm was developed using data from 77 volunteers; the Polarprobe diagnosis agreed with colposcopy and histology in 85–99 of measurements, depending on the tissue type. Nordstrom et al.;43 carried out a clinical trial to examine diffuse reflectance spectroscopy for detection of cervical precancer. They measured spectra from 41 women undergoing a colposcopy with biopsy of suspicious areas. A multivariate algorithm based on the Mahalanobis distance could discriminate normal squamous tissue and a high-grade squamous intraepithelial lesion (HGSIL) with a sensitivity of 82 and a specificity of 67. Other studies have shown that spatially resolved measurements of diffusely reflected light could be used to estimate tissue optical properties in vivo.41 44 45 46 47 It is well known that the depth of tissue penetration changes as the separation between the source and detector fibers is altered.48 In this paper, we explore the utility of spatially resolved reflectance spectra for the detection of cervical precancer in a preliminary analysis of data from a large diagnostic trial of in vivo fluorescence and reflectance spectroscopy with biopsy. 2.Materials and Methods2.1.InstrumentationThe spectroscopic system used to measure reflectance spectra has previously been described in detail elsewhere.49 Briefly, the system consists of three main components: (1) a light source assembly that provides broadband excitation using a xenon arc lamp; (2) a fiber-optic probe that directs excitation light to tissue and collects diffusely reflected light; and (3) an optical assembly with a polychromator. Figure 1 illustrates the system. The probe, illustrated in Figure 2, utilizes nine optical fibers placed in direct contact with the tissue [200 μm diameter, numerical aperture (NA)=0.2 ]. One fiber provides broadband illumination. Eight collection fibers at four different source–detector separations (position 0: 250 μm separation, position 1: 1.1 mm separation, position 2: 2.1 mm separation, position 3: 3.0 mm separation) collect diffusely reflected light. 2.2.Clinical MeasurementsThe study protocol was reviewed and approved by the Institutional Review Boards at the University of Texas M. D. Anderson Cancer Center and the University of Texas at Austin. Women who were 18 years of age or older, were not pregnant, and had been referred on the basis of an abnormal Pap smear were eligible. A health-care provider described the study to eligible patients; written consent was obtained from those agreeing to participate. Patients participating in the study received no incentive. Study participation included a Pap smear and colposcopic examination of the vulva, vagina, and cervix. The cervical smear was obtained using an Ayre’s spatula and a Cytobrush. Smears were routinely processed for clinical evaluation and submitted for Feulgen staining for quantitative evaluation. Human papilloma virus (HPV) testing was performed using hybrid capture and polymerase chain reaction (PCR) for negative specimens. In addition, for premenopausal women who were not on oral contraceptive pills (OCPs), the phase of menstrual cycle at the time of spectroscopic measurement was determined by serum estradiol, progesterone, follicle stimulating hormone (FSH), and lutenizing hormone (LH) levels. Following colposcopic examination, but prior to biopsy, a fiber-optic probe was advanced through the speculum and placed in gentle contact with the cervix. Spectroscopic measurements were obtained from up to two colposcopically abnormal cervical sites, one colposcopically normal cervical site covered with squamous epithelium and; if visible, one colposcopically normal cervical site covered with columnar epithelium. Following spectroscopic measurements, all sites interrogated with the fiber-optic probe were biopsied. Within 2 h of each patient measurement, standard spectra were measured. As a positive control, reflectance spectra were measured from a 1 cm pathlength cuvette containing a suspension of 1.02 μm diam polystyrene microspheres (6.25 vol ) to mimic the optical properties of tissue. As a negative control, reflectance spectra were measured with the probe tip immersed in a large container of distilled water. With the negative control, very low levels of reflectance are expected due to the small index mismatch between the optical fibers and the water. Low signal levels indicated acceptable levels of stray light, dark current, or other sources of background signal. Biopsies were fixed and submitted for permanent section. Four-micron thick sections were stained with hematoxylin and eosin and then Feulgen stained. All routinely stained cytology and pathology specimens were submitted for diagnosis by experienced cytologists and pathologists, who were blinded to the results of the spectroscopy. Two cytologists read each Pap smear, and discrepant cases were reviewed a third time for consensus diagnosis by the study cytopathologist. Also, two pathologists read each biopsy, with discrepant cases reviewed a third time for consensus diagnosis by the study histopathologist. Diagnostic classification categories included normal tissues, HPV infection, grade 1 cervical intraepithelial neoplasia (CIN 1), grade 2 cervical intraepithelial neoplasia (CIN 2), grade 3 cervical intraepithelial neoplasia (CIN 3), and carcinoma in situ (CIS) using standard histopathologic criteria.2 Normal tissue was divided into two categories based on colposcopic impression: normal squamous (SN) epithelium and normal columnar epithelium (CN). LGSILs include HPV and CIN 1 and HGSILs include CIN 2, CIN 3, and CIS. 2.3.Data Processing and Statistical AnalysisThree investigators blinded to the pathologic results reviewed all spectra. Spectra indicating evidence of user or instrument error, such as probe slippage, were discarded from further analysis. To remove the effects of the source spectrum, variations in the illumination intensity, and the wavelength-dependent response of the detection system, we divided tissue spectra by the corresponding spectra measured from the microsphere standard. This normalization was performed at each source–detector separation. While this procedure results in spectra that describe the transport of light in tissue relative to that in microsphere suspension, the transport properties of microspheres are well known and can easily be described using Monte Carlo based models.50 Reflectance data from a single measurement site are represented as a matrix containing calibrated reflectance intensity as a function of source–detector separation position and emission wavelength. Spectra for each of the four positions were column vectors containing 121 intensity measurements corresponding to emission wavelengths from 355 to 655 nm in 2.5 nm increments. Reflectance spectra were then analyzed to determine which source–detector separations contained the most diagnostically useful information to separate each of the different types of tissue found in the cervix. An algorithm to separate each pairwise combination of diagnostic categories was developed and evaluated relative to the gold standard of colposcopically directed biopsy. In comparing all pairs of diagnostic classes, we can determine which categories differ spectroscopically and assess where these differences are greatest. This information can then be used to develop multistep classification algorithms20 to determine the tissue type of an unknown sample based on its reflectance spectrum. Algorithm development consisted of the following steps: (1) selection of the source–detector separations to analyze; (2) data reduction using principal component analysis (PCA); (3) feature selection and classification using Mahalanobis distance with cross validation. Each step is described in detail below. To identify the optimal combination of source–detector separations, we evaluated all possible combinations when taken one, two, three, or four at a time. There were a total of 15 combinations considered—four of one, six of two, four of three, and one of four. Prior to PCA, vectors containing the reflectance spectra for the source–detector separations of interest were concatenated into a single vector. A data matrix was assembled from these vectors, including all measurements from the two diagnostic categories being compared. Eigenvectors of the corresponding covariance matrix were then calculated; those accounting for up to 65, 75, 85, and 95 of the total variance were retained for algorithm development. We denote the fraction of the total variance accounted for as the eigenvector significance level (ESL). For each eigenvector, we calculated a principal-component score for each sample in the data matrix. Classification functions were then formed to assign a sample to one of the two given classes. Classification was based on the Mahalanobis distance, r2, the multivariate measure of the separation of a data point (x) from the mean (xm) of a dataset in n-dimensional space [Eq. (1)]. This distance is given as where Cx is the covariance matrix. The multivariate distance between the measurement to be classified and the means of the two histopathologic categories were calculated, and the sample was assigned to the group it was closest to in multivariate space.The performance of classification depends on the principal-component scores included for analysis. From the available pool of eigenvectors the single principal-component score yielding the best initial performance was identified, then the score that improved this performance most was selected. This process was repeated until performance was no longer enhanced by the addition of principal components, or until all components were selected. The sensitivity and specificity of diagnostic algorithms for each combination of source–detector separations were then evaluated relative to the histopathologic diagnosis. To reduce the risk of overtraining, cross validation was used to estimate algorithm performance. In this process, a single sample from a whole data set is temporarily removed and a classification algorithm is developed using the remaining data. The algorithm is applied to the data held out. Each sample in the data set was held out in turn and the sensitivity and specificity were calculated by comparing the classification result of each sample to histopathologic diagnosis: diseased tissue was taken as the positive sample relative to either squamous or columnar normal tissue and columnar normal tissue was taken as the positive sample relative to squamous normal tissue. Overall diagnostic performance was evaluated as the sum of the sensitivity and specificity. 3.Results3.1.Data SetThe data set consisted of spectra from 324 sites in 161 patients that were deemed adequate. Table 1 indicates the number of measurements within each diagnostic category. Tissue with acute or chronic inflammation or metaplasia was included in the corresponding squamous or columnar normal category. Table 1
3.2.Reflectance SpectraAverage reflectance spectra for each diagnostic category for the four different source–detector separation positions are shown in Figure 3. Each position (0, 1, 2, and 3) corresponds to an increasingly greater source–detection separation, which probes increasingly greater tissue depth. All spectra show valleys due to hemoglobin absorption at 420, 542, and 577 nm. As the source–detector separation increases, the relative level of elastic scattering in the longer wavelengths increases due to the increased penetration depth of light. Average spectra of each diagnostic class differ for all source–detector separations. At all separations, the mean reflectance of squamous normal tissue is most intense; there is gradual decrease in mean reflectance intensity from HPV to CIN 1 to CIN 2 to CIN 3, and the mean reflectance of columnar normal tissue is least intense. The greatest separation between average spectra of different diagnostic classes occurs at position 0. Figure 3Average reflectance spectra by tissue diagnostic classification for different source–detector separations: (a) position 0; (b) position 1; (c) position 2; (d) position 3. Diagnostic classifications: SN=–-–⋅; CN=……; HPV=— — —; CIN 1=—; CIN 2=–––; CIN 3/CIS= — . Error bars indicate ± one standard deviation. Tissue spectra were normalized by standard spectra from a suspension of 6.25 vol polystyrene microspheres (1.02 μm diameter).  3.3.Statistical AnalysisFigure 4 shows the sensitivity and specificity for the best performing combination of one, two, three, and four source–detector separations at an ESL of 65. Results are shown separately for each pairwise combination of diagnostic categories. The diagnostic performance is high when using only a single separation, and does not noticeably increase when data from additional separations are included. The best performance is obtained when discriminating between SN and CN, with sensitivity of 89 and specificity of 77, and CN and LGSIL, with sensitivity of 75 and specificity of 89. It is most difficult to discriminate between SN and LGSIL. Increasing the ESL from 65 to 95 does not result in an increase in performance (Figure 5). Figure 4Sensitivity and specificity for top-performing source–detector separation combinations when taken one, two, three, and four at a time for a given pairwise combination of histopathologic categories at ESL=65. Gray and black bars indicate sensitivity and specificity, respectively. SN=squamous normal, CN=columnar normal, LG=low-grade squamous intraepithelial lesion, HG=high-grade squamous intraepithelial lesion.  Figure 5Sensitivity and specificity for top-performing source–detector separation combinations when taken one, two, three, and four at a time for a given pairwise combination of histopathologic categories at ESL=95. Gray and black bars indicate sensitivity and specificity, respectively. SN=squamous normal, CN=columnar normal, LG=low-grade squamous intraepithelial lesion, HG=high-grade squamous intraepithelial lesion.  Table 2 gives the sensitivities and specificities for the combinations of source–detector separations that yielded the best performance. Many combinations of positions gave equally good results for discrimination between SN and CN and between CN and LGSIL. Positions 0 and 1 appear in all of the optimal combinations for discriminating between tissue types, except for SN vs HGSIL. Table 2
4.DiscussionIn our study of the diagnostic potential of reflectance spectroscopy, we obtained cervical in vivo measurements at four distinct source–detector separation positions. Using Mahalanobis distance classification, we determined which source–detector separations contained the most diagnostically useful information. The results showed the sensitivity and specificity to be high when using a single source–detector separation at the lowest level of eigenvector significance considered, and do not noticeably increase when data from additional separations or ESLs are included. Furthermore, the smaller source–detector separations of positions 0 and 1 appear more frequently than the greater separations of positions 2 and 3 in the positional combinations that performed best. Positions 0 and 1 seem effective for all pairwise discrimination except for SN vs HGSIL. Our results show that HGSIL can be discriminated from squamous and columnar normal tissue with high sensitivity (72 and 72, respectively) and high specificity (81 and 83, respectively). These results indicate slightly lower sensitivity and improved specificity for discrimination of SN vs HGSIL found in Ref. 43 where sensitivity of 82 and specificity of 67 were obtained using analysis of a single reflectance spectrum. Furthermore, we found that LGSIL could be separated from columnar normal tissue with similar high sensitivity (75) and specificity (89); however, discrimination between LGSIL and squamous normal tissue was more difficult using reflectance spectroscopy in this study. In all cases, the specificity associated with reflectance spectroscopy was significantly higher than that previously reported for colposcopy (48), while the sensitivity was somewhat lower than that reported for colposcopy (96).5 The sensitivities and specificities reported for reflectance spectroscopy here are based on leave-one-out cross validation. Ideally, separate training and validation sets should be used to provide unbiased estimates of algorithm performance;51 however, previous work using fluorescence spectroscopy has shown that cross validation provides a good estimate of the performance with a separate validation set.23 Given the single-cell epithelial thickness of columnar tissue, it is not surprising that its mean reflectance intensity is lower than the multilayered squamous tissues at the various normal and dysplastic states. The single-layer epithelium allows more light to reach and be absorbed by hemoglobin in stromal tissue. All other diagnostic classes are multilayered squamous epithelium and, as such, show a stronger mean reflectance intensity, which decreases with progression of disease. This is consistent with the results of Dellas et al.;, who found increased angiogenesis with increased severity of precancer.40 Using a Monte Carlo model of light transport in normal cervical epithelium, we estimate that, at 420 nm, the average penetration depth of photons detected at position 0 is 450 μm and at position 3 is 550 μm. Similarly, at 500 nm, the average penetration depth of photons detected at position 0 is 680 μm and at position 3 is 1180 μm. These simulations assumed an epithelial thickness of 350 μm and values of μs,eptithelium =105 cm −1, μa,eptithelium =3 cm −1, μs,stroma =280 cm −1, μa,stroma =40 cm −1 at 420 nm and μs,eptithelium =82 cm −1, μa,eptithelium =2 cm −1, μs,stroma =230 cm −1, and μa,stroma =4 cm −1 at 500 nm. In these simulations, the anisotropy factor (g) of epithelium and stroma were 0.95 and 0.88, respectively. The NA of the optical fiber was 0.22. The refractive indices of the epithelium and the stroma were assumed to be 1.4. The code was verified with the results of Welch et al.;52 for the two-layer model and with those of Mourant et al.;48 for detector modeling. By keeping track of the photon position in tissue after each scattering event, the maximum depth the photon reaches can be calculated. 5.ConclusionsPreviously, we examined the use of fluorescence spectroscopy alone to discriminate cervical precancer using 340, 380, and 460 nm excitation. We found sensitivity of 79 and specificity of 78 to discriminate HGSIL from all other tissue types.20 This performance is comparable to that found for the pairwise diagnostic-category comparisons performed using reflectance spectroscopy alone in this study. Our previous studies using fluorescence spectroscopy indicate that stepwise diagnostic algorithms are required in order to determine the tissue type of an unknown sample based on its fluorescence spectrum because of the large differences in optical properties of squamous and columnar cervical tissue.20 A parallel strategy for reflectance spectroscopy and the pairwise analysis presented here provide the foundation for this analysis. In a similar analysis, we have examined fluorescence excitation emission matrices (EEMs) also for discrimination of all diagnostic categories.36 It is interesting to note that reflectance spectroscopy gives good performance for discriminating categories where fluorescence alone performs less well. Analogous results were noted in Ref. 43. Thus, fluorescence and reflectance spectroscopy appear to be complementary diagnostic technologies, and future studies should pursue combined analysis. AcknowledgmentsThe authors gratefully acknowledge the contributions of Dizem Arifler (Monte Carlo modeling); the clinical research staff (Christy Whitmore, Joanne Baker, Kim Hagedorn, Christina Amos, Glenda Dickerson, and Patricia Trigo) and nurse colposcopists (Judith Sandella, Alma Sbach, and Karen Rabel); the data managers Nan Earle and Trey Kell; and editor/assistant Stacy Crain. Financial support from the National Cancer Institute (PO1-CA82710) is gratefully acknowledged. REFERENCES
R. J. Kurman
,
D. E. Henson
,
A. L. Herbst
,
K. L. Noller
, and
M. H. Schiffman
,
“Interim guidelines for management of abnormal cervical cytology,”
J. Am. Med. Assoc. , 271 11866
–11869
(1994). Google Scholar
M. T. Fahey
,
L. Irwig
, and
P. Macaskill
,
“Meta-analysis of pap test accuracy,”
Am. J. Epidemiol. , 141
(7), 680
–689
(1995). Google Scholar
M. F. Mitchell
,
“Accuracy of colposcopy,”
Consult. Obst. Gyn. , 6
(1), 70
–73
(1994). Google Scholar
G. A. Wagnieres
,
W. M. Star
, and
B. C. Wilson
,
“In vivo fluorescence spectroscopy and imaging for oncological applications,”
Photochem. Photobiol. , 68
(5), 603
–632
(1998). Google Scholar
N. Ramanujam
,
M. Follen Mitchell
,
A. Mahadevan
,
S. Thomsen
,
A. Malpica
,
T. Wright
,
N. Atkinson
, and
R. Richards-Kortum
,
“Spectroscopic diagnosis of cervical intraepithelial neoplasia (CIN) in vivo using laser induced fluorescence spectra at multiple excitation wavelengths,”
Lasers Surg. Med. , 19 63
–74
(1996). Google Scholar
R. Richards-Kortum
,
R. P. Rava
,
R. E. Petras
,
M. Fitzmaurice
,
M. Sivak
, and
M. S. Feld
,
“Spectroscopic diagnosis of colonic dysplasia,”
Photochem. Photobiol. , 53
(6), 777
–786
(1991). Google Scholar
S. B. Cantor
,
M. Mitchell MD
,
G. Tortolero-Luna
,
C. S. Bratka
,
D. Bodurka
, and
R. Richards-Kortum
,
“Cost-effectiveness analysis of the diagnosis and management of cervical intraepithelial neoplasia,”
Obstet. Gynecol. (N.Y.) , 91 270
–277
(1998). Google Scholar
R. R. Alfano
,
G. C. Tang
,
A. Pradham
,
W. Lam
,
D. S. J. Choy
, and
E. Opher
,
“Fluorescence spectra from cancerous and normal human breast and lung tissues,”
IEEE J. Quantum Electron. , 23
(10), 1806
–1811
(1987). Google Scholar
J. Hung
,
S. Lam
,
J. C. LeRiche
, and
B. Palcic
,
“Autofluorescence of normal and malignant bronchial tissue,”
Lasers Surg. Med. , 11 99
–105
(1991). Google Scholar
K. T. Schomacker
,
J. K. Frisoli
,
C. Compton
et al.;,
“Ultraviolet laser-induced fluorescence of colonic tissue: Basic biology and diagnostic potential,”
Lasers Surg. Med. , 12 63
–78
(1992). Google Scholar
T. Vo-Dinh
,
M. Panjehpour
,
B. F. Overholt
,
C. Farris
,
F. P. Buckley
, and
R. Sneed
,
“In vivo cancer diagnosis of the esophagus using differential normalized fluorescence (DNF) indices,”
Lasers Surg. Med. , 16 41
–47
(1995). Google Scholar
A. Mahadevan
,
M. Mitchell
,
E. Silva
,
S. Thomsen
, and
R. Richards-Kortum
,
“A study of the fluorescence properties of normal and neoplastic human cervical tissue,”
Lasers Surg. Med. , 13 647
–655
(1993). Google Scholar
N. Ramanujam
,
M. Follen Mitchell
,
A. Mahadevan
,
S. Thomsen
, and
R. Richards-Kortum
,
“Fluorescence spectroscopy as a diagnostic tool for cervical intraepithelial neoplasia,”
Gynecol. Oncol. , 52 31
–38
(1994). Google Scholar
N. Ramanujam
,
M. F. Mitchell
,
A. Mahadevan
,
S. Thomsen
,
E. Silva
, and
R. Richards-Kortum
,
“In vivo diagnosis of cervical intraepithelial neoplasia using 337 nm laser induced fluorescence,”
Proc. Natl. Acad. Sci. U.S.A. , 91 10193
–10197
(1994). Google Scholar
N. Ramanujam
,
M. Follen Mitchell
,
A. Mahadevan
,
S. Thomsen
,
A. Malpica
,
T. Wright
,
N. Atkinson
, and
R. Richards-Kortum
,
“Development of a multivariate statistical algorithm to analyze human cervical tissue fluorescence spectra acquired in vivo,”
Lasers Surg. Med. , 19 46
–62
(1996). Google Scholar
N. Ramanujam
,
M. Follen Mitchell
,
M. Mahadevan-Jansen
,
S. L. Thomsen
,
G. Staerkel
,
A. Malpica
,
T. Wright
,
N. Atkinson
, and
R. Richards-Kortum
,
“Cervical precancer detection using a multivariate statistical algorithm based on laser induced fluorescence spectra at multiple excitation wavelengths,”
Photochem. Photobiol. , 6 720
–735
(1996). Google Scholar
K. Tumer
,
N. Ramanujam
,
J. Ghosh
, and
R. Richards-Kortum
,
“Ensembles of radial basis function networks for spectroscopic detection of cervical precancer,”
IEEE Trans. Biomed. Eng. , 45 953
–961
(1998). Google Scholar
U. Utzinger
,
V. Trujillo
,
E. N. Atkinson
,
M. F. Mitchell
,
S. B. Cantor
, and
R. Richards-Kortum
,
“Performance estimation of diagnostic tests for cervical precancer based on fluorescence spectroscopy: Effects of tissue type, sample size, population and signal to noise ratio,”
IEEE Trans. Biomed. Eng. , 46 1293
–1303
(1999). Google Scholar
R. A. Zangaro
,
L. Silveira
,
R. Manoharan
,
G. Zonios
,
I. Itzkan
,
R. Dasari
,
J. Van Dam
, and
M. S. Feld
,
“Rapid multiexcitation fluorescence spectroscopy system for in vivo tissue diagnosis,”
Appl. Opt. , 35
(25), 5211
–5219
(1996). Google Scholar
J. A. Zuclich
,
T. Shimada
,
T. R. Loree
,
I. Bigio
,
K. Strobl
, and
S. Nie
, Lasers Life Sci. , 6 39
–53
(1994). Google Scholar
I. J. Bigio
,
T. R. Loree
,
J. Mourant
et al.;,
“Spectroscopic diagnosis of bladder cancer with elastic light scattering,”
Lasers Surg. Med. , 17
(4), 350
–357
(1995). Google Scholar
L. Perelman
et al.;,
“Observation of periodic fine structure in reflectance from biological tissue: A new technique for measuring nuclear size distribution,”
Phys. Rev. Lett. , 80 627
–630
(1998). Google Scholar
M. L. Harries
,
S. Lam
,
C. MacAulay
,
J. Qu
, and
B. Palcic
,
“Diagnostic imaging of the larynx: Autofluorescence of laryngeal tumors using the helium–cadmium laser,”
J. Laryngol. Otol. , 31
(2–3), 259
–262
(1995). Google Scholar
S. Lam
et al.;,
“Localization of bronchial intraepithelial neoplastic lesions by fluorescence Bronchoscopy,”
Chest , 113
(3), 696
–702
(1998). Google Scholar
S. Lam
,
D. MacAulay
,
J. Hung
,
J. LeRiche
,
A. E. Profio
, and
B. Palcic
,
“Detection of dysplasia and carcinoma in situ with a lung imaging fluorescence endoscope device,”
J. Thorac. Cardiovasc. Surg. , 105
(6), 1035
–1040
(1993). Google Scholar
S. Lam
,
C. MacAulay
, and
B. Palcic
,
“Detection and localization of early lung cancer by imaging techniques,”
Chest , 103 12S
–14S
(1993). Google Scholar
M. Coppleson
,
B. L. Reid
,
V. Skladnev
, and
J. C. Dalrymple
,
“An electronic approach to the detection of precancer and cancer of the uterine cervix: A preliminary evaluation of polar probe,”
Int. J. Gynecol. Cancer , 4 79
–93
(1994). Google Scholar
J. R. Mourant
,
I. Bigio
,
J. Boyer
,
T. Johnson
, and
J. Lacey
,
“Detection of GI cancer by elastic scattering spectroscopy,”
J. Biomed. Opt. , 1 192
–199
(1996). Google Scholar
J. R. Mourant
,
A. H. Hielscher
,
A. A. Eick
,
T. M. Johnson
, and
J. P. Freyer
,
“Evidence of intrinsic differences in the light scattering properties of tumorigenic and nontumorigenic cells,”
Cancer , 84
(6), 366
–374
(1998). Google Scholar
A. Dellas
,
H. Moch
,
E. Schulthesis
,
G. Feichter
,
A. C. Almendral
,
F. Gudat
, and
J. Torhorst
,
“Angiogenesis in cervical neoplasia: Microvessel quantitation in precancerous lesions and invasive carcinomas with clinicopathological correlations,”
Gynecol. Oncol. , 67 27
–33
(1997). Google Scholar
T. J. Farell
,
M. S. Patterson
, and
B. C. Wilson
,
“A diffusion theory model of spatially resolved, steady-state diffuse reflectance for the non-invasive determination of tissue optical properties,”
Med. Phys. , 19 879
–888
(1992). Google Scholar
G. Zonios
,
L. T. Perelman
,
V. Backman
,
R. Manoharan
,
M. Fitzmaurice
,
J. Van Dam
, and
M. S. Feld
,
“Diffuse reflectance spectroscopy of human adenomatous colon polyps in vivo,”
Appl. Opt. , 38
(31), 6628
–6637
(1999). Google Scholar
R. J. Nordstrom
,
L. Burke
,
J. M. Niloff
, and
J. F. Myrtle
,
“Identification of cervical intraepithelial neoplasia (CIN) using UV-excited fluorescence and diffuse-reflectance tissue spectroscopy,”
Lasers Surg. Med. , 29
(2), 118
–127
(2001). Google Scholar
L. Wang
and
S. L. Jacques
,
“Optimized radical and angular positions in Monte Carlo modeling,”
Med. Phys. , 21 1081
–1083
(1994). Google Scholar
L. Wang
and
S. L. Jacques
,
“Use of a laser with an oblique angle of incidence to measure the reduced scattering coefficient of turbid media,”
Appl. Opt. , 34
(13), 2362
–2366
(1995). Google Scholar
S. P. Lin
,
L. Wang
,
S. L. Jacques
, and
F. K. Tittel
,
“Measure of tissue optical properties by the use of oblique-incidence optical fiber reflectometry,”
Appl. Opt. , 36
(1), 136
–143
(1997). Google Scholar
M. G. Nichols
,
E. L. Hull
, and
T. Foster
,
“Design and testing of a white-light, steady-state diffuse reflectance spectrometer for determination of optical properties of highly scattering systems,”
Appl. Opt. , 36 93
(1997). Google Scholar
J. R. Mourant
,
J. Boyer
,
A. H. Hielscher
, and
I. J. Bigio
,
“Influence of the scattering phase function on light transport measurement in turbid media performed with small source detector separations,”
Opt. Lett. , 21
(7), 546
–548
(1996). Google Scholar
A. J. Durkin
,
S. Jaikumar
, and
R. Richards-Kortum
,
“Optically dilute, absorbing, and turbid phantoms for fluorescence spectroscopy of homogeneous and inhomogeneous samples,”
Appl. Spectrosc. , 47
(12), 2114
–2121
(1993). Google Scholar
V. P. Wallace
,
J. C. Bamber
,
D. C. Crawford
,
R. J. Ott
, and
P. S. Mortimer
,
“Classification of reflectance spectra from pigmented skin lesions: A comparison of multivariate discriminate analysis and artificial neural networks,”
Phys. Med. Biol. , 45 2859
–2871
(2000). Google Scholar
A. J. Welch
,
C. Gardner
,
R. Richards-Kortum
,
E. Chan
,
G. Criswell
,
J. Pfefer
, and
S. Warren
,
“Propagation of fluorescent light,”
Lasers Surg. Med. , 21
(2), 166
–178
(1997). Google Scholar
|
|||||||||||||||||||||||||||||||||||||||||||||||||||||||||||||||||||||||||||||||||||||||||||||||||||||||||||||||||||||||||||||||||||||||||||||||||||||||||||||||||||||


CITATIONS
Cited by 175 scholarly publications and 4 patents.
Sensors
Reflectivity
Diagnostics
Tissues
Tissue optics
Reflectance spectroscopy
In vivo imaging


