1.IntroductionOptical technologies provide a promising new approach to real-time, in vivo diagnosis of epithelial precancers, in both the screening and diagnostic settings. A number of groups have examined novel optical approaches, including fluorescence spectroscopy,1 2 3 4 5 reflectance spectroscopy,6 7 8 Raman spectroscopy,9 confocal imaging,10 11 and optical coherence tomography.12 Of these, the largest clinical experience has been reported using fluorescence spectroscopy. Fluorescence spectroscopy for the screening and diagnosis of cervical precancer has demonstrated promising results. Clinical trials show a sensitivity and specificity of 86 and 74 in the diagnostic colposcopy clinic13 and 75 and 80 in the screening setting.14 In both diagnostic and screening settings, peak fluorescence intensity varies by more than an order of magnitude from one patient to another. In an attempt to further improve the sensitivity and specificity of real-time diagnosis, it is necessary to understand and control for the sources of this inter-patient variability. Figure 1 shows how fluorescence intensity can vary in squamous normal tissue of the cervix from one patient to another. Plotted here is the fluorescence intensity at 340 nm excitation, 440 nm emission from a previous series of 50 squamous normal sites from 25 patients.13 Patients are listed in the order of increasing age, and the age of the patients ranges from 18 to 60. In general, the intra-patient variation is less than the inter-patient variation. However, the biological basis for these variations is not well understood. Previous work15 has shown that race and smoking do not account for these variations, while age and menopausal status may play a role. In Figure 1, patients 23, 24, and 25 show a large increase in fluorescence intensity compared to the rest of the patients. It is interesting to note that the patients have ages 49, 50, and 60, respectively, and that patients 24 and 25 are postmenopausal. We are conducting large clinical trials in the diagnostic and screening settings to examine the influence of age on fluorescence spectroscopy. However, it is unknown whether the phase in the menstrual cycle may also play a role. Figure 1Fluorescence intensity measured in vivo from squamous epithelium of the cervix at 340 nm excitation, 440 nm emission from 25 patients from a previous study. Multiple sites from a single patient are linked with lines. The patients are listed in the order of increasing age.  A more thorough understanding of the correlation between the menstrual cycle and fluorescence spectroscopy of the cervix is necessary to explore the inter-patient variation. The goal of the clinical study described in this paper was to examine the variations in the fluorescence spectra throughout the menstrual cycle and to determine the range of effect the menstrual cycle had on the fluorescence of the cervix. 2.Material and Methods2.1.MaterialsThe study protocol was reviewed and approved by the Institutional Review Boards at the University of Texas M. D. Anderson Cancer Center and the University of Texas at Austin. Eligible patients included those over the age of 18 who were not pregnant, who had a history of normal menses, and no history of an abnormal Pap smear. After signing informed consent, all patients underwent a demographic interview, risk factor questionnaire, complete history and physical exam and pan-colposcopy of the vulva, vagina, and cervix; 6 acetic acid was applied during pan-colposcopy. Initially, each patient underwent a urine pregnancy test, chlamydia and gonorrhea cultures, and a Papanicolaou smear. Both the pan-colposcopy and the Papanicolaou smear were performed prior to the first day of the measurement period. Additionally, patients underwent Virapap testing (DiGene, Bethesda, MD) as well as human papilloma virus DNA and mRNA sampling. Initially, each patient had blood drawn for FSH, estradiol, and progesterone levels. The last menstrual period and menstrual history were asked of each patient. The patients were then followed with fluorescence spectroscopy throughout one cycle. Three colposcopically normal sites were chosen by one of the investigators (M.F.) and fluorescence EEMs were measured daily from these three sites. It was noted whether these sites corresponded to squamous or columnar epithelium. Because of the variation between squamous and columnar epithelium and the relatively small number of columnar sites investigated here, in this work we report only results from squamous normal sites. Menstrual bleeding was asked of the patient daily, noted daily by a research nurse, and verified by the nurse practitioner or physician making the measurements. These dates were assigned to the menstrual phase of the cycle. Ovulation was assumed to occur at cycle day 14, with dates preceding the day assigned to the proliferative phase and dates following the day assigned to the secretory phase of the cycle. 2.2.InstrumentationThe spectroscopic system used to measure fluorescence EEMs has been described in detail previously.16 17 Briefly, the system measures fluorescence emission spectra at 16 excitation wavelengths, ranging from 330 to 480 nm in 10 nm increments with a spectral resolution of 5 nm. The system incorporates a fiber optic probe, a xenon arc lamp coupled to a monochromator to provide excitation light, and a polychromator and thermoelectrically cooled charge coupled device camera to record fluorescence intensity as a function of emission wavelength. 2.3.MeasurementsAs a negative control, a background EEM was obtained with the probe immersed in a nonfluorescent bottle filled with distilled water at the beginning of each day. Then a fluorescence EEM was measured with the probe placed on the surface of a quartz cuvette containing a solution of Rhodamine 610 (Exciton, Dayton, OH) dissolved in ethylene glycol (2 mg/mL) at the beginning of each patient measurement. To correct for the nonuniform spectral response of the detection system, the spectra of two calibrated sources were measured at the beginning of the study; in the visible a National Institute of Standards and Technology traceable calibrated tungsten ribbon filament lamp was used and in the ultraviolet a deuterium lamp was used (550C and 45D, Optronic Laboratories Inc, Orlando, FL). Correction factors were derived from these spectra. Dark current subtracted EEMs from patients were then corrected for the nonuniform spectral response of the detection system. Variations in the intensity of the fluorescence excitation light source at different excitation wavelengths were corrected using measurements of the intensity at each excitation wavelength at the probe tip made with a calibrated photodiode (818-UV, Newport Research Corp.). Before the probe was used it was disinfected with Metricide (Metrex Research Corp.) for 20 min. The probe was then rinsed with water and dried with sterile gauze. The disinfected probe was guided into the vagina and its tip positioned flush with the cervical epithelium. Acetic acid, which enhances the fluorescence and the reflectance differences between normal and dysplastic tissue,18 was not applied to the cervical epithelium prior to the placement of the probe. In an initial pilot period, acetic acid was applied daily prior to fluorescence measurement; however after applying for three days, patients experienced discomfort, and significant inflammation was observed colposcopically. When noticeable bleeding is observed, the blood was removed from the measurement site using an alcohol swab immediately before the optical measurement. Then fluorescence EEMs were measured from three predetermined cervical sites. Measurement of each EEM required approximately 2 min. 2.4.Data AnalysisMultidimensional data, such as the EEMs recorded in this study, represent a challenge in biostatistical analysis. To analyze this high dimensional data set, we explored a dimension reduction strategy called principal component analysis (PCA). In PCA, the primary goal is to build linear combinations of the variables that account for as much of the total variance as possible. Successive, uncorrelated linear combinations of the variables are then extracted, which account for successively smaller amounts of the total variance.19 In this study, PCA was applied to the data from the squamous normal sites of each patient. Prior to analysis, emission spectra at each excitation wavelength were cropped to discard the noisy tails and the area under each cropped spectrum was normalized to unity. Then the emission spectra of the EEM matrix were concatenated into a single vector. For each patient, an input data matrix was assembled where the concatenated vector from each squamous normal site at each day was placed as a row. The eigenvectors of the corresponding covariance matrix were then calculated, yielding the principal components for each patient. Principal component scores were computed by projecting the concatenated vectors from each day and each site onto the principal components of the respective patient. Since 2–3 sites were measured from each patient for 30 days, this amounts to a total of 60–90 principal component scores from a principal component of each patient. We calculated two sets of principal components and corresponding principal component scores from different regions of the EEM: one set was calculated from the emission spectra at 340–380 nm excitation, and the other set from those at 410–470 nm excitation, as these two areas correspond to fluorophores associated with epithelial cells, the cofactors NADH and FAD, as well as emission from stromal collagen and elastin. In each set of principal components, we examined the five principal components accounting for the largest portion of the variance and their principal component scores as a function of cycle day. 2.5.ClassificationA diagnostic algorithm was previously developed for the classification of squamous intraepithelial lesion (SIL) and normal cervical tissues based on fluorescence spectra at 340, 380, and 460 nm excitation using Bayesian classifiers.20 Briefly, the algorithm is a two-step algorithm where squamous normal and columnar normal samples, respectively, are classified at each step based on the a posteriori probability of principal component scores. To investigate the effect of the menstrual cycle on diagnostic classification, we trained the algorithm using a data set from a previous study,20 which is composed of 190 samples from squamous normal tissues, 32 samples from columnar normal tissues, 119 samples from SIL. Then the data from the present study were tested with the algorithm. 3.ResultsTen patients enrolled in and completed the study. The patients ranged in age from 26 to 45. All ten patients were pre-menopausal as determined by FSH levels, and nine of ten had ovulatory bleeding by medical history and by estradiol and progesterone levels. One patient (patient 2) had an anovulatory cycle. Nine out of the ten patients had normal Pap smears. One of the ten patients (patient 10), who had a previous history of normal Pap smears, had stage 1 cervical intraepithelial neoplasia (CIN 1)/HPV-associated atypia. Eight of the ten patients participated in a second study and underwent colposcopically directed biopsies on two of the measured sites at the end of the trial. One of these patients displayed colposcopic abnormality and biopsies of all three measured sites were obtained at the end of the trial. Out of the eight patients, seven patients had normal cervical biopsies. The patient who had CIN 1/HPV-associated atypia on her Pap smear had the diagnosis of low grade SIL confirmed in all three biopsies. Each patient underwent fluorescence EEM measurements daily of three sites. For three patients (patient 2, 6, 10), one site was columnar epithelium and two sites were squamous epithelium. For seven other patients, all three sites were squamous epithelium. Figure 2 shows a typical fluorescence EEM from a normal squamous site on cycle day 7. The fluorescence EEM is plotted as a topographical map, with excitation wavelength on the ordinate and emission wavelength on the abscissa. Contour lines connect points of equal fluorescence intensity. Several excitation-emission maxima are present; the peak at 350 nm excitation, 450 nm emission is consistent with emission of the cofactor NADH as well as collagen cross-links. A shoulder at 370 nm excitation, 525 nm emission is consistent with emission of the cofactor FAD. The peak at 450 nm excitation, 525 nm emission is consistent with the cofactor FAD as well as structural protein fluorescence. Fluorescence of endogenous porphyrins is present with excitation maxima at 410 nm and emission maxima at 630 nm. Tissue vascularity can influence fluorescence spectra, when hemoglobin absorbs fluorescent light at 420, 540, and 580 nm, producing valleys in the EEMs parallel to the excitation and emission wavelength axes. Figure 2A typical fluorescence EEM from a squamous normal site on the cervix. NADH/CC, FAD/SP, FAD, P represent peak positions of NADH/cross-linked collagen, FAD/structural protein, FAD and porphyrin, respectively. Dotted lines represent positions for hemoglobin absorption. Scale bar for the intensity values is shown on the right. 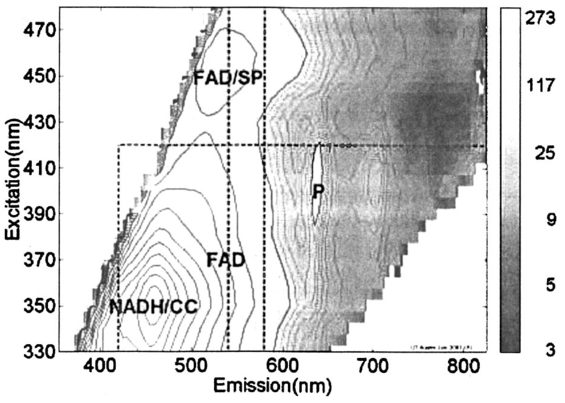 Figure 3 shows how the fluorescence intensity at 340 nm excitation, 440 nm emission varies in ten patients daily throughout the cycle. On average, the fluorescence intensity varies by approximately a factor of 2 within each patient throughout the menstrual cycle. This is much less than the inter-patient variation observed in Figure 1, which reaches a factor of 10. Furthermore, visual examination of the raw data in Figure 3 does not show any obvious correlation between fluorescence intensity and cycle date within a single patient, although the expected level of interpatient variation was present. Figure 3Fluorescence intensity from squamous epithelial cells of the cervix at 340 nm excitation, 440 nm emission daily throughout the cycle in all ten patients. The plots are the mean fluorescence intensity of the three sites measured each day for each patient, and the error bars represent the maximum and the minimum values of the three sites. Blue, green, and red dots represent menstrual, proliferative, and secretory phases of the cycle, respectively. Note that data are plotted against the day of the cycle, which is not necessarily the same as the measurement day. 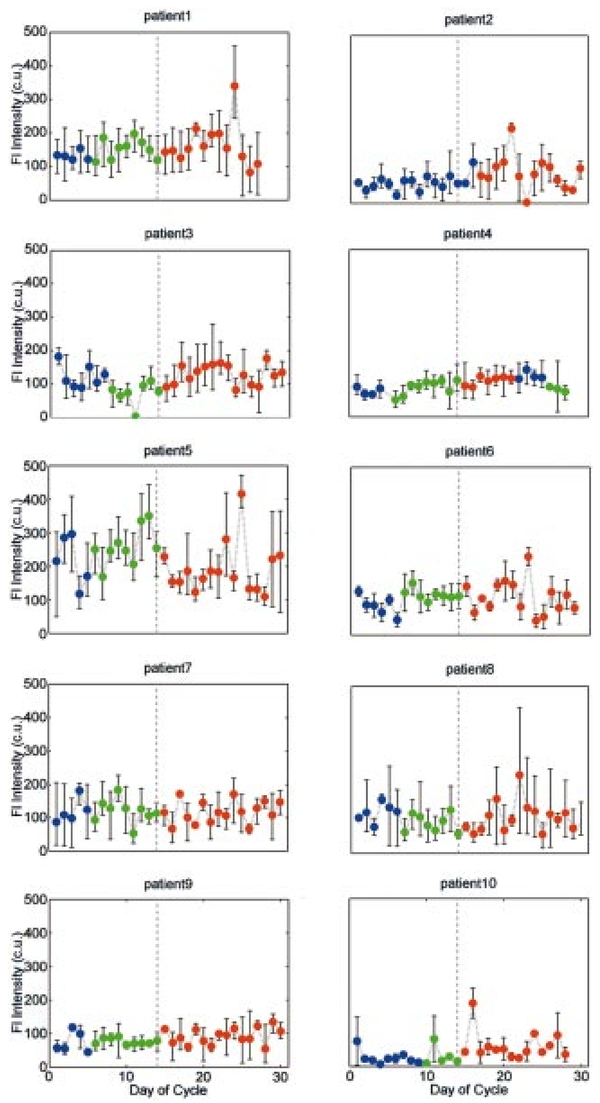 We explored data reduction strategies, which break the data down into linearly independent factors, and then examined whether variation in any of these individual factors correlated with cycle date. Data reduction, using PCA, was carried out in two excitation wavelength regions: 340–380 and 410–470 nm excitation. In the area at 340–380 nm excitation the strongest correlations were observed. In particular, the scores from the second principal component were visually correlated with the day of the cycle for many of the patients. In one patient (patient 9), this correlation was especially strong, indicating that the corresponding principal component described a portion of the EEM that was most strongly correlated with variations in the cycle. For this patient, the second principal component accounted for approximately 16 of the total variance. Using this second principal component, we calculated the corresponding principal component score at each cycle day for each patient. We then explored visual correlation with the day of the cycle. Results are shown in Figure 4. To facilitate the visualization of data, their sequence has been reordered. Data from all the patients are presented from the first day of the menstrual phase to the last day of the measurement. Then, the data from the first day of the measurement to the day before the first day of the menstrual phase is concatenated at the end. Figure 4Principal component scores daily throughout the cycle in all ten patients. The plots are the mean of the three sites at each day, and the error bars indicate the minimum and maximum values among the three sites. Blue, green, and red dots represent menstrual, proliferative, and secretory phases, respectively. Dotted vertical line indicates the day of ovulation (day 14 of the menstrual cycle). Note that data are plotted against the day of the cycle, not necessarily the same as the measurement day.  In order to investigate inherent patterns in the plots, regression analysis was performed using a third order linear fit to the average plot. The linear fit is shown as dark gray curves in each plot of Figure 4. The R2 value, which measures the goodness of each fit, is shown in Table 1. In general, the second principal component score is lowest during the menstrual phase of the cycle, increases throughout the proliferative phase of the cycle, and plateaus during the secretory phase. Table 1
Figure 5 shows the second principal component of patient 9 multiplied by the principal component score at each day of the cycle. For simplicity, the figure shows the principal component corresponding to the emission spectrum at 360 nm excitation. The mean emission spectrum at 360 nm excitation, which is scaled by a factor of 10, is also shown. Note that there are two opposing peaks in the principal component: one peak is in the emission wavelength region from 450 to 480 nm and the other is in the emission wavelength region above 500 nm. The first wavelength region is consistent with the fluorescence peak of the cofactor NADH at 360 nm excitation and 450 nm emission, while the second is consistent with the peak of the cofactor FAD at 360 nm excitation and 525 nm emission. Figure 5The second principal component weighted by the principal component scores of patient 9 at each day in the cycle. The principal component corresponding to emission spectrum at 360 nm excitation is shown. Blue, green, and red plots represent menstrual, proliferative, and secretory phases, respectively. Mean emission spectrum at 360 nm excitation, scaled by 10, is also shown in black.  Figure 6Redox ratio daily throughout the cycle in all ten patients. The plots are the mean of the three sites at each day, and the error bars indicate the minimum and maximum values among the three sites. Blue, green, and red dots represent menstrual, proliferative, and secretory phases, respectively. Dotted vertical line indicates the day of ovulation (day 14 of the menstrual cycle). Note that data are plotted against the day of the cycle, not necessarily the same as the measurement day. 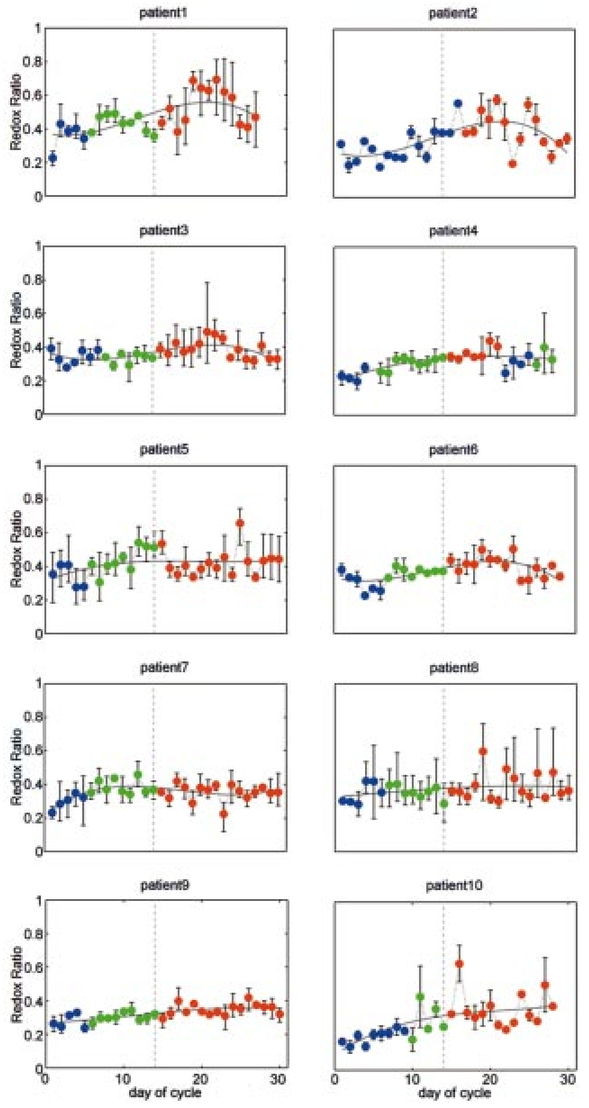 The significance of the fluorescence from the cofactors NADH and FAD in this second principal component suggests that a simpler ratio of fluorescence intensities, known as the redox ratio, may correlate with the day of the cycle. The redox ratio, R, is the ratio of fluorescence intensity at 370 nm excitation, 530 nm emission (FAD) to the sum of intensities at 370 nm excitation, 530 nm emission (NADH) and 370 nm excitation, 450 nm emission (FAD)21 Figure 6 shows the redox ratio throughout the cycle for all ten patients. As in Figure 4, the sequence of data presented in the plots is reordered. Regression analysis using third order linear fit of the average plot was also performed. The R2 value of each fit is shown in Table 1. Like the principal component score shown in Figure 4, the redox ratio is lowest during the menstrual phase of the cycle, increases during the proliferative phase, and then plateaus during the secretory phase.Ramanujam20 reports a sensitivity and specificity of 88 and 68, respectively, using a diagnostic classification algorithm to discriminate SIL from squamous normal cervical tissues. Another measure of algorithm performance is the area under the receiver operator characteristic (ROC) curve.22 Using data from Ref. 20, Utzinger calculated an area under the curve of 0.71 for this algorithm.23 When the algorithm developed in the previous study was applied to the data from this study and the prior probability of disease was adjusted to be 10.2, consistent with the data from this study, specificity was 94.3; this is higher than reported by Ramanujam. There are insufficient data points from biopsy proven SIL to calculate a reliable sensitivity from this study. However, if we assume that all measurements from sites with biopsy proven SIL at the end of the study contained SIL throughout the entire study, we could calculate the area under the ROC curve. We found an area of 0.64, which is comparable to that found previously.23 4.CommentThe results of the PCA (Figure 4) and the analysis of the redox ratio (Figure 6) imply that the metabolic activities of the epithelial cells of the cervix are relatively high during the menstrual and proliferative phases of the cycle and that they are relatively low during the secretory phase.24 These results are consistent with other findings. Ferenczy25 states that in general estradiol 17B stimulates epithelial proliferation and maturation, whereas progesterone prohibits upper midzone maturation in the squamous epithelial cells of the cervix. He also states that estrogen receptors show a relative increase during the follicular phase compared to the luteal phase, suggesting that cell proliferation increases during the follicular phase and decreases during the luteal phase. Gorodeski26 27 investigated the effect of sex steroids on the formation of ectocervical epithelial envelopes, which are a layer of cross-linked protein that forms beneath the plasma membrane during ectocervical cell terminal differentiation. He states that estrogen increases ectocervical epithelial cell differentiation, whereas progestin decreases envelope formation in the ectocervical epithelial cells. Fluorescence spectroscopy for the screening and diagnosis of cervical precancer has already demonstrated promising results, with sensitivities and specificities in the 75–90 range. It should be noted that variations in fluorescence intensity throughout the cycle do not account for the tenfold variation in fluorescence intensity observed between patients. Within a single patient, fluorescence intensity varies by approximately a factor of 2 throughout the cycle. Only 8–16 of this variance appears to be correlated with day in cycle. When the data from the present study are applied to a diagnostic classification algorithm, specificity is well above that reported in literature. Thus, in developing algorithms for cervical precancer based on fluorescence spectroscopy, it does not appear necessary to control for cycle date. Patients can be measured at any point in their cycle and the same diagnostic algorithms can be used. Real-time diagnosis of cervical cancer using fluorescence spectroscopy would provide a great advance in the day-to-day practice of medicine. For developed countries, optical technologies will translate into more cost-effective care by reducing the number of visits and unnecessary biopsies. In developing countries, optical technologies could enable screening programs to be implemented by less trained health care providers. AcknowledgmentsFinancial support was provided by NIH Program Project Award No. CA82710. We gratefully acknowledge the contributions of nurse colposcopists Judy Sandella, Alma Sbach, and Karen Rabel. REFERENCES
R. R. Alfano
,
G. C. Tang
,
A. Pradham
,
W. Lam
,
D. S. J. Choy
, and
E. Opher
,
“Fluorescence spectra from cancerous and normal human breast and lung tissues,”
IEEE J. Quantum Electron. , QE-23 1806
–1811
(1987). Google Scholar
J. Hung
,
S. Lam
,
J. C. LeRiche
, and
B. Palcic
,
“Autofluorescence of normal and malignant bronchial tissue,”
Lasers Surg. Med. , 11 99
–105
(1991). Google Scholar
M. A. Mycek
,
K. T. Schomaker
, and
N. S. Nishioka
,
“Colonic polyp differentiation using time-resolved autofluorescence spectroscopy,”
Gastrointest Endosc , 48 390
–394
(1998). Google Scholar
K. T. Schomacker
,
J. K. Frisoli
, and
C. Compton
,
“Ultraviolet laser-induced fluorescence of colonic tissue: Basic biology and diagnostic potential,”
Lasers Surg. Med. , 12 63
–78
(1992). Google Scholar
N. Ramanujam
,
M. Follen Mitchell
,
A. Mahadevan
,
S. Thomsen
,
A. Malpica
, and
T. Wright
et al.;,
“Development of a multivariate statistical algorithm to analyze human cervical tissue fluorescence spectra acquired in vivo,”
Lasers Surg. Med. , 19 46
–62
(1996). Google Scholar
I. J. Bigio
,
T. R. Loree
, and
J. Mourant
,
“Spectroscopic diagnosis of bladder cancer with elastic light scattering,”
Lasers Surg. Med. , 16 350
–357
(1995). Google Scholar
F. Koenig
,
R. Larne
,
H. Enquist
,
F. J. McGovern
,
K. T. Schomacker
, and
N. Kollias
et al.;,
“Spectroscopic measurement of diffuse reflectance for enhanced detection of bladder carcinoma,”
Urology , 51 342
–345
(1998). Google Scholar
G. Zonios
,
L. T. Perelman
,
V. Backman
,
R. Manahoran
,
M. Fitzmaurice
, and
J. VanDam
et al.;,
“Diffuse reflectance spectroscopy of human adenomatous colon polyps in vivo,”
Appl. Opt. , 38 6628
–6637
(1999). Google Scholar
A. Mahadevan-Jansen
and
R. Richards-Kortum
,
“Raman spectroscopy for the detection of cancers and precancers,”
J. Biomed. Opt. , 1 31
–70
(1996). Google Scholar
M. Rajadhyaksha
,
M. Grossman
,
D. Esterowitz
,
R. H. Webb
, and
R. R. Anderson
,
“In vivo confocal scanning laser microscopy of human skin: Melanin provides strong contrast,”
J. Invest. Dermatol. , 104 946
–952
(1995). Google Scholar
R. A. Drezek
,
T. Collier
,
C. K. Brookner
,
A. Malpica
,
R. Lotan
, and
R. Richards-Kortum
et al.;,
“Laser scanning confocal microscopy of cervical tissue before and after application of acetic acid,”
Am. J. Obstet. Gynecol. , 182 1135
–1139
(2000). Google Scholar
C. Pitris
,
A. Goodman
,
S. A. Boppart
,
J. J. Libus
,
J. G. Fujimoto
, and
M. E. Brezinski
,
“High-resolution imaging of gynecologic neoplasms using optical coherence tomography,”
Obstet. Gynecol. (N.Y.) , 93 135
–139
(1999). Google Scholar
K. Tumer
,
N. Ramanujam
,
J. Ghosh
, and
R. Richards-Kortum
,
“Ensembles of radial basis function networks for spectroscopic detection of cervical precancer,”
IEEE Trans. Biomed. Eng. , 45 953
–961
(1998). Google Scholar
M. F. Mitchell
,
S. B. Cantor
,
C. Brookner
,
U. Utzinger
,
D. Schottenfeld
, and
R. Richards-Kortum
,
“Screening for squamous intraepithelial lesions with fluorescence spectroscopy,”
Obstet. Gynecol. (N.Y.) , 94 889
–896
(1999). Google Scholar
D. L. Heintzelman
,
U. Utzinger
,
H. Fuchs
,
A. Zuluaga
,
K. Gossage
, and
A. M. Gillenwater
et al.;,
“Optimal excitation wavelengths for in vivo detection of oral neoplasia using fluorescence spectroscopy,”
Photochem. Photobiol. , 72 103
–113
(2000). Google Scholar
A. Agrawal
,
U. Utzinger
,
C. Brookner
,
C. Pitris
,
M. Follen Mitchell
, and
R. Richards-Kortum
,
“Fluorescence spectroscopy of the cervix: Influence of acetic acid, cervical mucus, and vaginal medications,”
Lasers Surg. Med. , 25 237
–249
(1999). Google Scholar
N. Ramanujam
,
M. Follen Mitchell
,
A. Mahadevan-Jansen
,
S. L. Thomsen
,
G. Stearkel
, and
A. Malpica
et al.;,
“Cervical precancer detection using a multivariate statistical algorithm based on laser-induced fluorescence spectra at multiple excitation wavelengths,”
Photochem. Photobiol. , 64 720
–735
(1996). Google Scholar
B. Chance
,
B. Schoener
,
R. Oshino
,
F. Itshak
, and
Y. Nakase
,
“Oxidation-reduction ratio studies of mitochondria in freeze-trapped samples,”
J. Biol. Chem. , 254 4764
–4771
(1979). Google Scholar
M. F. Mitchell
,
S. Cantor
,
G. Tortolero-Luna
,
N. Ramanujam
, and
R. Richards-Kortum
,
“ROC curves for fluorescence spectroscopy for the diagnosis of squamous intra-epithelial lesions of the cervix,”
Obstet. Gynecol. (N.Y.) , 93 462
–470
(1999). Google Scholar
U. Utzinger
,
E. V. Trujillo
,
E. N. Atkinson
,
M. F. Mitchell
,
S. B. Cantor
, and
R. Richards-Kortum
,
“Performance estimation of diagnostic tests for cervical precancer based on fluorescence spectroscopy: Effects of tissue type, sample size, population, and signal-to-noise ratio,”
IEEE Trans. Biomed. Eng. , 46 1293
–1303
(1999). Google Scholar
B. Chance
,
“The use of intrinsic fluorescent signals for characterizing tissue metabolic states in health and disease,”
Proc. SPIE , 2679 2
–7
(1996). Google Scholar
G. I. Gorodeski
,
R. L. Eckert
,
W. H. Utian
,
L. Sheean
, and
E. A. Rorke
,
“Retinoids, sex steriods and glucocorticoids regulate ectocervical cell envelope formation but not the level of the envelope precursor, involucrin,”
Differentiation , 42 75
–80
(1989). Google Scholar
G. I. Gorodeski
,
R. L. Eckert
,
W. H. Utian
,
L. Sheean
, and
E. A. Rorke
,
“Cultured human ectocervical epithelial cell differentiation is regulated by the combined direct actions of sex steroids, glucocorticoids, and retinoids,”
J. Clin. Endocrinol. Metab. , 70 1624
–1630
(1990). Google Scholar
|
||||||||||||||||||||||||||||||||||||


CITATIONS
Cited by 30 scholarly publications.
Luminescence
Fluorescence spectroscopy
Cervix
Algorithm development
Diagnostics
Biopsy
Principal component analysis


