1.IntroductionOptical coherence tomography (OCT)1 2 3 is a relatively new noninvasive method for creating two-dimensional (2D) images of internal microstructures of both transparent and highly scattering objects.2 Its spatial resolution ranges from several microns4 to 20–25 μm at depths up to 2–3 mm. Recently OCT is being applied in an increasingly wide range of applications. The main uses of OCT are early diagnostics of diseases of skin and mucous structures,5 6 7 8 9 dentistry,10 11 as well as retinal imaging,12 13 14 monitoring of the state of the eye, and high-precision measurements of intraocular distances in ophthalmology.15 16 17 18 19 20 21 High-precision measurements of the corneal thickness are of great importance for diagnostics of some kinds of eye diseases17 18 and refractive surgery.15 22 23 24 The advantages of OCT in comparison with other methods, e.g., ultrasound ones, for refractive surgery are well known:18 23 24 high resolution, high efficacy, noninvasiveness, and contact free. The authors of Refs. 22 and 23 have used OCT imaging to perform quantitative and qualitative control of the cornea state after laser in situ keratomileusis during several months. Analogous evaluation has been done in Ref. 24 before laser photorefractive keratectomy and immediately after the surgery. The analysis made in these works shows that the difference of the measured ablation depth from the calculated one is 15–25 μm, i.e., 1.5–2D. This means that in situ control of the ablation process with precision better than 8–10 μm, which corresponds to one dimension (1D),25 will strongly improve the quality of correction of eye refraction abnormalities and eliminate errors present in any real surgery. Within the standard approach, OCT resolution is limited to the coherence length, lc, determined as the full width at half maximum (FWHM). This value is usually 10–15 μm. However, knowledge of additional information on the structure of biotissues, e.g., cornea, and on the shape of autocorrelation function can make it possible to overcome this limitation essentially by means of additional digital processing. Currently available OCT setups can measure the cornea thickness with precision up to 4–6 μm17 23 24 at coherence length of 12–15 μm. Besides, the authors of Ref. 18 showed the possibility of measuring the central corneal thickness with submicron precision at lc=15 μm. These works assume that the corneal thickness is the difference between peak centers in A scans normalized to the refractive index. These peaks correspond to the reflection portion of the probing radiation from the air/cornea and cornea/intraocular fluid boundaries. Since the reflected component of the probing radiation is used, the range of precision measurements (better than 10 μm) along the corneal surface is strongly limited. That is why only the central thickness of the cornea was measured in most works. This disadvantage is connected with the limited range of working angles (usually this value does not exceed 0.02 rad) between the probing radiation and the corneal normal line. However, high-precision measurements of the profile of removed material depth are of great importance for obtaining detailed information on refractive properties of the cornea and, consequently, the whole optical system of the eye. In Ref. 24 the above method was used for corneal regions close to the center. But an increase in the transverse range was achieved only as a result of postoperative flattening of the anterior corneal boundary in myopia correction. When hyperopia is corrected, curvature of the anterior corneal boundary becomes only greater, and the above method cannot be applied. The authors of Ref. 18 suggest that the profile of cornea thickness can be found by moving the eye and fixing each of its new positions by means of a movable light source. This method cannot be used to monitor refraction surgery since the eye orientation changes relative to the ablating radiation. Thus, the use of the reflected component of the probing light for corneal thickness profile determination during refractive surgery seems to be rather complicated. To broaden the range of working angles between the probing radiation and the corneal normal line, it is possible to use light backscattered from the biotissue. The utilization of scattering properties of the cornea enables measurements along the whole corneal surface. In this case, a higher SNR provides higher precision of corneal thickness measurements. In this paper a way of in situ control of laser ablation processes for correction of eye refractive anomalies based on OCT technique with subsequent computer processing of tomograms is suggested. To obtain and process tomograms only the light component backscattered from the cornea is used. In this approach the reflected component of the probing light is extraneous; therefore, proper measures have to be taken to avoid this component. The backscattered component is characterized by low OCT signal in comparison with the reflected one and can be comparable with the noise level. To increase SNR and, consequently, the reliability of determination of scattering layer borders, the two-dimensional Fourier filtering of tomograms is suggested. To determine the profile of the removed layer thickness with proper precision specially designed algorithms, insensitive to insignificant reflex tremors of the eye, are proposed. Model experiments on in situ monitoring of the ablation process of a lavsan film and a human cornea ex vivo have been conducted. The experimental results are analyzed in this paper. The precision of corneal thickness measurements in preliminary in vivo experiments is estimated. 2.Materials and Methods2.1.Description of the Experimental SetupExperiments on in situ monitoring of the ablation process were made on the experimental setup schematically shown in Figure 1. This setup is based on the scheme described in Ref. 26. Radiation from an ArF excimer laser with a wavelength of 193 nm was used to ablate objects under study. Pulse repetition rate was 10 Hz with fluence of 130 mJ/cm2 in order to minimize damage of biotissues. This laser setup created at the Institute of Laser Physics, SD RAS (Novosibirisk, Russia) is described in more detail in earlier papers.27 28 The ablation process was monitored using a compact (40×40×15 cm) whole-fiber OCT device created at the Institute of Applied Physics, Russian Academy of Science (Nizhny Novgorod, Russia).2 A turning mirror directs low-coherence radiation of the OCT device with the central wavelength in vacuum of 0.822 μm and the coherence length of 18 μm to the object. Power, delivered onto the object under investigation, was 160–200 μW. The low-coherence radiation is matched optically with the UV radiation of the excimer laser by means of a dichroic mirror. The image of the end of the anisotropic single-mode fiber in the signal arm of the tomograph is transposed to the cornea with magnification G=5 by means of a specially designed lens. The end of the optical fiber and, correspondingly, the focused probing radiation are moved transversely over the cornea surface by an optomechanical system29 controlled by a personal computer. The diameter of the ablating radiation at the focusing point of the tomograph was 5 mm. Parallel to the ablation, tomograms of the sample obtained by the OCT device were displayed on computer monitor and numerically processed. The results of the processing were also displayed without interruption of the 2D imaging of the object. The acquisition time of one tomogram (200×200 pixels) was 4 s, and processing took less than a second for a Pentium 233 MHz. About 0.25 μm of substance was removed by one pulse of the excimer laser. Thus, when the pulse repetition rate was 10 Hz, we could trace the changes in the substance in situ with a step of about 10 μm. 2.2.MaterialsObjects studied in the experiments were a lavsan film, a human eye ex vivo, and a human cornea in vivo. Ex vivo materials were extracted from a corpse a few hours after the death and were stored in a cooled metal container with entoptic fluid on its bottom. The experiments were performed 4–5 h after such extraction. Volunteers enrolled in the in vivo experiments were aware of the safety conditions of the methods used in details. Experiments with all materials were performed on one and the same setup; however, during in vivo experiments the ablating UV laser was turned off. 2.3.Method of Calculating the Profile of the Removed Layer Thickness and Maximum Ablation DepthOCT measurements with precision over the coherence length require knowledge of a priori information on tissue structure. Assuming that the object being investigated is almost homogeneous, its thickness ranging from a few coherence lengths to 1–1.5 mm, the attenuation of the interferometric signal with depth may obey the exponential law. So, for a single A scan the behavior of the interferometric signal after its detection at the Doppler frequency with the longitudinal coordinate is expected to be the following: in the air before cornea and in the intraocular liquid after cornea there is only noise component which is fluctuating near the constant, while in the cornea the signal is exponentially attenuated. Because the exponentially attenuated data represent a very wide range of values (up to 35–40 dB) the common way of building the OCT signal is logarithmic compression of interferometric data. Taking into account that the logarithm of constant is another constant and the logarithm of exponential function is a linear function, each longitudinal scan (A scan) of the OCT signal S(z) can be approximated with the piecewise linear function f(z,a,c), where z is the longitudinal coordinate (into the medium) normalized to the refractive index, a is an unknown thickness of the medium, and c is the complete set of parameters required for determination by the approximating function. An example of dependencies of a single A scan S(z) and its approximating function f(z,a,c) on the longitudinal coordinate is shown in Figure 2. The horizontal areas of the function correspond to the air and intraocular fluid of the eye, i.e., where the OCT signal has only a noise component. The middle part of the function corresponds to linear attenuation of the OCT signal in the cornea. For every longitudinal scan among the given set of parameters (a,c) there are those that in the best way approximate S(z) with the function f(z,a,c). As an approximation measure, we used the following root-mean-square deviation where L is the longitudinal size of the tomogram. In this case, the argument of the global minimum was taken as the sought-for medium thickness, a*. The sought-for parameters in formula (2) are assumed to be in a certain range. This range should cover all variations possible in practice. For example, most of the human cornea thickness lies between 450 and 650 μm.Figure 2An example of approximation of a single OCT longitudinal scan S(z) by the piecewise linear function f(z,a,c). a*, c *=(c1 *,c2 *,…cn *) are the parameters corresponding to the minimum of the root-mean-square deviation. a* -is assumed as corneal thickness.  Repeating operation (2) for each A scan in the tomogram one can study the thickness profile of the investigated object, since the 2D image (B scan) consists of a series of A scans (in this case, 200 scans) obtained at successive transverse positions. The thickness profile of removed layer is determined as a difference between the thickness profile of nonmodified cornea (before ablation) a0 *(x) and the current value a*(x) It should be noted that these measurements are insensitive to reflex tremors of the eye since the average velocity of the tremors is less than the in-depth scanning velocity, which in our experiments amounts to 0.18 m/s. By the profile Δa(x) the characteristics of the ablation process can be found, the most important among which is the maximum ablation depth Δa max . This characteristic can be found when The described algorithms for determination of thickness profile and maximum thickness of the removed layer are sensitive to SNR on tomograms. The less the SNR the less the range of parameters where the algorithm finds the cornea thickness correctly. If at the particular SNR the algorithm correctly gives the cornea thickness profile for most of the human cornea range, we find it reliable. Since the cornea is a low-scattering object, the SNR does not exceed 10 dB in these experiments. To increase the reliability and precision of this method, approaches based on optimization of both an optical system and numerical algorithms were used. 2.4.Methods for Increasing the Reliability of Determination of the Thickness Profile and Maximum Ablation DepthOptical methods rely on (a) elimination of aberrations of a lens system which lower the level of useful signal, and (b) avoiding of reflected component of probing radiation which, if in the receipt system, leads to a considerable deviation of an OCT signal from the modeled one. However, these may not be enough for reliable determination of the removed layer profile. Therefore, along with optical methods, it is suggested that one use numerical algorithms. (c) Suppression of speckles30 based on Fourier filtration of 2D images enables a significant increase in SNR. (d) An error in calculation of maximum ablation depth by formula (4) coincides with error of determination of the removed layer profile (3). Nevertheless, sometimes Δa max may be calculated as an integral characteristic of the removed layer profile, the calculation precision being much higher in this case. 2.4.1.Optimization of the Optical SystemAberrations present in the optical system transposing an image of the fiber end on the cornea result in blurring of a focal spot and hence in a decrease in the amplitude of a mode excited in the fiber during reception of a backscattered signal. The aberrations were eliminated by means of computer optimization of lens parameters and distances between lenses, taking into account magnification of the optical system G, which had its optimal value. Magnification must be such that (1) the diameter of the probing beam changes only insignificantly in the depth of the object, which may be achieved when the Rayleigh length RL is more than the thickness of object under study a*:RL=k0⋅n⋅(G⋅d)2⩾a*, where k0 is the wave number in vacuum, n is the refractive index of the medium, d is the diameter of fiber mode; and (2) since backscattered light is characterized by a very broad diagram, the fiber receipt from different depths must cover an as large as possible range of angles φ of backscattered light. A beam scattered at angle φ from a point on the central optical axis situated at a distance l from the focal plane feeds mode in fiber if (a) it falls in the fiber aperture, which can be achieved when φ<φ1=NA/2G, and (b) it falls on the fiber at an angle that does not exceed its numerical aperture, which is achieved when φ<φ2=d⋅G/2l. It is clear that the largest range of angles φ at signal receipt from different depths is obtained when the focusing plane is in the center of the cornea. Assuming the following parameters NA=0.15, d=4 μm, n=1.38 is the refractive index of cornea,17 optimal values of the magnification of the optical system are 4–7, depending on thickness of the object (200–800 μm). 2.4.2.Avoiding the Reflected ComponentIt is seen from Figure 2 that fitting of the OCT signal may be made even if it does not have any expressed peaks associated with reflection from the anterior and posterior boundaries of the medium. Moreover, for the described methods these peaks are parasitic since they considerably complicate the shape of the OCT signal, therefore complicating the form of fitting function and increasing the calculation time. For the reflected component of incident radiation not to excite the fiber mode, the tested medium must be scanned at an angle to its normal exceeding φ=min{φ1/2,φ2/2}. At NA=0.15, G=5, a*=600 μm, d=4 μm the angle φ is 0.0085 rad. 2.4.3.Fourier FiltrationThe major amount of backscattered light is speckled one in OCT signal. In case of single scattering as well as multiple scattering, the typical spatial scale in both directions (in-depth and perpendicular directions) of the speckles is about the coherence length lc or less. This means that on the spatial-frequency plane (kx,ky) of the B scan the Fourier image of speckles modulation is located mostly in the diagonal part with the spatial-frequency scale not less than 1/lc. In the presented technique we are interested in the thickness of the medium under study a*, i.e., size of the speckles envelope. Under the condition of the homogeneity of the medium the spatial scale of this envelope is equal to its size. This means that the frequency scale of the Fourier image of speckles envelope is far less than of the speckles modulation 1/a*≪1/lc. Moreover, if we suppose that the in-depth scale of the object being studied is far less than the perpendicular one, Fourier harmonics of the speckles envelope are located not in the diagonal part of the frequency plane but rather in the peripheral ones. In summary, the low-frequency filtration of the OCT image will substantially decrease the speckle modulation amplitude, thus providing higher SNR. The low-frequency filtration can be carried out by applying a Fourier mask with reducing spatial harmonics from low frequencies to the highest. Such a procedure will not disturb the shape of speckles envelope, but will decrease the sharpness of the boundaries’ detection (as can be clearly seen from the results). Bearing in mind that the in-depth scale of the object under study is much less than its perpendicular scale, the effect of boundary blurring at low-frequency filtering can be considerably reduced. To achieve this, the spatial harmonics should be suppressed with the Fourier mask much stronger in the diagonal rather than in the peripheral part. Based on this reasoning, as well as on considerations of analyticity, we chose the following function as the Fourier mask: where r and ϕ are polar coordinates on frequency plane, Δϕ(ϕ) is the width of Gaussian curve (5) depending on the polar angle ϕ Δr is the characteristic scale of the mask M(r,ϕ) over radius, Δϕ is the lobe width, ϕ0 is the angular shift of the lobes from the central line ϕ=π/4, α is the depth of angular modulation. An example of the mask (5) with empirically chosen parameters Δr, Δϕ, ϕ0, and α is shown in Figure 3. In Figure 4, longitudinal scans of ex vivo cornea before Fourier filtration and after it are shown. This figure illustrates that speckles can be considerably suppressed while the shape of the useful signal is nearly not disrupted.Figure 3Fourier mask for suppression of the speckles spatial harmonics; r, ϕ-are the polar coordinates. White dotted line roughly shows the border of the speckle harmonics location. Zero spatial harmonic corresponds to the r=0.  Figure 4Example of a longitudinal scan with Fourier filtration (bold line) and without it (thin line). Both scans were taken from the images on Figures 7b and 7a correspondingly and brought to the same noise level.  Figure 7In situ monitoring of the ablation process of ex vivo human cornea. Tomogram (a) is an OCT image of the nonmodified cornea without Fourier filtration and (b)-with Fourier filtration. On the left of (c) and (d) Fourier-filtered OCT images of UV ablated cornea on depths of 31 and 91 μm correspondingly are shown. On the right of (c) and (d) the computed profile of ablated corneal thickness (thin lines) and their parabolic approximations (bold lines) are shown. 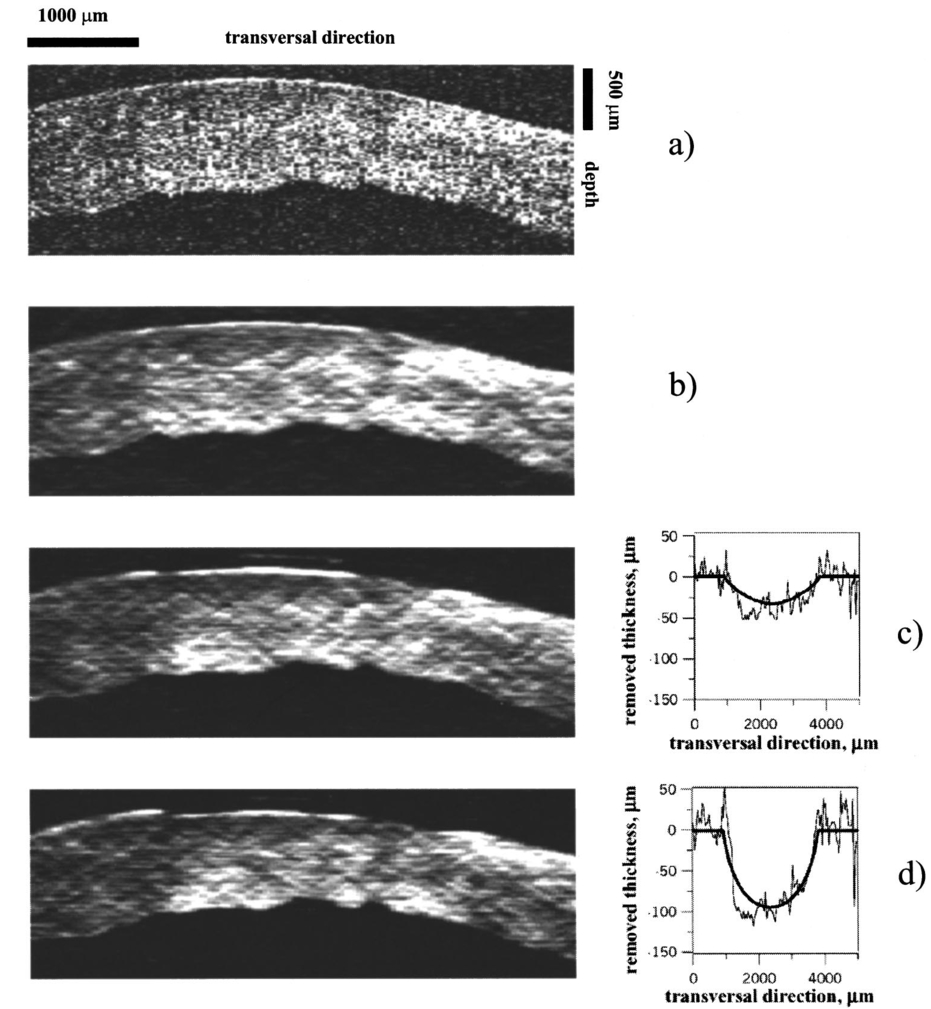 2.4.4.Determination of Maximum Ablation Depth by Approximating the Removed Layer Profile by a Given FunctionIf we know the ablating beam profile and, respectively, the form of the layer removed from the cornea, then we may use additional integral characteristics of the function Δa(x) as Δa max [Eq. (3)]. For example, in case of myopia laser correction the transverse profile of the removed layer is well approximated by a parabola in the ablation place (Figure 5) where x is the transverse coordinate, A,B,C are parameters required for determination of parabola, x1,2(A,B,C) are transverse coordinates corresponding to the borders of the ablation zone. Parameters of the parabola are determined by the condition of the smallest root-mean-square deviation from the profile Δa(x) In this case the following relation gives maximum ablation depthFigure 5Determination of the profile of the removed corneal thickness vs transversal coordinate simultaneously with the ablation process: (a)-computed corneal thickness before (bold line) and during (thin line) the ablation process; (b)-removed thickness profile (thin line) computed as the difference between the corneal thickness before and during the ablation process and its approximation with parabolic profile (bold line), Δa max -is a maximum ablation depth.  Since the quantity of Eq. (9) is an integral characteristic of the function Δa(x), the precision of its determination is much higher than of Eq. (4). 3.ResultsA series of experiments was conducted to demonstrate the feasibility of in situ monitoring of ablation processes in the setup schematically shown in Figure 1. In these experiments ablation objects were a 170 μm lavsan film whose scattering and absorption parameters are close to those of the cornea, and a human cornea ex vivo. Also, preliminary in vivo measurements of human cornea thickness were carried out. For these measurements we optimized the optical system, i.e., aberrations of the lens system were eliminated and the reflected component of incident radiation was avoided. Before these optimizations it had been impossible to determine borders of the scattering layer by any method available because of the high level of light associated with reflection from the air/scattering medium boundary and a low backscattered signal on OCT images. Results of the experiments are summarized in Table 1. Using the algorithms described above we calculated the thickness profile of the object by formula (2), the thickness profile of a removed layer by formula (3), and maximum ablation depth by formula (9). The results were obtained with or without Fourier filtration with mask [Eq. (5)]. The calculation time for one tomogram, including one-time indication of results, was not more than 1 s (Pentium 233c). Table 1
The control for ablation processes in the lavsan film and human cornea ex vivo is illustrated in Figures 6 and 7, showing tomograms of objects in different states: before ablation, after ablation, and in some intermediate state. We believe that the irregularities of the posterior corneal boundary are due to after-death ischemia resulting in damage of the endothelium and the reaction of descemet’s membrane appearing as deformation of the corneal posterior boundary. Borders of the scattering layer are defined on these tomograms. Corresponding plots represent dependencies of the thickness of the removed layer and its parabolic approximation on the coordinate which is transverse to a scanning beam. Figure 8 illustrates the determination of human corneal boundaries on a tomogram in the preliminary in vivo experiment. On this tomogram reflex tremors of the eye are clearly seen, but in these methods they do not lead to errors in measurements of the corneal thickness. Figure 6In situ monitoring of the ablation process of 170 μm lavsan film. Tomogram (a) is an OCT image of nonmodified lavsan film. Tomogram on the left of (b) is an OCT image of UV ablated film on depths of 70 μm. White lines on the images are corresponding to the computed boundaries of the film. On the right of (b) the computed profile of ablated lavsan film thickness (thin line) and its parabolic approximation (bold line) are shown.  Figure 8In vivo OCT images of human cornea (a)-without Fourier filtration, (b)-with Fourier filtration.  The objects were scanned several times to determine precision of the method in each state. By different realizations of the OCT signal quantities SD1 and SD2 were determined, i.e., the root-mean-square deviations from average values of the thickness of the object found by formula (2) in some fixed point, and from an average maximum ablation depth found by formula (9). Values of these quantities were taken to be accuracies of corresponding measurements. Based on the results summarized in Table 1 the following conclusions may be drawn.
Measurement precision during in vivo experiments is higher than in ex vivo experiments by 1.5–2 times, which is certainly very promising for application of the suggested methods. We suppose that the higher precision during in vivo experiments is due to endothelium damage resulting in corneal swell. The change in hydration results in an increase of speckle noise level during ex vivo experiments. 4.DiscussionIn our experiments ablation was performed by a UV laser with a wide beam. By means of special masks the beam gets a certain intensity distribution along the coordinate which is transverse to the direction of beam propagation. The initial distribution remains fixed during ablation. This fact allowed us to use integral characteristics of removed layer thickness profile as a criterion for ablation depth. In particular, for determination of maximum ablation depth during myopia, correction formula (9) was used. The determination precision of the integral characteristics is very high, being in this case (as shown in Table 1) 0.3–5 μm, depending on SNR. This is quite sufficient for refraction surgery. The integral characteristics of the removed layer thickness profile may also be used for monitoring of the process of hyperopia correction, but in this case formulas (7) and (9) should be slightly modified because branches of the approximating parabola will be downwards instead of upwards. Note that this method of corneal ablation does not allow elimination of high-order aberrations because the ablating beam profile remains constant during the whole operation. Flying-spot technology31 32 33 used in refractive surgery can change the distribution of time-average density of radiation power on the cornea in the process of ablation. However, for such a correction high-precision monitoring of the entire surface of the cornea is required. To the best of our knowledge, currently there are no technologies available that would allow such monitoring. If for this purpose we use the method described here, then its precision will be determined by the precision of measurements of removed layer thickness for each A scan. This precision is much lower than that of integral characteristics, being, as shown in Table 1, in experiments with lavsan film and ex vivo cornea as small as 5–30 μm, depending on SNR. The measurement precision may be increased to a required one by the following ways. Model experiments with lavsan film showed that the precision of the suggested method may be further enhanced by increasing SNR. One of the ways here is further optimization of the optical system of the signal arm. Another way is to increase the power of radiation incident on the cornea. For the wavelength of 0.822 μm this way does not work because a maximum allowable value of this power is 0.22 mW.17 18 However, at a wavelength of 1.3 μm the safe power for the eye is 15 mW,19 which is more than 50 times as great as for the 0.822 μm wavelength. As has been demonstrated in papers,15 18 an increase in the precision of determination of the corneal thickness is directly proportional to a decrease in the source coherence length. In this work the autocorrelation function width was 18 μm at a central wavelength of 0.822 μm. Currently, commercially available at this wavelength as well as at the 1.3 μm wavelength are sources with coherence length not less than 10 μm. Thus, with such sources one may expect a double increase in measurement precision at the same SNR. It should be noted that in this work accuracies of measured values summarized in Table 1 were determined only by several realizations of OCT signal. For more reliable values of the accuracies, independent measurements by other methods are needed. If such experiments reveal considerable (i.e., more than allowable error) deviations in values of the measured quantities, formula (2) for determination of the scattering layer thickness must be appropriately modified. 5.ConclusionBased on the experiments we performed and the analysis of obtained results, we may conclude that the use of the scattered light component for in situ monitoring of ablation processes by OCT technique seems to be more promising in some applications compared with the use of the reflected component. We believe that after some optimization of our experimental setup we will be able to achieve the required measurement precision for monitoring of ablation processes with flying-spot technology. AcknowledgmentsThe authors are grateful to V. A. Kamensky, N. M. Shakhova, and L. S. Dolin for useful advice and fruitful discussions during the preparation of the paper. This work was partly supported by the Russian Foundation for Basic Research (Grant No. 00-02-16411). REFERENCES
D. Huang
,
Wang
,
C. P. Lin
,
J. S. Shuman
,
W. G. Stinson
,
W. Chang
,
M. R. Hee
,
T. Flotte
,
K. Gregory
,
C. A. Puliafito
, and
J. G. Fujimoto
,
“Optical coherence tomography,”
Science , 254 1178
–1181
(1991). Google Scholar
V. M. Gelikonov
,
G. V. Gelikonov
,
R. V. Kuranov
,
K. I. Pravdenko
,
A. M. Sergeev
,
F. I. Feldchtein
,
Ya. I. Khanin
,
D. V. Shabanov
,
N. D. Gladkova
,
N. K. Nikulin
,
G. A. Petrova
, and
V. V. Pochinko
,
“Coherent optical tomography of microscopic inhomogeneities in biological tissues,”
JETP Lett. , 61 158
–162
(1995). Google Scholar
A. Fercher
,
“Optical coherence tomography,”
J. Biomed. Opt. , 1 157
–173
(1996). Google Scholar
W. Drexler
,
U. Morgner
,
F. X. Kartner
,
C. Pitris
,
S. A. Boppart
,
X. D. Li
,
E. P. Ippen
, and
J. G. Fujimoto
,
“In vivo ultrahigh-resolution optical coherence tomography,”
Opt. Lett. , 24 1221
–1223
(1999). Google Scholar
J. M. Schmitt
,
M. J. Yadlovsky
, and
R. F. Bonner
,
“Subsurface imaging of living skin with optical coherence microscopy,”
Dermatology , 191 93
–98
(1995). Google Scholar
A. M. Sergeev
,
V. M. Gelikonov
,
G. V. Gelikonov
,
F. I. Feldchtein
,
R. V. Kuranov
,
N. D. Gladkova
,
N. M. Shakhova
,
L. B. Snopova
,
A. V. Shakhov
,
I. A. Kuznetzova
,
A. N. Denisenko
,
V. V. Pochinko
,
Yu. P. Chumakov
, and
O. S. Streltzova
,
“In vivo endoscopic OCT imaging of precancer and cancer states of human mucosa,”
Opt. Express , 1 432
–440
(1997). Google Scholar
F. I. Feldchtein
,
G. V. Gelikonov
,
V. M. Gelikonov
,
R. V. Kuranov
,
A. M. Sergeev
,
N. D. Gladkova
,
A. V. Shakhov
,
N. M. Shakhova
,
L. B. Snopova
,
A. B. Terent’eva
,
E. V. Zagainova
,
Yu. P. Chumakov
, and
I. A. Kuznetzova
,
“Endoscopic applications of optical coherence tomography,”
Opt. Express , 3 257
–269
(1998). Google Scholar
N. D. Gladkova
,
G. A. Petrova
,
N. K. Nikulin
,
S. G. Radenska-Lopovok
,
L. B. Snopova
,
V. A. Nasonova
,
G. V. Gelikonov
,
V. M. Gelikonov
,
R. V. Kuranov
,
A. M. Sergeev
, and
F. I. Feldchtein
,
“In vivo optical coherence tomography imaging of human skin: norm and pathology,”
Skin Res. Technol. , 6 6
–16
(2000). Google Scholar
C. Pitris
,
C. Jesser
,
S. A. Boppart
,
D. Stemper
,
M. E. Brezinski
, and
J. G. Fujimoto
,
“Feasibility of optical coherence tomography for high-resolution imaging of human gastrointestinal tract malignancies,”
J. Gastroenterol. , 35 87
–92
(2000). Google Scholar
F. I. Feldchtein
,
G. V. Gelikonov
,
V. M. Gelikonov
,
R. R. Iksanov
,
R. V. Kuranov
,
A. M. Sergeev
,
N. D. Gladkova
,
M. N. Ourutina
,
J. A. Warren
, and
D. H. Reitze
,
“In vivo OCT imaging of hard and soft tissue of the oral cavity,”
Opt. Express , 3 239
–250
(1998). Google Scholar
B. W. Colston
,
U. S. Sathyam
,
L. B. Da Silva
,
M. J. Everett
,
P. Stroeve
, and
L. L. Otis
,
“Dental OCT,”
Opt. Express , 3 230
–238
(1998). Google Scholar
M. R. Hee
,
J. A. Izatt
,
E. A. Swanson
,
D. Huang
,
C. P. Lin
,
J. S. Schuman
,
C. A. Puliafito
, and
J. G. Fujimoto
,
“Optical coherence tomography of the human retina,”
Arch. Opthalmol. , 113 326
–332
(1995). Google Scholar
C. A. Puliafito
,
M. R. Hee
,
C. P. Lin
, et al.;,
“Imaging of macular diseases with optical coherence tomography,”
Ophthalmology , 120 217
–229
(1995). Google Scholar
T. Fukuchi
,
K. Takanashi
,
H. Ida
,
K. Sho
,
M. Matsumura
,
“Staging of idiopathic choroidal neovascularization by optical coherence tomography,”
Graefe's Arch. Clin. Exp. Ophthalmol. , 239 424
–429
(2001). Google Scholar
C. K. Hitzenberger
,
“Measurement of corneal thickness by low-coherence interferometry,”
Appl. Opt. , 31 6637
–6642
(1992). Google Scholar
A. F. Fercher
,
C. K. Hitzenberger
,
W. Drexler
,
G. Kamp
, and
H. Sattmann
,
“In vivo optical coherence tomography,”
Am. J. Ophthalmol. , 116 113
–114
(1993). Google Scholar
J. A. Izatt
,
M. R. Hee
,
E. A. Swanson
,
C. P. Lin
,
D. Huang
,
J. S. Schumann
,
C. A. Puliafito
, and
J. F. Fujimoto
,
“Micrometer-scale resolution imaging of the anterior eye in vivo with optical coherence tomography,”
Arch. Ophthalmol. , 112 1584
–1589
(1994). Google Scholar
W. Drexler
,
A. Baumgartner
,
O. Findl
,
C. K. Hitzenberger
,
H. Sattmann
, and
A. F. Fercher
,
“Submicrometer precision biometry of the anterior segment of the human eye,”
Invest. Ophthalmol. Visual Sci. , 38 1304
–1313
(1997). Google Scholar
M. Bechmann
,
M. J. Thiel
,
B. Roesen
,
S. Ullrich
,
M. W. Ulbig
, and
K. Ludwig
,
“Central corneal thickness determined with optical coherence tomography in various types of glaucoma,”
Br. J. Ophthalmol. , 84 1233
–1237
(2000). Google Scholar
S. Radhakrishnan
,
A. M. Rollins
,
J. E. Roth
,
S. Yazdanfar
,
V. Westphal
,
D. S. Bardenstein
, and
J. A. Izatt
,
“Real-time optical coherence tomography of the anterior segment at 1310 nm,”
Arch. Ophthalmol. , 119 1179
–1185
(2001). Google Scholar
Y. W. Feng
,
J. Varikooty
, and
T. L. Simpson
,
“Diurnal variation of corneal and corneal epithelial thickness measured using optical coherence tomography,”
Cornea , 20 480
–483
(2001). Google Scholar
C. Ustundag
,
H. Bahcecioglu
,
A. Ozdamar
,
C. Aras
,
R. Yildirim
, and
S. Ozkan
,
“Optical coherence tomography for evaluation of anatomical changes in the cornea after laser in situ keratomileusis,”
J. Cataract Refractive Surg. , 26 1458
–1462
(2000). Google Scholar
M. J. Maldonado
,
L. Ruiz-Oblitas
,
J. M. Munuera
,
D. Aliseda
,
A. Garcia-Layana
, and
J. Moreno-Montanes
,
“Optical coherence tomography evaluation of the corneal cap and stromal bed features after laser in situ keratomileusis for high myopia and astigmatism,”
Ophthalmology , 107 81
–87
(2000). Google Scholar
C. Wirbelauer
,
C. Scholz
,
H. Hoerauf
,
R. Engelhardt
,
R. Birngruber
, and
H. Laqua
,
“Corneal optical coherence tomography before and immediately after excimer laser photorefractive keratectomy,”
Am. J. Ophthalmol. , 130 693
–699
(2000). Google Scholar
C. R. Munnerlyn
,
S. J. Koons
, and
J. Marshall
,
“Photorefractive keratektomy: A technique for laser refractive surgery,”
J. Cataract Refractive Surg. , 1 46
–52
(1988). Google Scholar
V. Kamensky
,
F. Feldchtein
,
V. Gelikonov
,
L. Snopova
,
S. Muraviov
,
A. Malyshev
,
N. Bityurin
, and
A. Sergeev
,
“In situ monitoring of laser modification process in human cataractous lens and porcine cornea using coherence tomography,”
J. Biomed. Opt. , 4 137
–143
(1999). Google Scholar
A. M. Razhev
and
A. A. Zhupikov
,
“Excimer ArF laser with output energy of 0.5 J and He buffer gas,”
Quantum Electron. , 27 665
–669
(1997). Google Scholar
S. N. Bagayev
,
A. M. Razhev
, and
A. A. Zhupikov
,
“Excimer laser ophthalmic devices for eye microsurgery,”
Laser Phys. , 8 794
–798
(1998). Google Scholar
J. M. Schmitt
,
S. H. Xiang
, and
K. M. Yung
,
“Speckle in optical coherence tomography,”
J. Biomed. Opt. , 4 95
–105
(1999). Google Scholar
M. C. Knorz
and
B. Jendritza
,
“Topographically-guided laser in situ keratomileusis to treat corneal irregularities,”
Ophthalmology , 107 1138
–1143
(2000). Google Scholar
J. Hjortdal
and
N. Ehler
,
“Treatment of post-keratoplasty astigmatism by topography supported customized laser ablation,”
Acta Ophthalmol. Scand. , 79 376
–380
(2001). Google Scholar
A. Stojanovic
and
T. A. Nitter
,
“200 Hz flying spot technology of the LaserSight LSX excimer laser in the treatment of myopic astigmatism,”
J. Cataract Refractive Surg. , 27 1263
–1277
(2001). Google Scholar
|
||||||||||||||||||||||||||||||||||||||||||||||||||||||||||||||||||||||||||||||||||||||||||||||||||||||||||||


CITATIONS
Cited by 22 scholarly publications and 11 patents.
Cornea
Optical coherence tomography
Eye
Signal to noise ratio
Laser ablation
In vivo imaging
Surgery


