1.IntroductionRecent advances in fiber optics, light sources, and detectors and computer-controlled instrumentation have stimulated a period of unprecedented growth in the development of photonics technologies for a wide variety of diagnostic and therapeutic clinical applications. The use of noninvasive optical techniques for the early detection of precancerous conditions is a rapidly emerging area within the field of biophotonics. Among the most promising new approaches are those that rely on quantitative measurements of scattered light to improve current clinical strategies for the screening and diagnosis of epithelial precancers in a variety of organ sites. Initial clinical studies using both scattering-based imaging technologies such as confocal microscopy1 2 and optical coherence tomography3 4 5 (OCT) and scattering-based spectroscopic approaches including elastic scattering spectroscopy6 7 8 and polarized reflectance spectroscopy9 10 have yielded promising results. Despite growing evidence of the clinical utility of a variety of scattering-based optical techniques, the biological origins of differences in the measured scattering signals of normal and neoplastic tissue are not well understood. Developing a more complete understanding of the relationship between measured light scattering properties and underlying tissue biochemistry, morphology, and architecture is a key factor in optimizing the diagnostic potential of scattering-based optical technologies. To meaningfully interpret images obtained using technologies such as OCT, which provide high but not subcellular resolution, there is a requirement to relate subcellular changes in morphology that occur with neoplasia, for instance increased nuclear size and nuclear-to-cytoplasmic ratio, to the bulk optical signal measured. Images from other emerging imaging modalities, for instance in vivo reflectance confocal microscopy, do provide subcellular resolution, facilitating direct assessment of diagnostically relevant features such as nuclear size and shape. However, more sophisticated forms of image analysis, such as correlating fluctuations in the measured intensity within the nucleus of a cell to the DNA content or chromatin texture of that cell, require comprehensive understanding of cellular scattering properties There is growing interest in extracting nuclear size distributions and refractive indices from measured reflectance spectra. Detailed analysis of spectroscopic scattering data also requires increased knowledge of cellular scattering. Perelman et al.; obtained nuclear size information from measured reflectance spectra using a model that treats the nucleus of a cell as a homogeneous sphere.6 Sokolov et al.; interpreted polarized reflectance spectra using a model of cellular scattering in which a cell was modeled as a single sphere containing a concentric spherical nucleus.10 Mourant et al.; postulated that the primary scatterers within cells are particles of small size relative to the illuminating wavelength.11 Schmitt and Kumar proposed a model of tissue scattering based on spherical particles of varying size distributed using a skewed log-normal distribution function.12 Since the origins of cellular scattering vary strongly with the morphology of a particular cell type,13 14 15 there is not necessarily a single model of scattering appropriate for all tissues. The variability in subcellular sources of scattering is illustrated in Figure 1, which shows confocal reflectance images of several cell types, demonstrating that the scattering signal may arise predominantly from the nucleus or cytoplasmic organelles or may be generated throughout all portions of the cell, depending on the morphology of the specific cell and the measurement conditions. Assessing whether particular models of cellular scatterings are appropriate choices for specific measurement conditions and organ sites requires advances in both computational and experimental techniques for investigating subcellular light scattering. Figure 1Reflectance confocal microscopy images (top row) and corresponding phase contrast images (bottom row) of cells of varying morphology. The image on the left shows a hepatocyte with high mitochondrial volume fraction. The cell appears bright with a dark nucleus. The middle image shows a cell from a breast tumor cell line (MDA-435). Scattering throughout the cell is evident, and it is difficult to discern the nuclear borders. The image on the right shows a breast tumor cell after addition of acetic acid, a contrast agent that selectively increases nuclear scattering.  Mathematical modeling of light scattering at the cellular level is challenging because the size of the scatterers relative to the illumination wavelength necessitates an electromagnetic approach. A finite-difference time-domain (FDTD) model that provides a numerical solution of Maxwell’s equations was developed to calculate the electric and magnetic fields within and surrounding a single cell of arbitrary morphology.16 17 The model provides a means to assess the angular distribution and magnitude of light scattering as a function of cellular structure. In previous studies, the FDTD model was used to predict how light scattering was influenced by parameters such as organelle type and volume fraction, the overall size and refractive index of a cell’s nucleus, and the refractive index of the medium surrounding the cell.18 19 A significant limitation of the initial FDTD light scattering studies was the lack of quantitative morphological data required to generate realistic representations of biological cells. In particular, FDTD simulations demonstrated that the size, refractive index, and heterogeneity of a cell’s nucleus played a critical role in determining the cell’s light-scattering properties. However, accurate nuclear feature measurements were not available to guide the choice of input parameters. Rapidly evolving semiautomated cytometry techniques20 21 provide an attractive means to acquire the nuclear feature data essential to developing more realistic nuclear geometries for computational investigations of cellular light scattering. Precancerous lesions are characterized by significant nuclear atypia including increased nuclear size, nuclear-to-cytoplasmic ratio, hyperchromasia, and pleomorphism.22 Quantifying nuclear feature measurements in cells from lesions of different pathologic grades provides critical input data for models used to study light scattering during neoplastic progression. The studies described in this paper investigate light scattering of cervical cells throughout neoplastic progression. The work is motivated by current interest in the development of noninvasive reflectance-based optical technologies for screening and detection of cervical precancers.1 23 24 Although preliminary clinical studies have demonstrated the ability to use reflectance-based techniques to discriminate normal and dysplastic cervical tissue with sensitivity and specificity exceeding the current standard of care, the studies have not fully elucidated the biological basis of the measured scattering changes. Understanding the biological origins of measured scattered signals is important to both the design of effective clinical devices and the meaningful interpretation of acquired data. Furthermore, detailed knowledge of the biological origins of scattering will promote realistic assessments of both the potential and limitations of new scattering-based optical technologies. To study in detail the relationship between nuclear structure and light scattering properties, quantitative nuclear feature measurements from histopathologic sections of normal and dysplastic cervical tissue were acquired using a Cyto-Savant image cytometry system. A subset of the acquired features was incorporated into a FDTD model of light scattering. The results demonstrate that not only nuclear size and DNA content but also the details of chromatin texture affect cellular light scattering properties. 2.Methods2.1.PatientsThe study described was conducted at the University of Texas M.D. Anderson Cancer Center in Houston. Women age 18 and older were enrolled in the study based on a history of abnormal cervical cytology. Informed consent was obtained from each subject who participated, and the protocol was approved by the Internal Review Boards at M.D. Anderson Cancer Center and the University of Texas at Austin. Each woman enrolled in the study underwent routine colposcopic examination. Biopsies were obtained from a colposcopically normal region as well as a colposcopically abnormal region (when present) from each patient. Feulgen-stained tissue sections prepared from 122 biopsies acquired from 66 women were quantitatively analyzed. In addition, standard hematoxlyin and eosin (H&E) sections were prepared for each biopsy. Each H&E slide was read by at least two pathologists with expertise in gynecology pathology to provide a final diagnosis. In cases of discrepancies between the diagnoses provided by the two pathologists, the slide was read a third time to establish a consensus diagnosis. Table 1 shows a detailed breakdown of the pathology results for the 122 sections included in the analysis. Sections were classified as either normal, human papilloma virus (HPV), or neoplastic (CIN). The histopathological categories of cervical intraepithelial neoplasia (CIN) describe a spectrum of changes that precede the development of invasive cancer. In this study, changes were classified as mild (CIN I) , moderate (CIN II), or severe (CIN III/CIS). Table 1
2.2.Quantitative Image CytometryTissue sections were cut and Feulgen-thionin stained as described in Ref. 25. The Feulgen-thionin stain is stoichiometric for DNA. A pathologist mapped a region of interest (ROI) for each tissue section, designating the region of the tissue section containing the cells with the worst diagnosis. A Cyto-Savant computer-assisted image analysis system (Oncometrics Imaging Co., Vancouver, British Columbia, Canada) was used to quantitatively assess nuclear features within the ROI. Only nonoverlapping nuclei were used in the analysis. The oncometrics feature set (FB5) computed consists of 126 quantitative measurements related to the morphology of the nuclei, the DNA content of the nuclei, and texture features which characterize changes in chromatin appearance. Together, these features highlight the nuclear atypia most indicative of CIN. 2.3.FDTD ModelThe light scattering patterns of cervical cells throughout neoplastic progression were simulated using the FDTD method. In the simulations described, the incident electric field propagated in the +z direction, and the longest portion of the nucleus was oriented along on the x axis. The FDTD method is a powerful approach to electromagnetic analysis, providing a computational solution to Maxwell’s curl equations. The FDTD algorithm takes Maxwell’s equations and discretizes them in time and space, yielding six coupled finite difference equations. The six electric and magnetic field components (Ex, Ey, Ez, Hx, Hy, and Hz) are spatially and temporally offset on a 3-D cubical grid, with a voxel size 1/10 of the smallest wavelength of interest. As the six finite-difference equations are stepped in time, the electric and magnetic fields are updated for each grid point. To simulate propagation in an unbounded medium, boundary conditions must be applied to the tangential electric field components along the edges of the computational boundary at each time step. The FDTD method computes the fields in a region around the cell that lies in the near-field, which is then transformed to the far field. The angular distribution of scattered light (phase function) and scattering cross-section can be computed. For further details of the FDTD model, see Ref. 18, which provides a more complete description of the use of the FDTD method to model cellular scattering. All simulations were performed using an excitation wavelength of 900 nm. Using this wavelength, results are particularly relevant to confocal microscopy and OCT imaging. The simulations described in this paper were performed on a Dell Optima 8100 with a 1.3-GHz processor and 1 Gbit of RAM. Each simulation required approximately 1 h of computational time. 3.Results3.1.Quantitative Image CytometryTypical images of cervical cell nuclei obtained using the Cyto-Savant system are shown in Figure 2. An image of a representative nucleus from each of the primary pathological classifications (normal, CIN I, CIN II, and CIN III) is displayed. The intensity of the gray-scale values within the nuclei is directly related to the DNA content. In relating gray-scale values to DNA content, it was assumed that absorption from the dye could be modeled using Beer’s law (see Sec. 3.2.1 for more details). In visually examining the images, the normal and low-grade nuclei appear rounder than the high-grade nucleus, which has an elongated and distorted shape. Differences in the chromatin texture among the nuclei are clearly apparent in the images. The texture of the normal cell nucleus is significantly more homogeneous. Coarse clumping of chromatin can be seen in the high-grade nuclei. The randomly distributed large clusters of highly condensed chromatin observed in the CIN III nucleus are a classic feature of CIN (Refs. 26 27 28). Figure 2Images of Feulgen-thionin-stained cervical cell nuclei. From left to right: normal, CIN I, CIN II, and CIN III cells. The scale bar shown is 5 μm.  The Cyto-Savant system was used to provide quantitative data concerning nuclear features. Three classes of feature types were measured using the Cyto-Savant: features related to nuclear morphology, DNA content, and chromatin texture. As an initial step to facilitate incorporation of measured features into the FDTD light scattering model, the mean and standard deviation of each feature value was calculated for each tissue section. Typically, 50 to 200 nuclei were analyzed per section, and the number of sections analyzed per pathological diagnosis is provided in Table 1. Next, overall mean and standard deviations were calculated as a function of pathological diagnosis (normal, HPV, CIN I, CIN II, CIN III/CIS) of the tissue section. The means and standard deviations of the feature values were calculated to provide input data for the light scattering model, providing a more rational approach to determining model parameters than past studies in which parameters were chosen without supporting experimental data. Table 2 provides a brief description for the nuclear feature variables presented in Tables 3 and 4. Tables 3 and 4 report the mean and standard deviations as a function of pathology for selected features related to nuclear morphology (Table 3) and DNA content (Table 4). For each feature variable presented, two data columns are provided. The first column displays the mean feature value, and the second adjacent column contains the corresponding standard deviation. Feature values presented correspond to mean measurements over a large number of nuclei per slide, and therefore represent a typical cell within the ROI rather than the individual worst cells on a slide. As documented in Table 3, nuclear area increases dramatically with dysplasia. Both the mean radius and maximum radius of the nucleus increase. However, the maximum radius increases more significantly than the mean radius, suggesting increasing distortion of nuclear shape. This shape distortion is also apparent in the increasing eccentricity of the nuclei with progression of CIN. In general, the standard deviations of the feature values are much larger in the high-grade cells, consistent with nuclear pleomorphism. Table 2
Table 3
Table 4
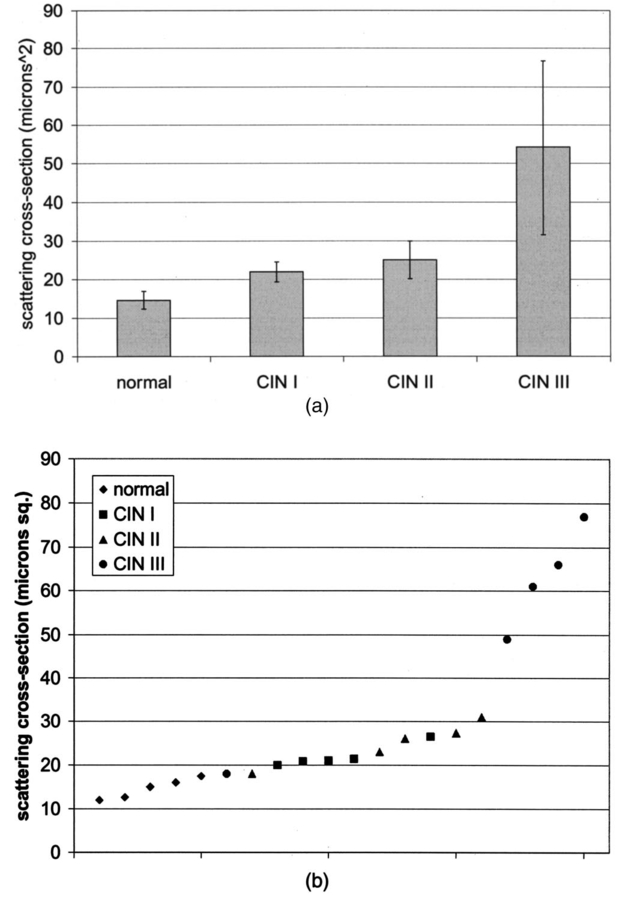
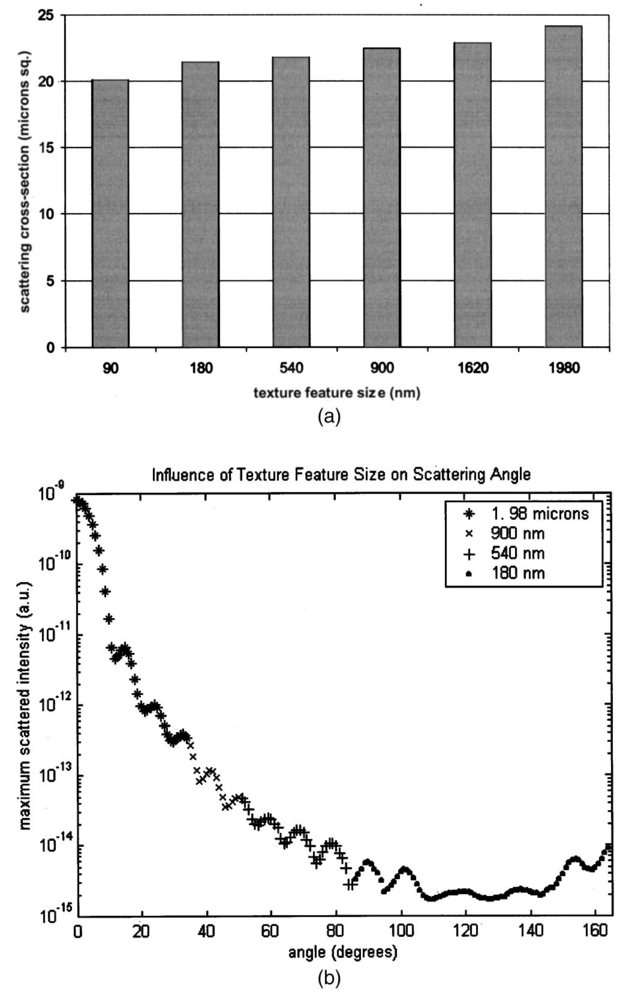
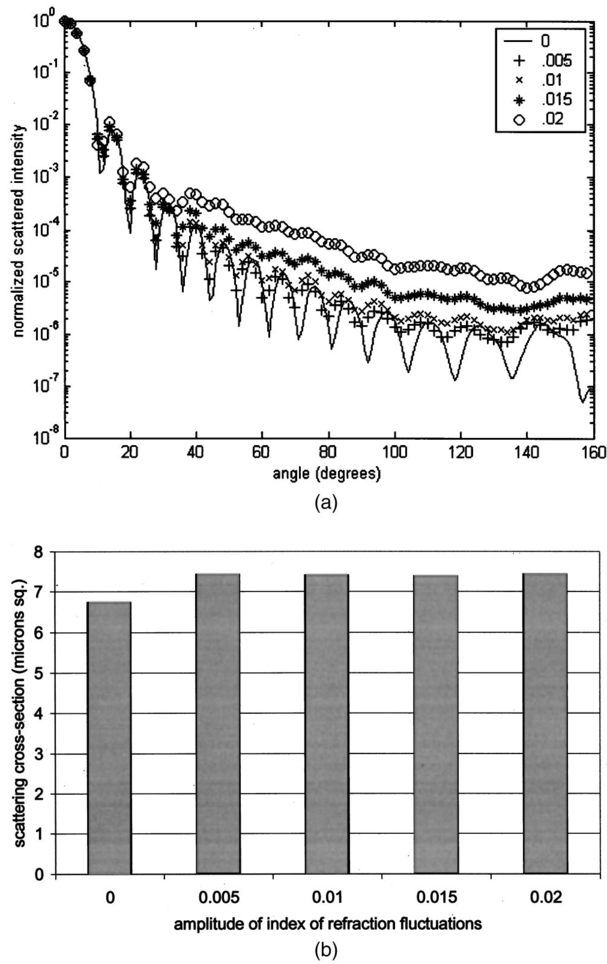
Table 4 quantifies the DNA content of cervical cells throughout neoplastic progression. In this table, the “DNA index” describes the integrated optical density of the nucleus. To eliminate potential variability in this measurement due to staining intensity, the index is normalized to the mean value of the DNA amount for leukocytes on the slide. The mean optical density of the nucleus is determined by dividing the integrated optical density (OD) by the nuclear area. The “OD maximum” is the largest value of the OD of the nucleus, also normalized against a control. The “OD variance” quantifies the second moment of the OD and is divided by the square of the average OD to make the feature independent of stain intensity. Table 4 documents both the increased total DNA content of cervical cells with high-grade dysplasia and the increased variability in the pixel to pixel DNA content within an individual nucleus with neoplastic progression. Further spatial information concerning the pixel-to-pixel OD variations was obtained from the raw nuclei images based on segmentation into regions of high, medium, and low chromatin condensation. Analysis of images from high-grade nuclei indicates coarse chromatin clumps of 1- to 2-μm: diameter distributed on average at one clump per approximately 10 μm2 of nuclear area. In addition, regions of chromatin clearing similar in size to the chromatin clumps occur in high-grade nuclei. The fluctuations in nuclear index of refraction due to regions of chromatin clumping and clearing may be a significant source of scattering signal in high-grade nuclei. 3.2.FDTD Simulations3.2.1.Simulation ParametersTo isolate the effects of nuclear morphology on scattering, the geometry for each simulation consisted of an ellipsoidal heterogeneous nucleus surrounded by cytoplasm. Confocal reflectance images of cervical tissue1 29 suggest that treating the nucleus as the dominant contributor to cellular scattering is a reasonable first-order model for cervical tissue. Figure 3 shows typical confocal reflectance images of normal and dysplastic tissue, which demonstrate that nuclei are the predominant source of scattering signal. Although assuming the nuclei are the primary source of scattering appears to be reasonable for cervical tissue, this model choice would not be appropriate for other tissues such as hepatic tissue in which cytoplasmic organelles, for instance, mitochondria, play a significant role in scattering. Figure 3Confocal reflectance images of fresh cervical tissue. The image on the top shows normal cervical tissue, and the image on the bottom shows dysplastic (CIN II) cervical tissue. In both cases, cell nuclei are the dominant source of scattering signal. Images were obtained during the study described in Ref. 1.  The assignment of index of refraction values to each voxel within the 3-D mesh influences the results of the simulations. The refractive index of the cytoplasm was set at n=1.36 based on experimental measurements in our laboratory using immersion refractometry techniques first described by Barer.30 A similar cytoplasmic refractive index was reported by Brunsting.31 Although the measurements were made in the visible rather than the near IR, dispersion is not a significant concern over the wavelength regions of interest since water is the primary constituent of the cellular materials considered and varies in refractive index only Δn=0.01 over the visible and near IR region.32 The mean refractive index of the nucleus is also an important parameter in the model. Brunsting reports31 the index of refraction of the nucleus at n=1.39. Immersion refractometry experiments of an epithelial cell line in our laboratory yielded a nuclear refractive index value of n=1.39. In the simulations described in this paper, the mean refractive index of the nucleus of normal cervical cells was set at this value. 3.2.2.Scattering Patterns of Cells Throughout Neoplastic ProgressionTo simulate light scattering from cervical nuclei, five nuclei for each pathological classification (normal, CIN I, CIN II, CIN III) were created. To provide a better representation of the diversity of the data than would be achieved by selecting the feature values for 5 individual nuclei in each category out of a data set of more than 1000 nuclei, features were sampled using normal distributions created using the mean and standard deviation of the measured feature values of interest. Feature values that described the size and shape of the nucleus and DNA content were first used to define the cell geometries. In addition, fluctuations in the index of refraction within the nucleus were generated based on the quantitative nuclear images. The shape of the nuclei were created based on the maximum radii and the measured eccentricity. DNA content was related to refractive index, assuming the mean DNA content of a normal nucleus was equivalent to a mean nuclear index of n=1.39. In extrapolating measurements of DNA content to refractive index, it was assumed that the refractive index increased linearly with the amount of DNA. Furthermore, it was assumed that absorption due to the presence of the Feulgen-thionin stain could be modeled using Beer’s law. After making necessary assumptions about path length, it is then possible to relate each pixel’s gray level to a refractive index. Barer provides the specific refractive index increment for nucleic acids as alpha=0.0016 to 0.0020 (for details see Ref. 30). The structure within the nucleus was created by filling the voxels within the nucleus with scatterers of various dimensions and index of refraction, depending on the texture desired. In general, normal cells contain finely dispersed nuclear chromatin, modeled as uniformly distributed refractive index fluctuations at Δn=±0.005 to 0.010 relative to the mean nuclear index and an average spatial frequency of 3 μm−1. In the high-grade cells, the modeled distribution was more varied with a frequency range from 0.66 to 3 μm−1 and refractive index variations of Δn=±0.01 to 0.02. The highest spatial frequency of the refractive index fluctuations is limited by the resolution of the images. It is possible that fluctuations at higher spatial frequencies could impact light scattering, and simulations that address this issue are described later. The lowest spatial frequencies of the nuclear index fluctuations are determined by the size of the largest chromatin clumps, typically 1 to 1.5 μm. Figure 4 plots the intensity of scattered light as a function of scattering angles for normal, CIN I, CIN II, and CIN III cells. For each cell simulated, the scattering pattern was first averaged over azimuthal angle so that it was only a function of θ. Each line represents the average scattering for a particular pathological classification. The scattering patterns indicate progressive elevation of light scattering intensity across all angles with CIN. However, the overall shape of the scattering patterns is quite similar for all of the cells. The scattering patterns are highly peaked at low angles, indicating the nuclei are predominantly forward scattering. The anisotropy parameter ranged from g=0.989 to g=0.991. The range of scattering is approximately five to six orders of magnitude, consistent with experimental measurements of cellular scattering reported by Mourant et al.;11 and Drezek et al.;18 for other cell types. The fine structure present in Figure 4 is a typical feature of numerical simulations of scattering, which represent only a discrete set of scatterer sizes. Note that the fine structure is less common in experimental measurements, which are generally an average measurement of a dilute suspension of cells of varying size and morphology. 3.2.3.Scattering Cross Sections of Cells Throughout Neoplastic ProgressionFigure 5(a) shows the computed scattering cross sections throughout neoplastic progression. As demonstrated in the figure, scattering cross section increases with the progression of CIN. Error bars show the standard deviation of the scattering based on the simulation of five cells within each pathological classification. The error bars increase both because the mean nuclear size and refractive index is higher with progression of CIN overall and because of increased variance in the feature measurements, in particular the size and shape of the cells, indicative of pleomorphism. The scattering cross sections are higher primarily due to progressive increases in nuclear size and DNA content. Figure 5(b) plots the scattering cross sections for all 20 cells in ascending order from lowest to highest scattering cross section. 3.2.4.Influence of the Size of Chromatin Features on Light ScatteringIt can be difficult to isolate the influence of changes in the size and refractive index values of chromatin texture features from the influence of changes in overall size and index in simulations that incorporate all of these effects simultaneously. Thus, two sets of simulations were performed in which the size and mean index of the nucleus was held constant and only features related to chromatin texture were varied. The first set of simulations was designed to test whether changes in light scattering would occur just due to changes in the size of the scatterers with the nucleus, holding all other variables, including the magnitude of the refractive index variations within the nucleus constant. Only the spatial frequency of the refractive index fluctuations was varied among the six nuclei. The spatial frequencies of the refractive index fluctuations in the nuclei were 11.1, 5.55, 1.85, 1.11, 0.6, and 0.50 μm−1, corresponding to scatterer sizes ranging from 90 nm to 2 μm. Here 90 nm was the smallest scatterer size possible due to the dimensions of the voxels within the grid. The pixel size of the images obtained in this study limits resolution to 0.34 μm. Although large chromatin clumps are easily resolved with light microscopy, fine chromatin texture features not resolvable using conventional light microscopy may influence a cell’s light scattering properties. Studies by Mourant et al.;11 indicated that small scatterers play a significant role in cellular scattering. For this reason, texture features of smaller dimensions were considered in the simulations. The upper limit of the texture feature sizes was chosen based on the size of coarse chromatin clumps in high-grade nuclei. The overall scattering cross section increased with the mean size of the texture features [Figure 6(a)]. Over a broad range of texture feature sizes, the change in scattering cross section was ∼25. For comparison, changing the nuclear diameter by 1 μm or the mean index of refraction by Δn=0.005 would cause relatively similar changes in scattering cross section. Scattering patterns were also calculated for each of the six nuclei. From the six individual patterns, a new composite scattering pattern was created. For each scattering angle from 0 to 180 deg in increments of 1 deg the composite scattered intensity at a particular angle was defined to be the maximum of the six scattered intensities for that angle corresponding to the six simulations of nuclei with different texture feature sizes. In creating this pattern, there was a strong angular dependence of scattering based on the size of the chromatin texture features. Figure 6(b) shows the size of the features most responsible for maximum scattering within particular angle ranges in the composite pattern, determined by creating histograms of the number of times each texture feature size occurred within an angle range of interest and extracting the feature size corresponding to the peak of the histogram. As shown in Figure 6(b), as the size of the texture feature decreased, the angle of scattering increased. 3.2.5.Influence of the Magnitude of Texture Feature Index FluctuationsHow is nuclear scattering affected if the texture feature size and all other variables are held constant while only the amplitude of the refractive index fluctuations varies? To address this question, five nuclei were generated. All of these nuclei had the same size, the same mean index of refraction, and the same nuclear texture feature size (0.36 μm). Only the amplitude of the refractive index fluctuations was varied. For each texture feature, a refractive index was randomly assigned by sampling a uniform distribution, centered at n=1.39, about the following amplitudes: Δn=0 (homogeneous case), Δn=±0.005, Δn=±0.01, Δn=±0.015, and Δn=±0.02. Figure 7(a) shows the scattering patterns of the five nuclei, normalized to the scattered intensity at 0 deg. As the plots demonstrate, higher angle scattering progressively increases as the magnitude of the index fluctuations rises. However, this change in the angular distribution of scattering does not necessarily translate into higher scattering cross sections. Figure 7(b) displays the scattering cross sections for the five nuclei. The heterogeneous nuclei have scattering cross sections approximately 10 higher than the homogeneous nucleus (Δn=0). However, the cross sections for the heterogeneous nuclei are almost identical regardless of the amplitude of index fluctuations. This is possible because the calculation of scattering cross section is dominated by small-angle scattering, with more than 95 of the total cross section contributed over the first 10 deg of scattering. 4.DiscussionThis study investigated how the magnitude and angular dependence of cellular light scattering is influenced by changes in nuclear size, DNA content, and chromatin texture that occur as cells undergo neoplastic progression. We seek to understand whether scattering properties can be adequately described by simple models that account for the overall size and DNA content of the nucleus and to identify those measurement conditions in which it may be particularly important to consider the influence of nuclear texture features, in addition to nuclear size and DNA content, in interpreting measured scattering data. The simulations in this paper demonstrate that the intensity of light scattering increases with progression of CIN. Although the shape of the scattering pattern is not strongly affected by nuclear pathologic grade, increased scattering occurs across all angles with CIN, leading to higher scattering cross sections. The most dramatic differences in scattering occur between CIN II and CIN III cells because changes in nuclear size and DNA content are most pronounced between these two categories. The simulations suggest that changes in scattering properties with CIN are dominated by the effects of increased nuclear size and increased DNA content. However, varying only the magnitude of refractive index fluctuations within the nucleus can significantly alter high-angle scattering. Taken as a whole, the simulations imply that simple models that assume scattering is a function of only the overall size and refractive index of the nucleus may be appropriate in extracting morphologic features from many optical imaging techniques that rely on forward scattered light; however, in interpreting optical measurements of photons scattered primarily at high angles, the impact of nuclear texture features may be an important consideration. A significant component of the study described is the use of quantitative image cytometry to characterize the morphology of cervical cells. Semiautomated image cytometry of Feulgen-thionin-stained tissue can be used to quantify nuclear features over large cell populations. Understanding how these features vary with disease state is of critical importance because quantitative measurements of nuclear features have been shown to provide sensitive and specific metrics for the detection of neoplastic abnormalities in multiple organ sites.20 21 33 34 35 36 Current quantitative histopathology methods are based on the analysis of stained and sectioned biopsy specimens. It is our vision that quantitative nuclear feature data can be obtained in vivo in real time using optical imaging modalities. Such data will provide the clinician a significant source of information in establishing a diagnosis and determining the most appropriate therapeutic intervention. Modeling the light scattering of cervical cells throughout neoplastic progression indicates progressive changes in scattering related to increased nuclear size, elevated DNA content, and increased heterogeneity of chromatin structure. Both the size and the refractive index values of chromatin texture features alter scattering properties. Because there is some evidence that the details of chromatin features can be used to determine the likelihood of a lesion’s progression,37 it is necessary to develop methods to probe texture features using optical methods. Although future studies will be required to devise optimal methods for integrating quantitative pathology data into light scattering models, the studies described in this paper provide an important approach to developing fundamental understanding of light scattering of cells throughout neoplastic progression. Understanding cellular light scattering is important to optimize the clinical performance of reflectance-based optical technologies. Many modeling strategies currently treat the nucleus as a homogeneous spherical object. This assumption is most justified for optical techniques that collect scattered light over a large enough solid angle that the scattering cross section and its variation with wavelength provide a reasonable approximation of the measured scattering. However, not all optical technologies meet these conditions. For instance, OCT is primarily sensitive to backscattered light. Fiber probes with small source-detector distance geometries are also particularly sensitive to the details of high-angle scattering. Mourant et al.; demonstrated that small scatterers play a significant role in high-angle scattering11 and that the details of high-angle scattering influence signals detected using clinically relevant geometries,38 emphasizing the motivation to understanding scattering from chromatin texture features and how the light scattering generated by these features impacts measured signals. As the simulations in this paper demonstrate, variations in both the magnitude and angular distribution of scattering can occur solely because of the spatial arrangement of texture features within the nuclei even when the size and mean refractive indices of the nuclei are identical. In assessing the potential of optical technologies to probe details of nuclear texture, it is necessary to consider not only how chromatin texture influences scattering but whether the scattering changes induced are sufficient to generate measurable effects given the detection limits of current technologies. Currently, there is a high level of interest in using variations of reflectance spectroscopy to probe nuclear structure in vivo. The simplest approach from an instrument design perspective is measuring the bulk reflectance spectra and extracting the signal due to the cell nuclei from the measured spectra. The signal due to the cell nuclei is only 2 to 5 of the bulk signal.6 The simulations presented in this paper suggest variations due specifically to chromatin texture might generate changes in the range of 10 to 25 in the overall magnitude of the scattered nuclear signal [see Figures 6(a) and 7(b)]. Although building a device to measure a signal two orders of magnitude smaller than the dominating signal is feasible, the dynamic range and signal-to-noise requirements would impact both the speed and cost of the system—the two primary factors that make reflectance-based technologies appealing. Measuring chromatin texture features may be easier to accomplish using polarization-based schemes that remove undesired background reflectance physically through rejection of multiply scattered light. Additionally, although changes in scattering cross section due to texture features are not large, the changes in high-angle scattering due only to chromatin texture features can be quite dramatic, increasing multiple orders of magnitude due to relatively subtle structural variations. These changes can be effectively sampled through appropriate fiber optic probe designs. If the modeling results are to be used to guide device design and data analysis, it would be desirable to experimentally verify the fundamental modeling findings. Although there is not yet the experimental data to conclusively confirm the predictions of the modeling, there are measurements that qualitatively agree with the general findings of this study. In a study of paired normal and dysplastic cervical tissue from 20 women,1 confocal reflectance images were acquired and analyzed to quantify the mean intensity of nuclei as a function of depth within the tissue. At all depths, the dysplastic tissue nuclei were brighter than the normal nuclei. Moreover, the percentage increases in scattered intensity between normal and high-grade (CIN II) nuclei measured via confocal reflectance imaging (Figure 8) are similar in magnitude to the increases predicted by the FDTD modeling reported in this paper. The increased scattering within individual nuclei imaged using confocal reflectance microscopy suggests some combination of a higher nuclear refractive index and changes in texture feature in the dysplastic cells. This is a significant observation since many of the light scattering models currently used to extract morphological parameters from measured spectra consider only changes in the size and density of nuclei with dysplasia but do not account for potential differences in the nuclear refractive index or changes in chromatin texture. Figure 8Mean nuclear scattering intensity as a function of depth for normal and abnormal cervical nuclei imaged using a confocal reflectance microscope. See Ref. 1 for a complete description of the study design. 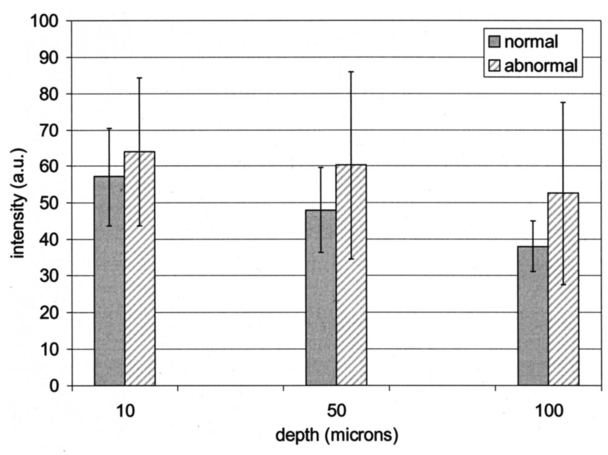 Other more macroscopic evidence of increased scattering from dysplastic tissue is also available. However, in interpreting these data, it is important to recognize that macroscopic measurements reflect not only cellular but also architectural changes that occur with neoplastic progression. Confocal reflectance-based measurements of the macroscopic scattering coefficients of fresh cervical tissue indicate increased scattering in dysplastic tissue (unpublished data). In addition, OCT measurements of the cervical epithelium in premenopausal women show statistically significant increases in the intensity of dysplastic cervical tissue relative to normal tissue.39 Although these results indicate the same trends found in the modeling studies, changes in scattering in these two examples reflect both the putative increased scattering from individual nuclei and the increased density of nuclei in dysplastic regions. To fully understand measured changes in scattering using most optical technologies, it is necessary to consider changes that occur not only at the cytological level but also those that occur at the histological level. A significant advantage of the analysis of histopathologic sections as presented in this paper relative to analysis of cytological samples is that architectural data may be readily obtained from the same sections to provide a more complete picture of the morphological changes that accompany neoplasia. However, there are important concerns that must be addressed before the architectural data obtained from the sections can be directly related to in vivo features. One critical factor will be examining how the shrinkage that occurs in the preparation of the tissue sections affects measured architectural data such as nuclear density and the spacing between adjacent nuclei. Shrinkage does not appear to be a significant issue for data measured on individual nuclei as there is good agreement between the mean normal nuclear sizes obtained from the sections measured in this study (∼6 μm) and nuclear sizes in confocal images of intact cervical biopsies of normal tissue. In summary, this paper provides a framework for integrating measurements of quantitative feature data and mathematical models of light scattering from cells to develop knowledge of light scattering properties useful in meaningful interpretation of clinical data acquired with scattering-based optical instruments. Whether measured via confocal microscopy, optical coherence microscopy, reflectance spectroscopy, or other scattering-based approaches, optical signals contain hidden clues related to the morphology, DNA content, and chromatin texture of nuclei. Deciphering these clues offers the opportunity not only for sensitive and specific detection of precancers36 but also to predict a lesion’s clinical course,37 which has significant implications in terms of planning the most appropriate clinical interventions and in reducing the costs associated with unnecessary treatments. To meet this challenge, it is necessary to understand the quantitative relationships between nuclear features and measured scattering data, assess the ability of optical technologies to measure diagnostically relevant nuclear features in vivo, and relate in vivo data obtained to both the degree of dysplasia and risk of progression. The forward-based modeling approach described in this paper provides an important first step in achieving these goals. AcknowledgmentsThe authors gratefully acknowledge support from National Institutes of Health (NIH) Grant No. PO1 CA 82710-01 and the M.D. Anderson Odyssey Fellowship program. REFERENCES
T. Collier
,
A. Lacy
,
A. Malpica
,
M. Follen
, and
R. Richards-Kortum
,
“Near real time confocal microscopy of amelanotic tissue: detection of dysplasia in ex vivo cervical tissue,”
Acad. Radiol. , 9
(5), 504
–512
(2002). Google Scholar
M. Rajadhyaksha
,
M. Grossman
,
D. Esterwitz
,
R. Webb
, and
R. Anderson
,
“In vivo confocal scanning laser microscope of human skin: melanin provides strong contrast,”
J. Invest. Dermatol. , 104 946
–952
(1995). Google Scholar
J. M. Poneros
,
S. Brand
,
B. E. Bouma
,
G. J. Tearney
,
C. C. Compton
, and
N. S. Nishioka
,
“Diagnosis of specialized intestinal metaplasia by optical coherence tomography,”
J. Gastroenterol. , 120 7
–12
(2001). Google Scholar
C. Pitris
,
C. Jesser
,
S. A. Boppart
,
D. Stamper
,
M. E. Brezinski
, and
J. G. Fujimoto
,
“Feasibility of optical coherence tomography for high resolution imaging of human gastrointestinal tract malignancies,”
J. Gastroenterol. , 35 87
–92
(2000). Google Scholar
J. A. Izatt
,
M. D. Kulkarni
,
H.-W. Wang
,
K. Kobayashi
, and
M. V. Sivak
,
“Optical coherence tomography and microscopy in gastrointestinal tissues,”
IEEE J. Sel. Top. Quantum Electron. , 2 1017
–1028
(1996). Google Scholar
L. Perelman
,
V. Backman
,
M. Wallace
,
G. Zonios
,
R. Manoharan
,
A. Nustrat
,
S. Shields
,
M. Seiler
,
C. Lima
,
T. Hamano
,
I. Itzkan
,
J. Van Dam
,
J. Crawford
, and
M. Feld
,
“Observation of periodic fine structure in reflectance from biological tissue: a new technique for measuring nuclear size distribution,”
Phys. Rev. Lett. , 80 627
–630
(1998). Google Scholar
I. Bigio
,
J. Mourant
,
J. Boyer
,
T. Johnson
, and
J. Lacey
,
“Elastic scattering spectroscopy as a diagnostic tool for differentiating pathologies in the gastrointestinal tract: preliminary testing,”
J. Biomed. Opt. , 1 192
–199
(1996). Google Scholar
J. Mourant
,
I. Bigio
,
J. Boyer
,
T. Johnson
, and
C. Conn
,
“Spectroscopic diagnosis of bladder cancer with elastic light scattering,”
Lasers Surg. Med. , 17 350
–357
(1995). Google Scholar
V. Backman
,
R. Gurjar
,
K. Badizadegan
,
R. Dasari
,
I. Itzkan
,
L. T. Perelman
, and
M. S. Feld
,
“Polarized light scattering spectroscopy for quantitative measurements of epithelial structures in vivo,”
IEEE J. Sel. Top. Quantum Electron. , 5 1019
–1027
(1999). Google Scholar
K. Sokolov
,
R. Drezek
, and
R. Richards-Kortum
,
“Reflectance spectroscopy with polarized light: is it sensitive to nuclear morphology?,”
Opt. Express , 5 302
–317
(1999). Google Scholar
J. Mourant
,
A. Hielscher
,
J. Freyer
,
A. A. Eick
, and
T. M. Johnson
,
“Mechanisms of light scattering from biological cells relevant to noninvasive optical tissue diagnostics,”
Appl. Opt. , 37 3586
–3593
(1998). Google Scholar
J. M. Schmitt
and
G Kumar
,
“Optical scattering properties of soft tissue: a discrete particle model,”
Appl. Opt. , 37 2788
–2797
(1998). Google Scholar
B. Beauvoit
,
T. Kitai
, and
B. Chance
,
“Contribution of the mitochondrial compartment to the optical properties of rat liver: a theoretical and practical approach,”
Biophys. J. , 67 2501
–2510
(1994). Google Scholar
P. Sloot
,
A. Hoekstra
, and
C. Figdor
,
“Osmotic response of lymphocytes measured by means of forward light scattering: theoretical considerations,”
Cytometry , 9 636
–641
(1988). Google Scholar
M. Hammer
,
D. Schweitzer
,
B. Michel
,
E. Thamm
, and
A. Kolb
,
“Single scattering by red blood cells,”
Appl. Opt. , 37 7410
–7418
(1998). Google Scholar
A. Dunn
and
R. Richards-Kortum
,
“Three-dimensional computation of light scattering from cells,”
IEEE J. Sel. Top. Quantum Electron. , 2 898
–905
(1997). Google Scholar
A. Dunn
and
R. Richards-Kortum
,
“Finite-difference time-domain simulations of light scattering from single cells,”
J. Biomed. Opt. , 2 262
–266
(1997). Google Scholar
R. Drezek
,
A. Dunn
, and
R. Richards-Kortum
,
“Finite-difference time-domain computations and goniometric measurements of light scattering from cells,”
Appl. Opt. , 38 3651
–3661
(1999). Google Scholar
R. Drezek
,
A. Dunn
, and
R. Richards-Kortum
,
“A pulsed finite-difference time-domain (FDTD) method for calculating light scattering from biological cells over broad wavelength ranges,”
Opt. Express , 6 147
–157
(2000). Google Scholar
A. Doudkine
,
C. Macaulay
,
N. Poulin
, and
B. Palcic
,
“Nuclear texture measurements in image cytometry,”
Pathologica , 87 286
–299
(1995). Google Scholar
P. Bartels
,
D. da Silva
,
R. Montironi
,
P. Hamilton
,
D. Thompson
,
L. Vaught
, and
B. Bartels
,
“Chromatin texture signatures in nuclei from prostrate lesions,”
Anal Quant Cytol. Histol. , 20 407
–416
(1998). Google Scholar
R. Nordstrom
,
L. Burke
,
J. Niloff
, and
J. Myrtle
,
“Identification of cervical intraepithelial neoplasia using UV-excited fluorescence and diffuse reflectance tissue spectroscopy,”
Lasers Surg. Med. , 29 118
–127
(2001). Google Scholar
D. Ferris
,
R. Lawhead
,
E. Dickman
,
M. Holtzapple
,
J. Miller
,
S. Grogan
,
S. Bambot
,
A. Agrawal
, and
M. Faupel
,
“Multimodal hyperspectral imaging for the noninvasive diagnosis of cervical neoplasia,”
J. Lower Gen. Tract Dis. , 5 65
–72
(2001). Google Scholar
I. Boiko
,
M. Mitchell
,
D. Pandey
,
R. White
,
W. Hu
,
A. Malpica
,
K. Nishioka
,
C. Boone
,
E. Atkinson
, and
W. Hittleman
,
“DNA image cytometric measurement as a surrogate end-point biomarker in a phase I trial of alpha-difluoromethlyornithine for cervical intraepithelial neoplasia,”
Cancer Epidemiol. Biomarkers Prev. , 6 849
–855
(1997). Google Scholar
R. Drezek
,
T. Collier
,
C. Brookner
,
R. Lotan
,
A. Malpica
,
M. Follen
, and
R. Richards-Kortum
,
“Laser scanning confocal microscopy of cervical tissue before and after application of acetic acid,”
Am. J. Obstet. Gynecol. , 182 1135
–1139
(2000). Google Scholar
R. Barer
,
“Refractometry and interferometry of living cells,”
J. Opt. Soc. Am. , 47 545
–556
(1957). Google Scholar
A. Brunsting
,
“Differential light scattering from spherical mammalian cells,”
Biophys. J. , 14 439
–45
(1974). Google Scholar
R. Veltri
,
A. Partin
, and
M. Miller
,
“Quantitative nuclear grade (QNG): a new image analysis-based biomarker of clinically relevant nuclear alterations,”
J. Cell Biochem. Suppl. , 35 151
–157
(2000). Google Scholar
T. Dreyer
,
I. Knoblauch
,
A. Doudkine
,
C. MacAulay
,
D. Garner
,
B. Palcic
, and
C. Popella
,
“Nuclear texture features for classifying benign vs. dysplastic or malignant squamous epithelium of the larynx,”
Anal Quant Cytol. Histol. , 23
(3), 193
–200
(2001). Google Scholar
J. Thiran
and
B. Macq
,
“Morphological feature extraction for the classification of digital images of cancerous tissue,”
IEEE Trans. BME , 43 1011
–1020
(1996). Google Scholar
A. G. Hanselaar
,
N. Poulin
,
M. M. Pahlplatz
,
D. Garner
,
C. MacAulay
,
J. Matisic
,
J. LeRiche
, and
B. Palcic
,
“DNA-cytometry of progressive and regressive cervical intraepithelial neoplasia,”
Anal Cell Pathol. , 16 11
–27
(1998). Google Scholar
M. Campolat
and
J. Mourant
,
“High-angle scattering events strongly affect light propagation in clinically relevant geometries for light transport through tissue,”
Phys. Med. Biol. , 45 1127
–1140
(2000). Google Scholar
|
||||||||||||||||||||||||||||||||||||||||||||||||||||||||||||||||||||||||||||||||||||||||||||||||||||||||||||||||||||||||||||||||||||||||||||||||


CITATIONS
Cited by 248 scholarly publications and 6 patents.
Scattering
Light scattering
Refractive index
Tissues
Data modeling
Finite-difference time-domain method
Confocal microscopy


