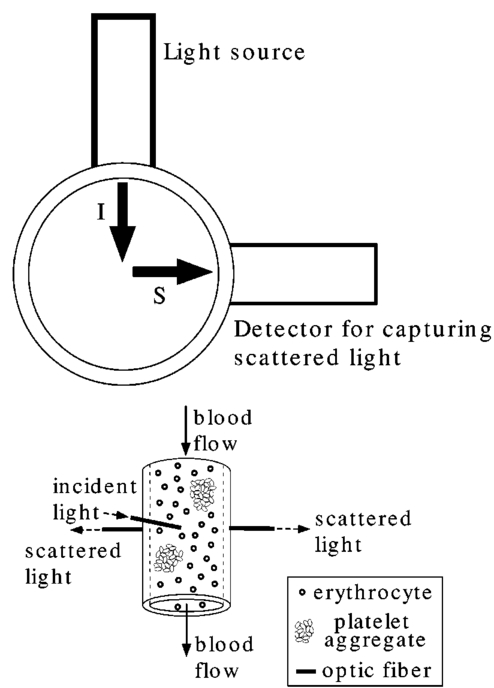
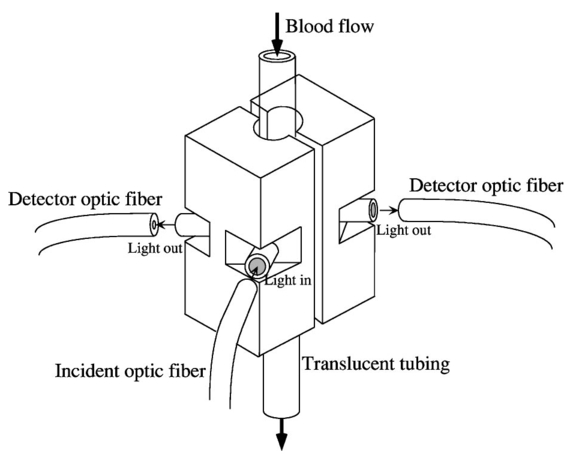
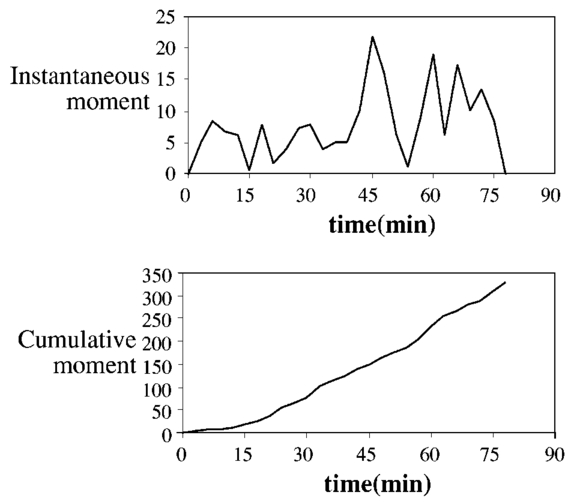
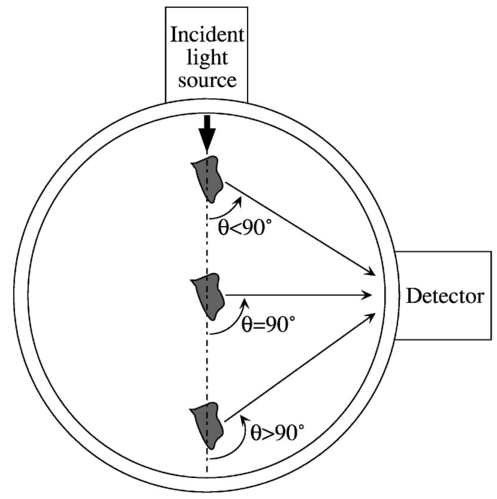
1.IntroductionAlthough the danger posed by microemboli was recognized over 100 years ago by German pathologist Robert Virchow, exploration of continuous, noninvasive techniques (non-blood-contacting) for the detection of microemboli in whole blood began only in the 1980s. Microemboli are pathogenic particulates in the blood stream composed of detached thrombi (“thromboemboli”), fragments of clotted blood, fat, atheroma, tissue or air bubbles. The impact of emboli is usually at a location distal to their point of origin and may be manifested as sudden organ failure (e.g., kidneys,1 cerebral complications,2 3 4 5 or limb ischemia6). Recent developments in microemboli detection technology have been aimed at (1) detection of emboli in clinical settings and (2) detection of thromboemboli in ex vivo (or in vitro) research studies aimed at understanding thromboembolic phenomena. One method of providing in vivo, continuous, and noninvasive detection of emboli involves directing pulse Doppler ultrasound signals into blood vessels and processing the echoes from emboli and red cells. In this method, the acoustic power backscattered from an embolus is measured and compared with that of the moving blood surrounding the embolus. The theory behind this technique may be found elsewhere.7 8 Several studies indicate that this is a viable technique for the detection of air emboli in clinical situations.9 10 11 Quantification of thromboemboli in vivo using this technique is more challenging since the echogenecity of thromboemboli is less than that of air emboli and is similar to that of blood, but recent attempts to detect thromboemboli in vivo using the ultrasound have met with some success.12 13 14 15 The method is unique in its ability to detect emboli noninvasively through opaque vessels and tissue; however, the instrumentation for this technique is cost-intensive (costing upward of $100,000). Moreover, it requires the subject to remain immobilized during the detection process, which could be challenging if the risk of thromboembolization spans hours to days. For emboli detection in in vitro and ex vivo systems, several economical alternatives to the ultrasound technique have emerged. These methods include postmortem assessment,16 use of a Coulter counter,17 use of a filtration method,18 19 20 and use of a light-scattering technique.21 22 23 24 25 Of these four methods, only the light-scattering technique is capable of continuous, noninvasive (non-blood-contacting) detection of thromboemboli in whole blood. This relatively inexpensive technique (manufacturing cost <$5,000) is capable of counting and sizing particles as small as 60 μm in blood flowing in a 1/16-in. ID-translucent tubing. This paper describes the characteristics and capabilities of the light-scattering microemboli detector (LSMD). The current configuration of the LSMD and the theoretical and empirical aspects of its calibration are presented. In addition, some of the experimental studies that have utilized this device are summarized. 2.System ConfigurationThe ability of the LSMD to detect thromboemboli in whole blood is based on the principles of differential light scattering. An incident beam of light that is directed through a translucent conduit carrying blood, is scattered by the red cells (and by platelets and white cells, but their contribution is insignificant due to their relatively small numbers in conjunction with small size), and by thromboemboli. The scattered light is cap-tured by detectors placed at specific angles to this incident beam (Figure 1). Based on the fact that the scattering from thromboemboli is distinct from that of the red cells, a light-scattering microemboli detection system was conceived by Reynolds and Simon25 in 1980 and improved on later at Brigham Young University to study various thromboembolic phenomena in undiluted whole blood. 2.1.HardwareIn the LSMD, light (830 nm) from a laser diode or a light-emitting diode (LED) is directed into flowing blood by mounting the incident light source, or an optic fiber from that source, against the wall of the blood conduit by means of a mounting probe (Figure 2). Detectors, or optic fibers connected to such detectors, are also mounted at specific angles to the incident light and collect the scattered light and convert it into current. In an older configuration, the low-current signals from the detectors were conveyed to transimpedance dynamic range amplifiers (Melles Griot, Boulder, Colorado) in which they were converted to voltage signals (±10 V) before being conveyed to and digitized by an analog-to-digital (A/D) data acquisition card within the computer, which stored and processed the data. In a more recent configuration, the photodiode detectors, amplifiers, and A/D conversion components are located on an integrated circuit (IC) board, and the digital signal (which is less affected by electronic noise) is transported via a cable to a laptop computer. This compact design greatly enhances the portability of the LSMD and significantly reduces the effects of extraneous electrical noise. Figure 2Configuration of the light scattering microemboli detection system: LS, light source (laser or LED); P, probe; IF, incident optic fiber; DF 1 and DF 2, detector optic fibers; PD 1 and PD 2, Photodiodes; A 1 and A 2, amplifiers; A/D, analog-to-digital conversion electronics. The dashed rectangle indicates the components located on an integrated circuit board in the most recent configuration.  An important electronic feature included in the LSMD is a high-pass filter to remove dc signal and very low frequency variations. Thus, the steady input due to background scattering by the blood is subtracted electronically, which helps to maximize the resolution of the dynamic signal and to minimize the effects of (steady) extraneous light (e.g., from the tubing wall near the light source). Another interesting feature of the LSMD related to electronics is a naturally occurring bias toward the center of the tubing through which the blood is flowing. This occurs because the sharpness of the “peak” (and the frequency of the signal) is highly dependent on the velocity of the embolus generating that peak. Those signals of highest frequency tend to be amplified more by electronic amplifiers, and the sharpest peak will be produced by emboli near the center of the tube (where the velocity is the highest). Light scattering near the tubing wall where velocities are very low produces low-frequency signals, which will be filtered out by the high-pass filter mentioned previously or simply will not be amplified as much as high-frequency signals. The probe is a structure that mounts the light source and detectors to the outside of the tubing through which the blood flows. Two probe designs with different angular configurations are currently used for the detection of thromboemboli in blood. 2.1.1.Ninety-deg ProbeThe light source and two detectors are positioned in a plane perpendicular to the tubing, with the detectors at right angles to the source. Figure 3 presents the probe design for the version using optic fibers, with three ports which are threaded to receive the SMA connectors of the optic fibers. Ninety-degree scattering provides an effective balance between scattered intensity and low sensitivity to scattering angle (described in detail in a subsequent section). This probe design is used in systems where the tubing inner diameter is 1/8″ or smaller. 2.1.2.One Hundred Eighty-deg ProbeFor tubing with an inner diameter larger than 1/8″, the 90-deg probe is ineffective, since the larger diameter would mean that scattered light must traverse greater distances through blood, and therefore undergo greater attenuation (discussed later), before reaching the detectors. Thus, a 180-deg probe was conceived in which the source and detectors were placed adjacent to each other such that the direction of detection was at an angle of 180 deg to the incident light.23 The probe also compresses the tubing to allow a cross section of blood to be examined by light scattering over relatively short distances. In the most recent configuration of the 180-deg probe, three incident-detector pairs are distributed across the diameter of the compressed tubing to increase the fraction of the blood being monitored for thromboemboli (Figure 4 presents the version using optic fibers). In the transport of light, each transition to a new phase with a different refractive index, including the unavoidable air gaps in light sources and detectors, results in a significant loss of energy. Therefore, in both the 90-deg and the 180-deg probes, the source and detectors, or the fibers attached to the same, are pressed against the tubing wall to provide a firm intimate contact to prevent the light from passing through yet another air gap. 2.2.Software2.2.1.Data ScreeningAcquired data are processed in two ways. First, a continuous real-time display of the incoming voltages is displayed in time increments of 500 ms, which enables convenient display of each increment as a full-screen frame. The relatively “smooth” baseline represents scattering due to red cells. The appearance of a distinct “sharp” peak indicates passage of an embolus (Figure 5). In the second way, each frame is evaluated for the presence or absence of peaks whose height exceeds a user-defined threshold height. If a frame contains such peaks, the frame is stored in memory for retrieval and analysis. Otherwise the data from that frame are discarded. 2.2.2.Data AnalysisIn each stored frame of data, the number of peaks (exceeding a user-specified threshold) and their average height are determined. Zheng et al.; showed that the peak height correlates with the diameter of the particle,26 so that the number and size of the emboli can be displayed in real time (Figure 6). The product of this average peak height and the total number of peaks in the specified time interval is called the instantaneous first moment. Thus, an instantaneous and a cumulative time profile of the first moment are generated and displayed in real time (typical traces are shown in Figure 7). 3.Mathematical Descriptions of Light Scattering Applied to the LSMDThe mathematical description of the light-scattering problem associated with large nonhomogeneities in blood is presented for the following reasons. First, the description of this instrument is not complete without considering the physical phenomena (and their mathematical representations), on which this instrument is based. Second, presenting (and applying) these fundamental descriptions enables the mathematical predictions to be compared with instrument calibration data to test some of the basic assumptions inherent in the use of the instrument. Third, evaluation of the mathematical formulations provides insight into the complexities of the nonideal phenomena measured by the actual instrument. 3.1.Mathematical DescriptionLight scattering in a medium densely populated with scatterers (such as red cells in blood) has been the subject of several theoretical analyses in the past.27 28 29 30 31 32 33 34 35 36 37 38 Most of these analyses arrive at theoretical solutions describing the scattered light flux in blood by approximating either Maxwell’s wave propagation equations32 33 34 35 36 or Boltzmann’s radiative transport equations.33 37 Developments based on the wave equations, such as Mie scattering (also known as the general theory of scattering for spheres), are typically used to analyze the light scattered by a single particle (such as a dilute solution of platelet aggregates in plasma), while variations of the transport equations are used to find the light scattered by a field of particles (such as red blood cells in whole blood). Thus, Mie theory can predict the scattering properties of a single particle based on the size and optical refractive index of that particle, while the transport equations use those single-particle properties, along with the geometry of the multiscattering environment, to predict the resultant distribution (intensity and direction) of scattering. To solve the transport equations to predict the amount of light that will be scattered by an embolus to detectors at a particular location, both the red cell and embolus scattering properties must be known. The scattering characteristics of red cells are well characterized (see Table 1). However, this is not true of an embolus, because scattering by an embolus is a function of the refractive index, wavelength of light, particle size, and particle shape. Because thromboemboli are irregular in composition, size, and shape, their scattering characteristics have not been characterized. Therefore, solutions to the transport equations can be obtained only through using wave theory to estimate the scattering properties. The only solution to wave theory currently available that is useful for thromboemboli (Mie theory) requires that the embolus be spherical in shape (such as the microspheres used for calibration). Table 1
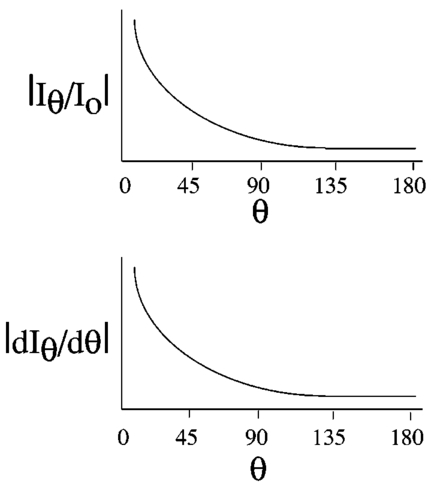
Two types of parameters are typically used to characterize scattering: cross sections and phase functions. The microscopic scattering cross section (σs) describes the intensity of light scattered per incident flux, and the microscopic absorption cross section (σa) is the intensity of light absorbed per incident flux. The macroscopic cross sections describe the amount of scattering for a field of scatterers and are related to the microscopic cross sections by multiplying by the number density of particles. Physically, the macroscopic cross section is the inverse of the mean free path, which is the distance between interactions. Also, the transport cross section (Σ tr ) describes the attenuation of light by scattering and adsorption (a high value of Σ tr indicates high attenuation). Finally, the phase function is the fraction of light scattered to a particular direction. Therefore, the scattering cross sections give the total light scattered, and the phase functions give the directionality of the scattering. Another parameter used to characterize scattering is the anisotropy (μ¯), which expresses the nonuniformly of the scattering phase function (i.e., the asymmetry of the scattering distribution). A value of anisotropy near 0 indicates that the light is scattered uniformly in all directions. A value of anisotropy near 1 (such as with red blood cells) indicates heavy forward scattering, and a value of anisotropy near −1 means that there is mostly backscattering. The transport equations are based on a particle balance, or for light, a photon balance. The total amount of light in a control volume is equated to the net light entering the control volume plus the light emitted by sources inside the control volume minus the light absorbed inside the control volume. With light, all photons have the same kinetic energy, so the transport equation can be simplified to Eq. (1) (the one-speed transport equation36). whereI = light intensity flux (energy/area.time) c = speed of light (3.00×10¹⁰ m/s) t = time Ω^ = unit vector in the direction of scattering Ω^′ = unit vector (integrated over all directions) Σt = macroscopic total cross section (length −1) r = vector position of the scatterer Σs = macroscopic scattering cross section (length −1) f = phase function s = source term [energy/(volume)(time)]. s = source term for Eq. (1) [energy/(area)(time)] z = distance from the boundary of the control volume to the embolus Ω^ = unit vector in the direction of scattering Ω^0 = unit vector in the incident direction Σss = macroscopic cross section for the embolus (length −1) fs = phase function for the embolus I0 = intensity flux at the control volume boundary [energy/(area)(time)] Σ tr = transport cross section for the red blood cells (length −1) . Red blood cells scatter very heavily in the forward direction, as reflected by their μ¯ value (0.9937). Because of this high anisotropy, the phase function can be described by the transport approximation [Eq. (4)], which assumes a low isotropic scattering in all directions overlaid by a high scattering into the forward direction [scattering angle of 0-deg (Ref. 35)]. where δ is the delta function, μ¯ is the anisotropy, and other symbols are as already defined.An alternative simplification for the phase function was proposed by Reynolds and McCormick27 in the form of a two-parameter phase function: where and μ is defined as before. Reynolds and McCormick proposed approximate values of g and α from analytical calculations.Mie theory can be used to find the microscopic cross sections and phase functions for various sizes of spherical thromboemboli. Then, the microscopic scattering cross section can be transformed into the macroscopic cross section to be used in the source term of the transport equation. The solution to the Mie theory equations is a complicated function of Bessel functions and infinite series and is described elsewhere.37 When the particle diameter is close to the wavelength of light or larger, as is the case with microemboli detection, Mie theory predicts a scattering intensity whose magnitude is a very sensitive function of scattering angle and particle diameter. When the particle size is much smaller than the wavelength, Rayleigh theory provides a good simplification that is not as sensitive to angle or size. In addition to depending on particle diameter and refractive index and on light wavelength, the phase function for thromboemboli is especially dependent on scattering angle in the forward direction (θ∼0 to 45 deg), while at larger angles (45 to 180 deg), the scattering is much less angle dependent27 (Figure 8). The current design of the LSMD probe for small-diameter tubing [interior diameter (ID) ⩽1/8″] is based primarily on 90-deg scattering (i.e., the detectors are oriented at 90 deg from the direction of the incident light). Although the intensity of scattered light is less at 90 deg than in a near-forward direction, the angular dependence of scattering intensity is low at 90 deg, which helps to minimize the effect of particle position on scattering intensity. In reality, the scattering angle is a function of the position of the particle in the tube. Even when the particles pass the axial position of the light source and detector, the scattering angle will only be 90 deg for particles at the center of the tubing. For example, for particles positioned closer to the light source, the scattering angle will be smaller than 90 deg (measured from the line of forward scattering), and for particles located near the other side of the tube, the angle will be greater than 90 deg (Figure 9). Thus, the design angle of 90 deg in the LSMD probe takes advantage of the lower angular dependence near 90 deg to accommodate more easily the range of actual scattering angles. 3.2.Application to the Calibration ProcessTo describe the calibration of the LSMD using microspheres, a computer model (written in C++ on a Unix workstation) was used to simulate the scattering of red blood cells and an embolus in a cylindrical scattering volume. The red blood cells were approximated as spheres (volume=90.97 μm 3) in a simple cubic distribution inside a cylindrical tube of 1/16″ ID or 1/32″ ID (both with 1/32″ wall thickness). In addition, a light source was modeled as a beam originating at the outer wall of the tube with an original diameter of 600 μm, an original power of 15 mW, and a divergence angle of 21.72 deg (corresponding to an optical fiber numerical aperture of 0.37). The computer calculated the quantity of light reaching a circular area at a 90-deg angle from the light source, also on the outer wall of the tubing (corresponding to a photodetector at that location) with a diameter of 600 μm and an acceptance angle of 21.72 deg. For each red blood cell positioned within both the divergence cone of the incident beam and the acceptance cone of the detector fiber, the quantity of light contributed by that cell to the detector was calculated. That calculation was made using the two-parameter phase function of Reynolds and McCormick.27 Approximate values for the parameters for this function, g and α, were proposed by Reynolds and McCormick for several kinds of blood cells, including red cells. However, the results of this calculation were found to be sufficiently sensitive to the values of g and α as to necessitate their experimental determination. This was done by placing samples of human blood of various hematocrit values, ranging from 10 to 50, into LSMD cuvettes using tubing with inner diameters of 1/32 and 1/16″ (both with 1/32″ wall thickness) and measuring the power reaching the photodetector. The values of g and α were varied until the predicted power reaching the detector matched the experimental results (Table 2). For the microscopic and macroscopic cross sections of red blood cells, the values in Table 1 were used (which are for a wavelength of 800 nm but were assumed to be valid for 830 nm, at which the current version of the LSMD operates). Table 2
Using the experimentally determined values of g and α to compute the phase function for red blood cells [Eq. (5)], the effect of a spherical microsphere on the light scattering in the illuminated volume was calculated. The light scattering from the microspheres was calculated using Mie scattering equations, which were solved using logarithmic derivative functions and recursion formulas (as found in Kerker37). The infinite series in the Mie scattering equations were terminated using the criteria suggested by Denman et al.;38 One of the Ricatti-Bessel functions (ψ in Kerker37) was calculated using a top-down recursion (as per Denman et al.;38), and to minimize error in the recursion, this procedure was normalized to the other Ricatti-Bessel function by finding the ratio between the ψ0 found by the recursion and the known relation: ψ0=sin[(π)diameter/wavelength]. The Mie scattering calculations were performed using the commercial software Mathcad 2000 Professional (MathSoft, Inc., Cambridge, Massachusetts). Using the cross sections derived from the Mie calculations, the transport equation was solved in the C++ program for the calibration of the LSMD using the following assumptions:
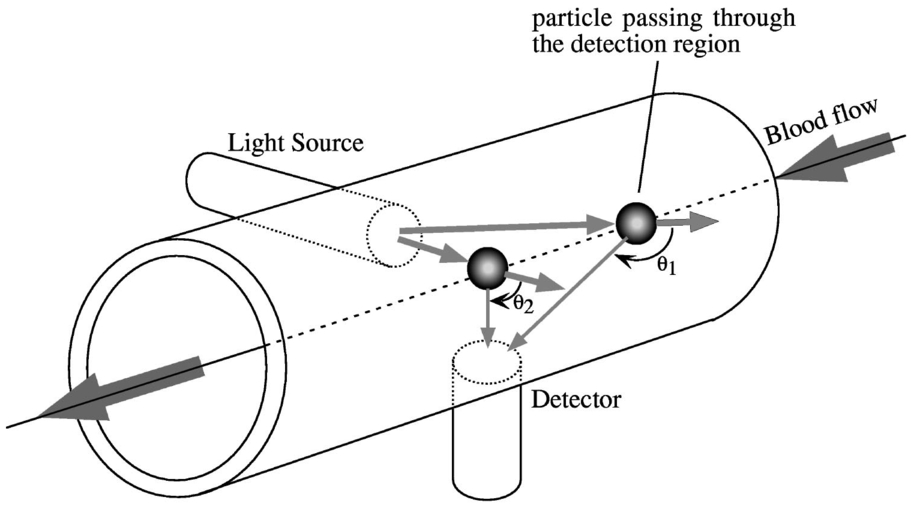
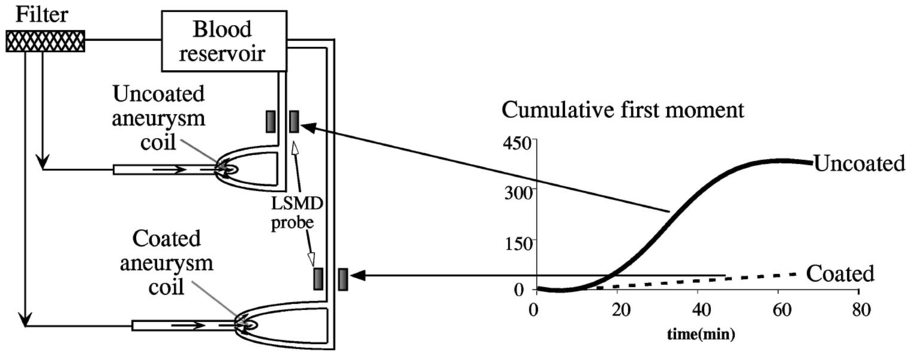
As an embolus travels through the scattering volume, the scattering angle defined by the incident beam, embolus, and detector passes through a range of values from 90 to 180 deg (Figure 10). Since the Mie scattering phase function is multilobed, the scattering intensity will also be multilobed, with the pattern varying with sphere diameter. But as the embolus passes through the illuminated volume, the height of the observed peak will be defined by the highest lobe (which will be found near, but not necessarily at, the angle of 90 deg). Thus, to find that peak height for each sphere diameter, the largest lobe of the light-scattering solution was found by testing the Mie scattering equations at different scattering angles. The maximum scattering powers and the corresponding angles were used to model the light scattering from microspheres flowing through the LSMD cuvette. Thus, the total power reaching the detector was computed for each combination of sphere and surrounding red cells, and a plot of scattering power versus microsphere diameter was created. Figure 11 shows the experimentally-obtained peak heights for microspheres of various sizes (from Ref. 26) along with the predictions from the computer model, all for 1/16″ tubing. Numerical instabilities prevented the convergence of the Mie scattering equations for microspheres larger than 400 μm and appeared to affect the solutions for the 350- and 400-μm microspheres. But the similar overall shape of the predicted and experimental curves supports the value of the model. It also supports the validity of the calibration process and the assumption that the scattered intensity depends on particle size. Figure 11Experimental (from Ref. 26) and predicted light scattering results for polystyrene microspheres (90-deg probe, 1/16″ ID tubing) in flowing blood.  The use of polystyrene microspheres to calibrate the light-scattering device for detecting platelet aggregates is obviously an imperfect technique. The complexity of light scattering and its dependence on particle shape means that a sphere may be only an approximate representation of an actual embolus. But thromboemboli are irregularly shaped, with variations in angles, light-scattering pathways, and possibly refractive indices associated with the irregular surface. These variations in properties are expected to alter the intensity of scattered light as the particle rotates and translates through the scattering volume. The varying intensity of scattered light is summed or “integrated” to produce the overall “peak” that results from the complete passage of the embolus. Thus, the embolus “size” must be interpreted via the calibration curve in terms of an “effective” diameter. Further, the refractive index of polystyrene microspheres (1.59) differs from that of platelets (1.38), and microemboli likely exhibit a range of refractive indices as they vary in their content of fibrin, trapped red cells, etc., making any single value only approximate as a calibration standard. 4.Application of the LSMDThe LSMD was used to extend the value of in vitro and ex vivo models for studying platelet aggregation and thromboembolic phenomena. Historically, in vitro and ex vivo studies have provided valuable information vis-a`-vis the hemocompatibility of medical devices. However, such studies mostly assessed the thrombogenic potential of a given device (i.e., the amount of thrombus accumulated on the surface), but could not account for thromboembolism (i.e., the release of all or part of the thrombus from the surface). This shortcoming was primarily due to the absence of an instrument that could monitor thromboemboli. The LSMD corrects this shortcoming; it can be used for on-line noninvasive (non-blood-contacting) monitoring of thromboemboli continuously and in real time in both in vitro and ex vivo configurations. This section describes some of the in vitro and ex vivo models that have benefited from the LSMD. 4.1.Device-Induced Thromboembolism in a Bovine in vitro ModelThe LSMD was been used in an in vitro model with bovine blood to assess various aspects of device-induced thromboemboli (TE).39 40 41 42 In this model, heparinized bovine blood was gravity-fed from one or more reservoirs through 1/8″ ID PVC tubing in which coronary stents were deployed, and LSMD probes monitored the thromboemboli released from the stents. In one study using this model, the LSMD demonstrated that a new antiplatelet drug (tirofiban) almost completely abolished39 stent-induced TE. Another study demonstrated the dynamic nature of TE and showed that the time-dependent impact of a therapeutic regimen could be assessed more comprehensively by continuously monitoring thromboemboli using41 the LSMD. Also in that study, dipyridamole (an antiplatelet drug) had a negligible effect on stent thrombosis but reduced thromboembolism by 52, demonstrating that the effects of drugs on thrombosis and thromboembolism may be different and that both aspects must be examined to draw appropriate conclusions about the efficacy of the therapeutic regimen. The LSMD provides a means to make such assessments. The LSMD has been used in a similar in vitro model to demonstrate and explore the effects of hemodynamics40 42 on TE. One study demonstrated the synergistic contributions of secondary flows (in this case stenosis-induced flow normal to the surface) and surface-induced activation (in this case, rough surfaces).40 Similarly, other studies using the LSMD demonstrated that secondary flows (again, flow normal to the surface induced by upstream and/or downstream stenoses) increased stent-induced40 TE. Thus, the LSMD is useful in furthering our understanding of various factors that may influence the onset and progression of TE in blood-contacting devices, and hence help fine-tune their design. 4.2.Hemodynamics and Thromboembolism in a Human in Vitro ModelAn in vitro model has also been developed to study the influence of hemodynamics on TE using human blood.43 In this model, fresh heparinized human blood was directed in a single pass through 1/32″ ID PE tubing containing a “flow cell” consisting of alternating abrupt expansions and contractions. TE released from the flow cell were detected continuously by the LSMD. Preliminary experiments indicated that significantly more TE were detected downstream of the flow cell than were detected upstream, indicating that the flow cell was the primary source of TE, and comprehensive investigations regarding the link between hemodynamics and TE using this model are currently underway. 4.3.Aneurysm Stabilization Coils (Bovine in Vitro Model)One strategy to stabilize bifurcation aneurysms is to place tightly wound coils at the site of the aneurysm. The intent is to promote platelet adhesion, thrombosis, and clot formation, which are intended to mechanically fill and stabilize the aneurysm. However, increased platelet adhesion and clotting on the coils may lead to undesirable TE from the coils. The optimal situation is one in which there is some aneurysm-stabilizing thrombosis without significant thromboembolism. One way to achieve this is by protecting the coils with a coating that retards TE. The efficacy of one such coating was tested using the LSMD in an in vitro configuration. The coils (coated or uncoated) were placed in simulated bifurcation aneurysms made of polyurethane, and 90-deg LSMD probes were placed distal to the simulated aneurysm (Figure 12). TE data recorded by the LSMD suggested that the coated coils shed significantly fewer TE compared with the uncoated coils (Figure 12). Thus, the LSMD proved useful in assessing the efficacy of a surface coating in the aneurysm test model. 4.4.Ovine ex Vivo StudiesIn recent studies, the LSMD was placed downstream of coronary stents deployed in an arterioarterial ovine ex vivo shunt model to study44 stent-induced TE. It was found that higher levels of heparin (an anticoagulant) consistently inhibited stent-induced thromboembolism, while tirofiban (an antiplatelet agent), when administered in conjunction with heparin, completely abolished thrombosis as well as thromboembolization. These studies suggest that the LSMD is a useful tool for the assessment of stent-induced TE and its pharmacological attenuation in ex vivo situations; such studies may eventually prove useful in optimizing stent design and use of prophylactic and therapeutic anticoagulant/antithrombotic/thrombolytic regimen in clinical situations. Another interesting observation in this ex vivo model was the link between flow fluctuations (caused by varied activity of the animal) and thromboembolic events. Sudden increases in flow rate were found to associate with incidents of thromboembolism,44 once again confirming the important role of fluid mechanics in the dynamics of thromboembolism. 4.5.Thromboembolism from Pulsatile Blood Pumps in a Bovine ex Vivo ModelThe LSMD was used to study thromboembolic events from left-ventricular assist devices (LVADs) in a bovine ex vivo model.21 22 23 24 In one such study, it was found that LVADs generated detectable thromboemboli whose number and size were maximum between 30 and 60 min following implantation of the LVAD. These studies showed that the LSMD may prove useful in the design, optimization, and postoperative management of patients with LVADs. 5.ConclusionsThe light-scattering microemboli detector has evolved into a relatively inexpensive yet versatile research tool for the assessment of thromboembolic phenomena in a variety of test conditions. The ability to continuously and noninvasively detect and quantify TE in whole blood offers a new and innovative approach to assess (1) the thrombogenic potential of blood-contacting prosthetic devices and (2) the efficacy of existing and emerging antithrombotic regimen in a manner not possible until now. Thus, the LSMD has the potential to revolutionize the study of blood-material interaction and may become a standard tool to assess the safety and effectiveness of artificial devices that contact blood. 6.Future DirectionsThe current software is not equipped to automatically differentiate between TE and strong flow eddies. This limits the use of LSMD in highly turbulent situations and very pulsatile flows. Signal-processing algorithms will be formulated in the future to automatically subtract the effects of flow eddies and pulses, and thus distinguish embolic signal from the background more effectively. Kim developed a method for differentiating between microemboli based on their composition and the ratio of light scattered at 5- and 20-deg angles.35 The difference in refractive indices enabled him to differentiate between air, polystyrene microspheres, and TE. This capability will be incorporated into the current design of the LSMD to increase the diagnostic power available to surgeons by enabling them to distinguish between air bubbles and TE during cardiopulmonary bypass. REFERENCES
G. D. Spoelhof
and
C. J. Farchmin
,
“Renal emboli and atrial septal aneurysm,”
J. Fam. Pract. , 42 519
–522
(1996). Google Scholar
J. J. O’Brien
,
J. Butterworth
,
J. W. Hammon
,
K. J. Morris
,
J. M. Phillips
, and
D. A. Stump
,
“Cerebral emboli during cardiac surgery in children,”
Anesthesiology , 87 1063
–1069
(1997). Google Scholar
A. R. Woolfenden
,
M. W. O’Brien
,
R. E. Swartzberg
,
A. M. Norbash
, and
D. C. Tong
,
“Diffusion-weighted MRI in transient global amnesia precipitated by cerebral angiography,”
Stroke , 28 2311
–2314
(1997). Google Scholar
S. Konno
,
J. S. Meyer
,
Y. Terayama
,
G. M. Margishvili
, and
K. F. Mortel
,
“Classification, diagnosis and treatment of vascular dementia,”
Drugs Aging , 11 361
–373
(1997). Google Scholar
S. K. Braekken
,
D. Russell
,
R. Brucher
,
M. Abdelnoor
, and
J. L. Svennevig
,
“Cerebral microembolic signals during cardiopulmonary bypass surgery. Frequency, time of occurrence, and association with patient and surgical characteristics,”
Stroke , 28 1988
–1992
(1997). Google Scholar
P. Vignon
,
P. Gueret
,
B. Francois
,
C. Serhal
,
V. Fermeaux
, and
J. Bensaid
,
“Acute limb ischemia and heparin induced thrombocytopenia: the value of echocardiography in eliminating a cardiac source of arterial emboli,”
J. Am. Soc. Echocardiogr. , 9 344
–347
(1996). Google Scholar
A. A. Moehring
, and
J. R. Klepper
,
“Pulse Doppler ultrasound detection, characterization and size estimation of emboli in flowing blood,”
IEEE Trans. Biomed. Eng. , 41 35
–44
(1994). Google Scholar
A. A. Moehring
and
J. A. Ritcey
,
“Sizing emboli in blood using pulse Doppler ultrasound—I: verification of the EBR model,”
IEEE Trans. Biomed. Eng. , 43 572
–580
(1996). Google Scholar
D. G. Grosset
,
D. Georgiadis
,
A. W. Kelman
,
P. Cowburn
,
S. Stirling
,
K. R. Lees
,
A. Faichney
,
A. Mallinson
,
R. Quin
,
I. Bone
,
L. Pettigrew
,
E. Brodie
,
T. MacKay
, and
D. J. Wheatley
,
“Detection of microemboli using transcranial Doppler ultrasound,”
Tex Heart Inst. J. , 23 289
–292
(1996). Google Scholar
H. L. Edmonds Jr.
,
R. A. Rodriguez
,
S. M. Audenaert
,
E. H. Austin III
,
S. B. Pollock Jr.
, and
B. L. Ganzel
,
“The role of neuromonitoring in vascular surgery,”
J. Cardiothorac Vasc. Anesth. , 10 15
–23
(1996). Google Scholar
G. Deklunder
,
A. Prat
,
J. L. Lecroart
,
M. Roussel
, and
M. Dauzat
,
“Can cerebrovascular microemboli induce cognitive impairment in patients with prosthetic heart valves?,”
Eur. J. Ultrasound , 7 47
–51
(1998). Google Scholar
C. A. Giller
,
A. M. Giller
, and
F. Landreneau
,
“Detection of emboli after surgery for intracerebral aneurysms,”
Neurosurgery , 42 490
–494
(1998). Google Scholar
D. Barbut
,
F. S. Yao
,
Y. W. Lo
,
R. Silverman
,
D. N. Hager
,
R. R. Trifiletti
, and
J. P. Gold
,
“Determination of size of aortic emboli and embolic load during coronary artery bypass grafting,”
Ann. Thorac. Surg. , 63 1262
–1267
(1997). Google Scholar
N. Lennard
,
J. L. Smith
,
P. Hayes
,
D. H. Evans
,
R. J. Abbott
,
N. J. London
,
P. R. Bell
, and
A. R. Naylor
,
“Transcranial Doppler directed dextran therapy in the prevention of carotid thrombosis: three hour monitoring is as effective as six hours,”
Eur. J. Vasc. Endovasc. Surg. , 17 301
–305
(1999). Google Scholar
M. M. Thompson
,
J. Smith
,
A. R. Naylor
,
A. Nasim
,
R. D. Sayers
,
J. R. Boyle
,
J. Thompson
,
K. Tinkler
,
D. Evans
,
G. Smith
, and
P. R. Bell
,
“Microembolization during endovascular and conventional aneurysm repair,”
J. Vasc. Surg. , 25 179
–186
(1997). Google Scholar
M. K. Dewanjee
,
G. N. Palatianos
,
M. Kapadvanjwala
,
L. C. Hsu
,
S. Novak
,
G. Balantino
,
A. N. Serafini
,
W. D. Datrich
, and
G. N. Sfakianakis
,
“Neutrophil dynamics and retention in lung, oxygenator, and arterial filter during cardiopulmonary bypass in a pig model,”
ASAIO J. , 40 M547
–M553
(1994). Google Scholar
K. Konstantopoulos
,
J. C. Grotta
,
C. Sills
,
K. K. Wu
, and
D. J. Hellums
,
“Shear-induced platelet aggregation in normal subjects and stroke patients,”
Thromb. Haemostasis , 74 1329
–1334
(1995). Google Scholar
K. A. Solen
,
S. F. Mohammad
,
A. J. Pijl
,
P. Swier
,
R. D. Monson
, and
D. B. Olsen
,
“Detection of microemboli by constant-pressure filtration during in vitro circulation of bovine and human blood,”
Artif. Organs , 14 466
–470
(1990). Google Scholar
K. A. Solen
and
J. V. White
,
“Correlation between chemical stimulation and filtration flow resistance in human platelets,”
Thromb. Haemostasis , 46 649
–658
(1987). Google Scholar
R. L. Swank
,
J. G. Roth
, and
J. Jansen
,
“Screen filtration pressure method and adhesiveness of aggregation of blood cells,”
J. Appl. Physiol. , 19 340
–346
(1964). Google Scholar
K. A. Solen
,
S. F. Mohammad
,
G. L. Burns
,
G. M. Pantalos
,
J. Kim
,
Y. Peng
,
W. G. Pitt
,
L. O. Reynolds
, and
D. B. Olsen
,
“Markers of thromboembolization in a bovine ex vivo left ventricular assist device model,”
ASAIO J. , 40 M602
–M608
(1994). Google Scholar
L. O. Reynolds
,
S. F. Mohammad
,
K. A. Solen
,
G. M. Pantalos
,
G. L. Burns
, and
D. B. Olsen
,
“Light scattering detection of microemboli in an extracorporeal LVAD bovine model,”
ASAIO Trans. , 36 M518
–M521
(1990). Google Scholar
L. O. Reynolds
,
K. A. Solen
,
S. F. Mohammad
,
G. M. Pantalos
, and
J. Kim
,
“Differential light scattering cuvettes for the measurement of thromboemboli in high shear blood flow systems,”
ASAIO Trans. , 36 M185
–M188
(1990). Google Scholar
K. A. Solen
,
S. F. Mohammad
,
L. O. Reynolds
,
G. M. Pantalos
,
P. Swier
,
G. Drumm
,
G. L. Burns
, and
D. B. Olsen
,
“Characterization of blood microemboli associated with ex vivo left ventricular assist devices in a bovine model,”
ASAIO Trans. , 35 370
–372
(1989). Google Scholar
L. O. Reynolds
and
T. Simon
,
“Size distribution measurements in microaggregates in stored whole blood,”
Transfusion (Bethesda, MD) , 20 669
–678
(1980). Google Scholar
Y. Zheng
,
S. F. Mohammad
, and
K. A. Solen
,
“The light scattering whole blood aggregometer: a novel device for assessment of platelet aggregation in undiluted blood,”
Arch. Pathol. Lab Med. , 122 880
–886
(1998). Google Scholar
L. O. Reynolds
and
N. J. McCormick
,
“Approximate two-parameter phase function for light scattering,”
J. Opt. Soc. Am. , 70 1206
–1212
(1980). Google Scholar
A. Ishimaru
,
“Correlation functions of a wave in a random distribution of stationary and moving scatterers,”
Radio Sci. , 10 45
–52
(1975). Google Scholar
N. Anderson
and
P. Sekejl
,
“Light-absorbing and scattering properties of nonhaemolysed blood,”
Phys. Med. Biol. , 12 173
–184
(1967). Google Scholar
V. Twersky
,
“Absorption and multiple scattering by biological suspensions,”
J. Opt. Soc. Am. , 60 1084
–1093
(1970). Google Scholar
M. Graber
and
A. Cohen
,
“Multiple scattering: theoretical calculations compared with experimental dye-laser measurements,”
J. Opt. Soc. Am. , 65 1306
–1310
(1975). Google Scholar
E. Loewinger
,
A. Gordon
,
A. Weinreb
, and
J. Gross
,
“Analysis of a micromethod for transmission oximetry of whole blood,”
J. Appl. Physiol. , 19 1179
–1184
(1964). Google Scholar
S. Sukavaneshvar
,
K. A. Solen
, and
S. F. Mohammad
,
“Device-induced thromboembolism in a bovine in-vitro coronary stent model: evaluation using pharmacological agents,”
ASAIO J. , 44 M393
–M396
(1998). Google Scholar
S. Sukavaneshvar
,
G. M. Rosa
, and
K. A. Solen
,
“The effects of hemodynamics on thromboembolism in coronary stents and prototype flow cells in vitro,”
ASAIO J. , 44 M388
–M392
(1998). Google Scholar
S. Sukavaneshvar
,
K. A. Solen
, and
S. F. Mohammad
,
“An in-vitro model to study device-induced thrombosis and embolismml: evaluation of the efficacy of Tirofiban, Aspirin, and Dipyridamole,”
Thromb. Haemostasis , 83 322
–326
(2000). Google Scholar
S. Sukavaneshvar
,
G. M. Rosa
, and
K. A. Solen
,
“Thrombosis and embolism in a stenosis-stent model: contribution of hemodynamics,”
Ann. Biomed. Eng. , 28
(2), 182
–193
(2000). Google Scholar
P. Goodman
,
M. Hall
,
S. Sukavaneshvar
, and
K. Solen
,
“An in-vitro model for studying the effects of hemodynamics on device-induced thromboembolism in human blood,”
ASAIO J. , 46 576
–578
(2000). Google Scholar
S. Sukavaneshvar
,
Y. Zheng
,
G. Rosa
,
F. Mohammad
, and
K. Solen
,
“Thrombo-embolization associated with sudden increases in flow in a coronary stent ex-vivo shunt model,”
ASAIO J. , 46 301
–304
(2000). Google Scholar
|
||||||||||||||||||||||||||||||||||||||||||


CITATIONS
Cited by 14 scholarly publications and 3 patents.
Light scattering
Scattering
Blood
Mie scattering
Sensors
Particles
In vitro testing


