1.IntroductionThe effort to develop medical imaging methods based on the transmission of optical radiation is motivated by their potential to reveal functional information, such as tissue oxygenation. The technique of imaging through several centimeters of tissue, where transmitted light is overwhelmingly influenced by scatter, has become known as optical tomography, and various technologies and theoretical treatments are being applied to its practical realization.1 2 Some current optical tomography systems are based on straightforward measurements of transmitted intensity.3 4 However, the inability to separate the effects of absorption from those of scatter,5 and the overwhelming dependence of intensity on surface coupling, have led many investigators to develop instruments that perform measurements in the time6 7 8 9 10 or frequency11 12 13 domain. The former measure the temporal distribution of photons transmitted between points on the surface in response to illumination by an impulse of light, while the latter determine the modulation amplitude and phase delay in response to an intensity-modulated signal. Research groups are pursuing various potential applications, with particular emphasis on brain imaging and means of detecting breast disease. At University College London (UCL), a 32-channel time-domain system has been constructed based on time-correlated single-photon-counting (TCSPC) instrumentation. The system, known as MONSTIR (multichannel optoelectronic near-IR system for time-resolved image reconstruction), is described in detail by Schmidt et al.;10 Briefly, the tissue is illuminated by a beam of picosecond pulses via a series of optical fibers, and transmitted light is collected simultaneously by 32 detector fiber bundles. These deliver the light to four 8-anode microchannel-plate photomultiplier tubes (MCP-PMTs) via 32 variable optical attenuators (VOAs), which ensure that the intensity of detected light does not saturate or damage the MCP-PMTs. Each detected photon results in an electronic pulse whose arrival time is measured with respect to a laser-generated reference signal, and histograms of photon flight times (the so-called temporal point spread functions, or TPSFs) are accumulated. Our approach to image reconstruction is based on an assumption that TPSFs measured between a finite set of points on the surface contain sufficient information to reconstruct the internal distribution of scattering and absorbing properties. The reconstruction package known as TOAST (temporal optical absorption and scattering tomography) determines the parameters that describe an appropriate model of photon migration within the object (known as the forward model) by comparing its predictions with the measured data.14 The model is then adjusted iteratively to minimize the difference between the two. To decrease computational complexity, TOAST does not utilize entire TPSFs for reconstruction. Instead, the forward model derives various data types, representing characteristics of the TPSF, directly. Consequently, preparing data for image reconstruction involves extracting these data types from the measured data, and supplying TOAST with the positions of each source and detector. It is essential to extract data types from the measured TPSFs that are sufficiently free from systematic sources of noise and uncertainty to provide a good correspondence with those calculated by the forward model. Despite careful design to optimize temporal stability and minimize electrical interference, MONSTIR will always have a finite impulse response, and certain sources of noise will remain. The inherent temporal characteristics of 32 detecting channels of MONSTIR are not only different from each other, but can vary over a period of time. The effect of this variability can be largely eliminated by performing appropriate temporal calibration measurements immediately before or after each data acquisition. The fixed, channel-dependent variation arises due to differences between the lengths and dispersion properties of detector fiber bundles and electronic cables, and between the pulse-sampling characteristics of electronic components. Similarly, differences in the lengths of source fibers contribute toward a source-dependent offset in each TPSF measurement. MONSTIR has been used to acquire images of a variety of tissue-equivalent phantoms10 15 16 17 and the human forearm.18 Previously, we explored two approaches to data calibration. Two-dimensional (2-D) experiments involving sources and detectors confined to a single circular ring have employed a so-called calibration tool consisting of a clear resin cylinder in which a small scattering target is embedded, attached to an optical fiber. The ring is placed around the tool, with the target centered in the plane of the ring. As described by Hillman et al.;,19 the tool is used for two tasks known as the source and detector calibrations: (1) calibration for differences in source fiber properties is achieved by illuminating the target with each source in turn, with a single detector coupled to the target, and (2) the variation in detector characteristics is calibrated by delivering a beam of pulses to the target and collecting the emitted light with each detector bundle. Finally, an absolute calibration measurement is obtained that involves recording a single TPSF when just one source is connected directly to one detector. A combination of the three calibration measurements is sufficient to perform a full temporal calibration of experimental data acquired with the system. However, a major drawback of this approach is the requirement to frequently transfer the sources and detectors from the object under investigation to the calibration phantom, and back again. If the object does not have the same geometry as the calibration phantom, this transfer could become particularly time consuming, and would therefore undermine the effort to calibrate for any temporal instability of the system. The second approach to calibration was to employ a reference phantom, which has the same geometry as the object of interest but is homogenous with known optical properties. In this case, the holder containing all the sources and detectors is transferred from the object to the homogenous phantom. Identical measurements are performed on each, and images are reconstructed using relative rather than absolute datatypes. No other calibration is required. Although the method is applicable to sources and detectors in any configuration, it has two drawbacks. First, it is still necessary to physically transfer the sources and detectors back and forth relatively frequently to ensure good temporal calibration. And second, provision of a reference phantom for an arbitrary geometry is not trivial. These drawbacks are likely to be of particular significance when obtaining data from the heads of premature infants in intensive care, the principal clinical target for which MONSTIR was designed. In the following section, an alternative method of temporal calibration is introduced that does not require the use of a reference phantom, and can be performed frequently with the sources and detectors in situ on the surface of the object. 2.MethodA new method of calibrating time resolved data acquired using MONSTIR was inspired by an approach reported by Eda et al.;7 They describe a 64-channel time-resolved optical imaging system that employs detector fiber bundles into which single-source fibers have been integrated. The source fiber set into the center of the bundle irradiates the object, while the surrounding fibers collect the diffusely reflected light. The investigators report that they use the “detected reflected light pulse directly from the object surface . . . to define the time of the pulse incidence.” This involves an implicit assumption that the measurement of the time of arrival of the back-reflected pulse is a good approximation for the mean flight time measured if the source and detector were held in contact. If a similar assumption can be made for the entire shape of the TPSF, then applying this method to MONSTIR would provide a means of acquiring 32 absolute calibrations. A full calibration of the imaging system could then be achieved by performing just one other measurement: a source calibration using the calibration tool, which accounts for the differences in the lengths and dispersing properties of the source fibers. Fortunately these properties do not change over the duration of an experiment, or, unless fibers are repaired or replaced, over periods between experiments. Therefore the source calibration measurement may be acquired only occasionally. The calibrated TPSF for source i and detector j, Ii,j, can then be acquired from the measured TPSF Mi,j as follows: where Sm represents a source calibration measurement for source m, An represents an absolute calibration measurement for source n and detector n coupled together, * represents a convolution operation, and ⊗ represents a deconvolution operation. These operations can either be performed for entire TPSFs using an appropriate Fourier transform based algorithm, or for specific datatypes, as described by Hillman et al.;19Coupling the MONSTIR sources and detectors was facilitated by the design of a connector that holds the source fiber and detector bundle in contact with the patient or phantom. As shown in Figure 1, the source fiber and detector bundle are held at a distance of about 10 mm from the tissue surface, at the top of a hollow cylinder with a internal diameter of 6 mm. The detector consists of a 2.5 mm diameter bundle of fibers, each with a numerical aperture (NA) of 0.21. The source fiber is oriented at an angle of 12 deg so that the center of the beam emitted from the fiber coincides with the center of the connector aperture. Both are held in position using small grub screws. The angular divergence of the beam is dictated by the NA of the fiber (0.275). Note that illuminating the whole aperture enables a larger laser power to be used without exceeding recommended safety limits for skin irradiance. The connector is constructed from black, near-IR-absorbing plastic. Figure 1Connector that couples a detector fiber bundle and a single-source fiber to the tissue surface.  In principle, the absolute calibration measurements are obtained by illuminating each source in turn, and measuring the light reflected at the surface of the object using the corresponding detector. The illuminating power is attenuated for this measurement to a few picowatts (or a few tens of millions of photons per second). After further reduction due to the detection efficiency of the system, this provides a few thousand detected counts per second, depending on the reflectivity of the surface. In practice, this method of measuring the absolute temporal response corresponding to a given source-detector pair requires two assumptions to be made. First, that the light entering the detector bundle uses the same transmission modes in the fibers as those used by diffuse light detected during an imaging experiment. This can reasonably be assumed if the surface is a diffuse reflector. Second, that the detected signal is dominated by reflection occurring at a flat air/object boundary, and is not significantly influenced by scattering within tissue beneath the surface. According to a study of the optics of human skin by Anderson and Parrish,20 at the near-normal angle of incidence around 5 of the light is reflected due to the change in refractive index between air and stratum corneum. They also estimate that a further 5 is re-emitted by scattering within the epidermis, and smaller fractions by scatter within deeper tissues. Re-emitted scattered light will obviously broaden the temporal distribution of the detected light, and will influence the accuracy of the absolute calibration. The experimental data types we most commonly employed for image reconstruction were the first two temporal moments: mean and variance. Consequently, our assessment of the method of calibration focused on its ability to provide accurately calibrated values of these specific datatypes. A preliminary experimental assessment of the connector design was made using MONSTIR and a single source-detector pair. The connector was placed at five different sites on the arms of five volunteers, and the backreflected TPSFs were recorded using pulses at a wavelength of 800 nm. A set of measurements were also made on the surface of an unpolished, diffusely reflecting aluminum plate, and on the flat surface of a solid-tissue-equivalent phantom with known optical properties (transport scatter coefficient μs ′=1.0 mm −1, absorption coefficient μa=0.01 mm −1) . The (uncalibrated) intensity, mean time and variance of each TPSF were calculated. Table 1 shows the average values of intensity divided by the value measured for the aluminum plate, and the average values of mean and variance after subtraction of the corresponding plate measurements. The calculated standard deviations for each measurement are also indicated. Table 1
Although the intensity of the reflected light was observed to vary considerably, the temporal moments measured on the arm revealed no obvious influence on skin pigmentation (melanin content), amount or color of hair, or location on the arm. The mean flight time for the arm are consistently between 10 and 20 ps longer than the value recorded on the aluminum plate, and the variance a few thousand squared picoseconds greater. The differences exhibited for the solid phantom are somewhat larger, indicating a greater contribution from re-emitted scattered light. To provide a more rigorous assessment of the degree to which the optical properties of media affect the data types measured using the connectors, a Monte Carlo model was employed, as described in the following section. 3.Monte Carlo ModelA sophisticated Monte Carlo model developed at the University of Florence has been widely validated using both experimental data and analytical models of photon migration.21 A two-layer slab model was employed to simulate the precise geometry and properties of the connector, as shown in Figure 1. The source is modeled as an emitter of instantaneous pulses of light with a Gaussian intensity profile having a standard deviation of 5.3 deg. The detector is assumed to measure the time-resolved signal with perfect temporal resolution and 100 efficiency for all photons arriving within an angle of 12.1 deg to the normal of the bundle surface. The sides of the holder are assumed to be perfectly absorbing. The top layer was assigned the following properties: thickness=10 mm, refractive index n=1, and μa=μs ′=0. The bottom layer was assigned a variety of values of μa, μs ′, n, and mean cosine of scatter g. The surfaces are assumed to be perfectly smooth and Fresnel reflection is included. Photons were launched from the source fiber onto the surface of the medium, and TPSFs were generated using the first 60,000 re-emitted or reflected photons received by the detector bundle. The mean flight time and variance of each TPSF were computed using all photons detected over a time window of 720 ps (which includes 99.9 of all detected photons). A simulation was also performed for a nontransmitting, diffusely reflecting surface, where the angular distribution of back-reflected intensity is according to Lambert’s cosine law. The shot noise on the TPSFs contributes an uncertainty in mean time and variance estimates of approximately 0.5 ps and 100 ps 2, respectively. Results obtained for various combinations of μa and μs ′ are summarized in Table 2. Table 2
The values of intensity, mean time, and variance are calculated relative to the values obtained for the Lambertian surface, where no penetration occurs. For the penetrable surfaces, increases in both datatypes are observed as absorption decreases and as scatter increases. For typical tissue optical properties (μs ′≈1.0 mm −1 and μa≈0.01 mm −1) the simulation predicts that the mean time and variance will be around 10 ps and 2600 ps 2 greater than those values for a Lambertian surface, respectively. These differences are reasonably consistent with those observed between the arm and the aluminum plate measurements. There are two major causes of the observed smaller fraction of light detected from the surface of the arm than from the simulated surfaces. First, the unpolished aluminum plate will not represent a perfect Lambertian reflector. Second, and more important, the surface of skin is not perfectly smooth and therefore reflected light is likely to be more isotropic. It is interesting to note that the differences between arm measurements and phantom measurements are significantly greater than those observed between modeled surfaces over a very large range of optical properties. Further simulations indicated that this disparity could not be accounted for by the differences in either the refractive index or mean cosine of scatter. Instead, it appears likely that this is due to the very different surface textures. The machined surfaces of epoxy resin phantoms are quite rough and pitted on a microscopic scale, and this possibly enables the light to couple into the resin more easily, leading to larger values of mean and variance, and smaller values of intensity. Overall, the combination of experiments and simulations suggests that surface texture is probably a more dominant factor in the determination of mean time and variance than the optical properties of the surface. 4.Imaging ExperimentTo assess the practical implementation and effectiveness of the calibration method, it was tested using a phantom that was successfully imaged previously, as described in detail by Hebden et al.;15 The solid tissue-equivalent phantom consists of a cylindrical block, 85 mm in length and 70 mm in diameter. The block has a transport scatter coefficient of μs ′=1.0±0.02 mm −1 and an absorption coefficient of μa=0.01±0.002 mm −1 at a wavelength of 800 nm. Embedded along the length of the phantom are three rods with coefficients having the following relative values: (1) 5μs ′ and μa, (2) μs ′ and 5μa, and (3) 2μs ′ and 2μa. Each rod is 8 mm in diameter, and located 15 mm from the central axis of the phantom. A black plastic ring was constructed to fit around the circumference of the phantom and hold 16 connectors in contact with the surface at regular intervals around the ring. The imaging experiment involved illuminating the source in each connector in turn, and measuring the corresponding TPSFs. The automated acquisition procedure adjusted each VOA to ensure that the photon count rates for each detector did not exceed around 3×10⁵ photons/ps. Because of the very high signal detected for the shortest source-detector separations, the detector connected to the source, and two detectors on either side, were deactivated by switching the VOAs to zero transmission. Data were recorded by each activated detector simultaneously for 15 s for each source position, and the resulting 16×11 TPSFs were stored on the system PC. The mean source power was 50 mW at a wavelength of 800 nm. The total duration of the experiment was a little less than 5 min. Immediately before and after the experiment, the new calibration method was performed, which involved attenuating the source power to a few picowatts, opening each VOA, and sequentially measuring the back-reflected light within each connector. A single-source calibration measurement was also acquired by placing the ring around the calibration phantom already described. Recorded TPSFs were calibrated using Eq. (1), and the values of mean time and variance were extracted. The TOAST reconstruction algorithm was then employed to derive images from these data using the same finite-element mesh and parameters employed for a previous experiment involving the same phantom, reported elsewhere.15 However, on this occasion a routine correction was made to the data to reduce the significance of artifact resulting from the use of a 2-D reconstruction algorithm, as described by Hillman et al.;19 After 12 iterations, TOAST produced the two images shown in Figure 2, representing the absorbing and scattering properties within the plane containing the ring of sources and detectors. Also shown is an illustration that indicates where the three embedded rods intersect this plane. The reconstructed images show the rods in the expected positions, and the scattering and absorbing properties are successfully resolved, with little crosstalk. The apparent contrast of the rods is considerably less than the true contrast, due to several factors, including the simplistic use of a 2-D algorithm, and the finite spatial resolution. Figure 2Reconstructed maps of (a) absorption and (b) scatter and (c) the cross section of the solid phantom indicating the location of embedded rods of contrasting optical properties. 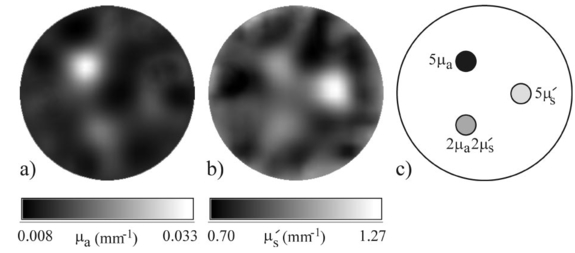 While it is evident that the new calibration method can produce images that are qualitatively correct, it is desirable to establish to what extent residual error between the calibrated values of the data types and the true values influences the reconstructed images. The data reported in Table 1 suggest that absolute calibration measurements involving epoxy resin phantoms are likely to produce an overestimate of true mean time and variance by around 30 ps and 5000 ps 2, respectively. Thus new images were reconstructed after the calibrated values of these data types were reduced by these amounts. The images were qualitatively almost indistinguisable from those shown in Figure 2, but corresponded to values of μa a few percent larger and values of μs ′ a few percent smaller. 5.DiscussionThe use of the connectors described here provides several significant benefits. First, they enable source fibers to be withdrawn from the surface to illuminate larger areas, and thus enable a greater laser power to be used without exceeding recommended safety limits for skin irradiance. Second, increasing the illumination area also reduces the dependency of measurements on small-scale irregularities at the surface, which benefits the reconstruction algorithm. Third, the connectors are easier to manipulate and occupy less surface area than single fibers and fiber bundles, enabling more to be coupled to the surface of a neonatal head, for example. And finally, most significant of all, the connectors provide a means of frequently measuring the temporal characteristics of the imaging system in situ during an experiment or clinical study, and therefore facilitate a more accurate calibration. The success of the demonstrated calibration method has encouraged us to replace our separate source fibers and detector bundles with 32 integrated bundles, where each source fiber is arranged along the central axis of the bundle of detector fibers, which makes connector design and fiber manipulation even simpler. The Monte Carlo simulations demonstrated that optical properties of the medium have a limited effect on the mean and variance data types, although the comparison with experimental values suggests that surface texture is potentially a more dominant factor, which was not accounted for in the simulation. Nevertheless, experiments and simulations both indicate that this method of determining an absolute calibration of the imaging system will provide overestimates of both data types. Furthermore, this overestimation is likely to be significantly larger for epoxy resin phantoms than for real tissue. The reconstruction of the cross section of the solid phantom demonstrated the effectiveness of the calibration method. The images shown in Figure 2 exhibit good separation between absorption and scattering properties, although the optical coefficients of the embedded rods were not recovered accurately. The lack of quantitative accuracy when reconstructing small features (i.e., smaller than the spatial resolution limit) is an inherent problem with low-resolution imaging methods such as optical tomography. Pogue et al.;22 demonstrated a regularization method that yields greater quantitative accuracy for discrete objects within an otherwise uniform region, but it is not evident whether this approach can be applied to media having an arbitrary distribution of optical properties. Our attempt to adjust the data to account for the expected errors in mean time and variance resulting from the calibration method indicated a surprising lack of sensitivity to constant offsets in either data type. Recently reported 3-D experiments revealed that the ability to image small inhomogeneities embedded within tissue-like phantoms relies on determining mean time values with an accuracy of a few tens of picoseconds.16 However, assuming each absolute calibration gives an overestimation by the same small amount, it is unlikely that image contrast will be strongly affected, although the optical properties derived from the reconstruction will be somewhat distorted. The effect of the calibration error would be more severe if the offsets in mean time and variance were different for each source-detector pair, and potentially this could occur if the illuminated tissue beneath each connector had very different optical characteristics. However, if the data types must be ascertained with greater accuracy, perfect reflection could be guaranteed by employing a reflecting surface directly beneath the connectors. This could be achieved, perhaps, by temporarily placing a layer of tape over the connector apertures on the inside of the fiber holder. AcknowledgmentsSupport for this research has been generously provided by the Wellcome Trust and the Commission for the European Community. REFERENCES
S. R. Arridge
and
J. C. Hebden
,
“Optical imaging in medicine II: modelling and reconstruction,”
Phys. Med. Biol. , 42 841
–854
(1997). Google Scholar
J. C. Hebden
,
S. R. Arridge
, and
D. T. Delpy
,
“Optical imaging in medicine I: experimental techniques,”
Phys. Med. Biol. , 42 825
–840
(1997). Google Scholar
C. H. Schmitz
,
M. Locker
,
J. M. Lasker
,
A. H. Hielscher
, and
R. L. Barbour
,
“Intrumentation for fast functional optical tomography,”
Rev. Sci. Instrum. , 73 429
–439
(2001). Google Scholar
A. M. Siegel
,
J. J. A. Marota
, and
D. A. Boas
,
“Design and evaluation of a continuous-wave diffuse optical tomography system,”
Opt. Express , 4 287
–298
(1999). Google Scholar
S. R. Arridge
and
W. R. B. Lionheart
,
“Nonuniqueness in diffusion-based optical tomography,”
Opt. Lett. , 23 882
–884
(1998). Google Scholar
D. A. Benaron
,
S. R. Hintz
,
A. Villringer
,
D. Boas
,
A. Kleinschmidt
,
J. Frahm
,
C. Hirth
,
H. Obrig
,
J. C. van Houten
,
E. L. Kermit
,
W.-F. Cheong
, and
D. K. Stevenson
,
“Noninvasive functional imaging of human brain using light,”
J. Cereb. Blood Flow Metab. , 20 469
–477
(2000). Google Scholar
H. Eda
,
I. Oda
,
Y. Ito
,
Y. Wada
,
Y. Oikawa
,
Y. Tsunazawa
,
M. Takada
,
Y. Tsuchiya
,
Y. Yamashita
,
M. Oda
,
A. Sassaroli
,
Y. Yamada
, and
M. Tamura
,
“Multichannel time-resolved optical tomographic imaging system,”
Rev. Sci. Instrum. , 70 3595
–3602
(1999). Google Scholar
D. Grosenick
,
H. Wabnitz
,
H. H. Rinneberg
,
T. Moesta
, and
P. M. Schlag
,
“Development of a time-domain optical mammograph and first in vivo applications,”
Appl. Opt. , 38 2927
–2943
(1999). Google Scholar
V. Ntziachristos
,
X. Ma
, and
B. Chance
,
“Time-correlated single photon counting imager for simultaneous magnetic resonance and near-infrared mammography,”
Rev. Sci. Instrum. , 69 4221
–4233
(1998). Google Scholar
F. E. W. Schmidt
,
M. E. Fry
,
E. M. C. Hillman
,
J. C. Hebden
, and
D. T. Delpy
,
“A 32-channel time-resolved instrument for medical optical tomography,”
Rev. Sci. Instrum. , 71 256
–265
(2000). Google Scholar
M. A. Franceschini
,
K. T. Moesta
,
S. Fantini
,
G. Gaida
,
E. Gratton
,
H. Jess
,
W. W. Mantulin
,
M. Seeber
,
P. M. Schlag
, and
M. Kaschke
,
“Frequency-domain technique enhance optical mammography: initial clinical results,”
Proc. Natl. Acad. Sci. U.S.A. , 94 6468
–6473
(1997). Google Scholar
T. O. McBride
,
B. W. Pogue
,
S. Jiang
,
U. L. Osterberg
, and
K. Paulsen
,
“A parallel-detection frequency-domain near-infrared tomography system for hemoglobin imaging of the breast in vivo,”
Rev. Sci. Instrum. , 72 1817
–1824
(2001). Google Scholar
H. Jiang
,
Y. Xu
,
N. Iftimia
,
J. Eggert
,
K. Klove
,
L. Baron
, and
L. Fajardo
,
“Three-dimensional optical tomographic imaging of breast in a human subject,”
IEEE Trans. Med. Imaging , 20 1334
–1340
(2001). Google Scholar
M. Schweiger
and
S. R. Arridge
,
“Optical tomographic reconstruction in a complex head model using a priori region boundary information,”
Phys. Med. Biol. , 44 2703
–2721
(1999). Google Scholar
J. C. Hebden
,
F. E. W. Schmidt
,
M. E. Fry
,
M. Schweiger
,
E. M. C. Hillman
,
D. T. Delpy
, and
S. R. Arridge
,
“Simultaneous reconstruction of absorption and scattering images by multichannel measurement of purely temporal data,”
Opt. Lett. , 24 534
–536
(1999). Google Scholar
J. C. Hebden
,
H. Veenstra
,
H. Dehghani
,
E. M. C. Hillman
,
M. Schweiger
,
S. R. Arridge
, and
D. T. Delpy
,
“Three dimensional time-resolved optical tomography of a conical breast phantom,”
Appl. Opt. , 40 3278
–3287
(2001). Google Scholar
F. E. W. Schmidt
,
J. C. Hebden
,
E. M. C. Hillman
,
M. E. Fry
,
M. Schweiger
,
D. T. Delpy
, and
S. R. Arridge
,
“Multiple slice imaging of a tissue-equivalent phantom using time-resolved optical tomography,”
Appl. Opt. , 39 3380
–3387
(2000). Google Scholar
E. M. C. Hillman
,
J. C. Hebden
,
M. Schweiger
,
H. Dehghani
,
F. E. W. Schmidt
,
D. T. Delpy
, and
S. R. Arridge
,
“Time resolved optical tomography of the human forearm,”
Phys. Med. Biol. , 46 1117
–1130
(2001). Google Scholar
E. M. C. Hillman
,
J. C. Hebden
,
F. E. W. Schmidt
,
S. R. Arridge
,
M. Schweiger
,
H. Dehghani
, and
D. T. Delpy
,
“Calibration techniques and datatype extraction for time-resolved optical tomography,”
Rev. Sci. Instrum. , 71 3415
–3427
(2000). Google Scholar
R. R. Andersson
and
J. A. Parrish
,
“The optics of human skin,”
J. Invest. Dermatol. , 77 13
–19
(1981). Google Scholar
A. Sassaroli
,
C. Blumetti
,
F. Martelli
,
L. Alianelli
,
D. Contini
,
A. Ismaelli
, and
G. Zaccanti
,
“Monte Carlo procedure for investigating light propagation and imaging of highly scattering media,”
Appl. Opt. , 37 7392
–7400
(1998). Google Scholar
B. W. Pogue
,
C. Willscher
,
T. O. McBride
,
U. L. O¨sterberg
, and
K. Paulsen
,
“Contrast-detail analysis for detection and characterization with near-infrared diffuse tomography,”
Med. Phys. , 27 2693
–2700
(2000). Google Scholar
|
|||||||||||||||||||||||||||||||||||||||||||||||||||||||||||||||||||||||||||||||||||||||||||||||||||||||||||||||||


CITATIONS
Cited by 36 scholarly publications.
Calibration
Sensors
Connectors
Picosecond phenomena
Data modeling
Optical properties
Tissue optics


