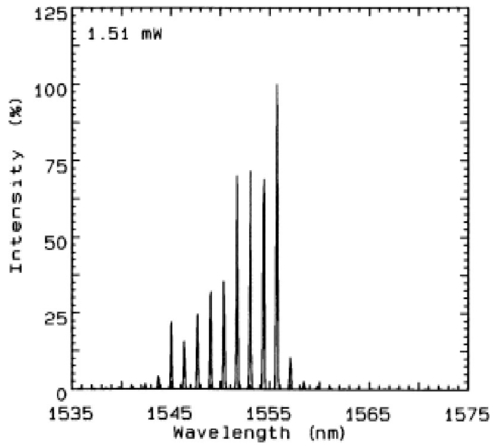
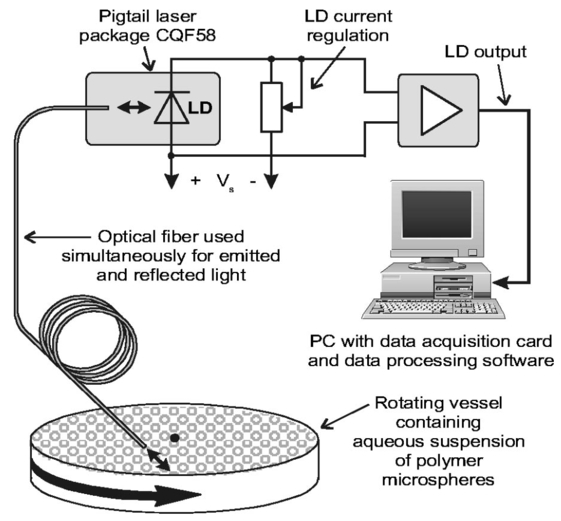
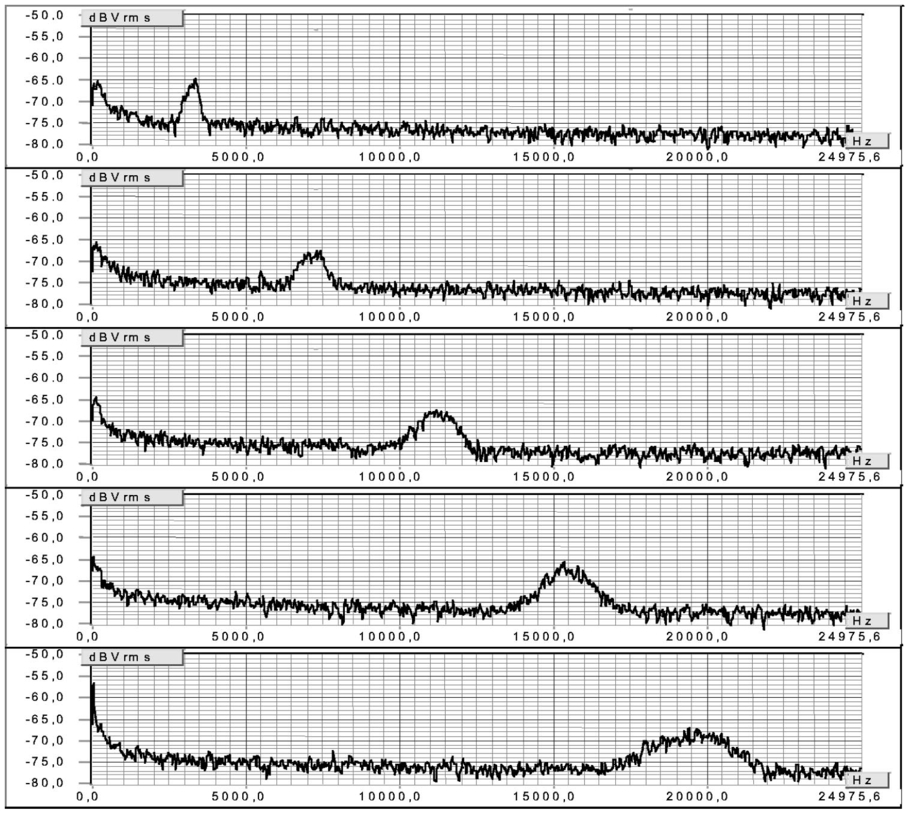
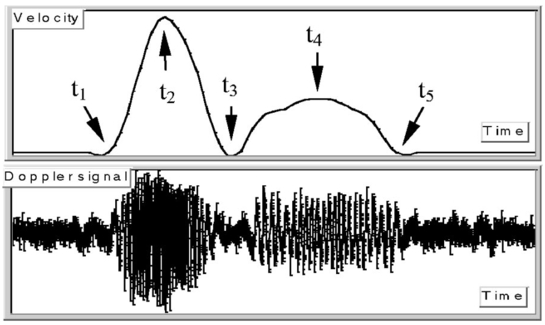
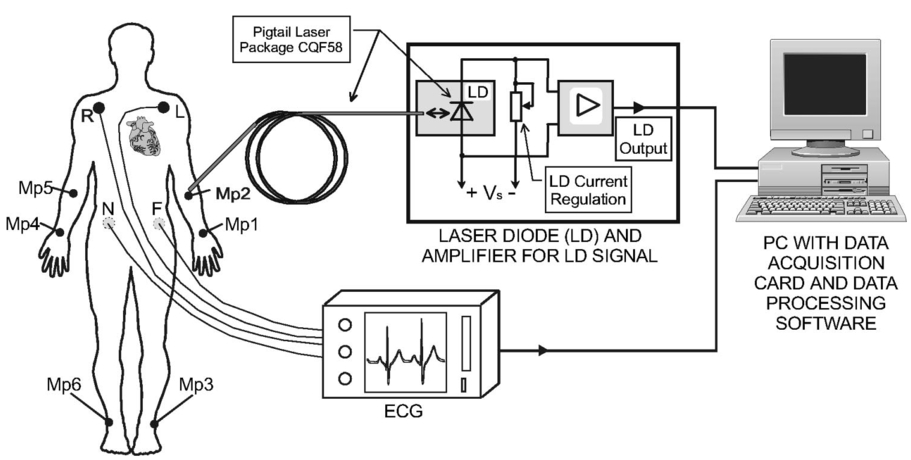
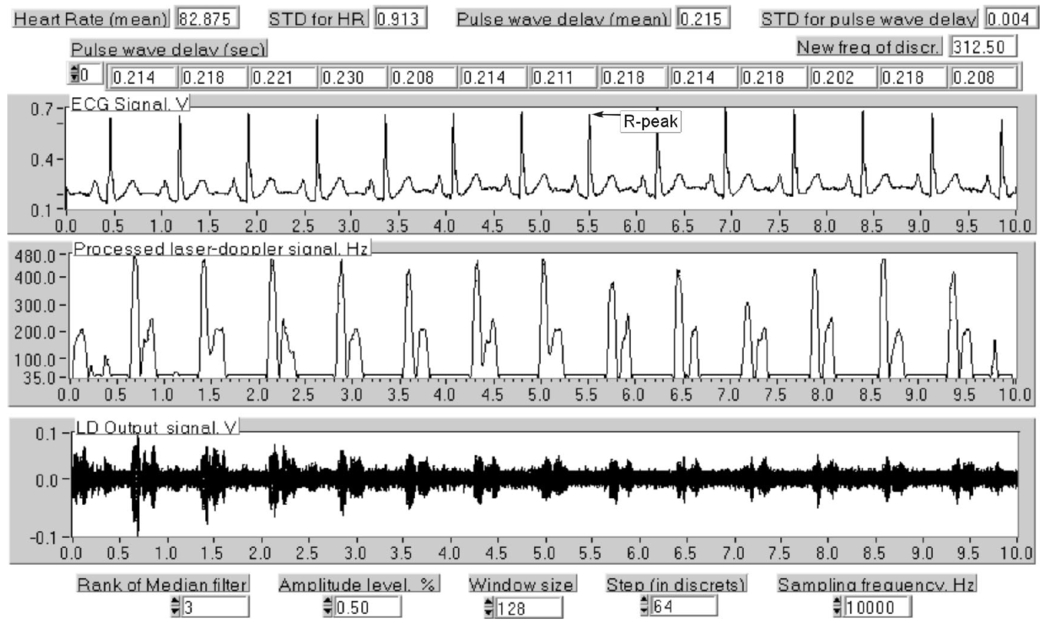
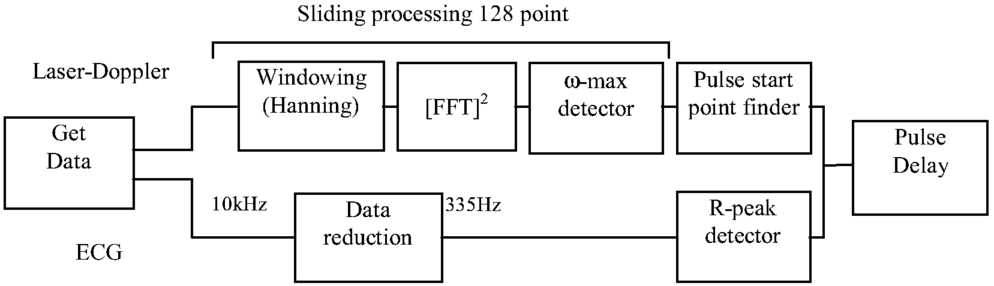
1.IntroductionIt is well known that coherent photodetection has found wide applications. For example, the coherent photodetection of the radiation reflected back from the object surface is used in vibration measurement,1 in surface motion measurement,2 in deformation measurement,3 and in distance measurement.4 The method for coherent photodetection is used in several biomedical applications of coherent imaging detection,5 Doppler interferometry,6 Doppler anemometry,7 and in the principal schemes of a number of different sensors. However, several realizations are technically complicated and carefully aligned high-quality optics is required. The self-mixing method in a laser is known to have several advantages over conventional systems.8 9 This method enables us to simplify the optical scheme of such devices and achieve the mixing effect, where a small portion of the light reflected from the mirror is returned to the laser cavity and is mixed with the original oscillating wave inside the laser. The method of self-mixing inside the laser cavity facilitates the design of the same principle without beamsplitters and an external photodetector. The optical setup contains only reasonably priced optical components: a laser diode with fiber or lenses. Self-mixing systems can be easily aligned; because these have only one optical axis, they have been called self-aligning systems. Self-mixing also provides a larger modulation depth, hence a comparatively high SNR. The theories of heterodyne or homodyne reception and photodetection with self-mixing in a semiconductor laser,10 11 and a gas laser12 as well as the theory of self-mixing in a single-mode or multi-longitudinal-mode diode laser13 are based on a presumption of coherence of light in all equipment and on the way to the target and back. The laser is used to send light, either in free space or through an optical fiber, to a movable target from which the backscattering is detected. The self-mixing effect has been explained as a spectral-mode modulation inside the laser caused by backscattered radiation. The theories operate with interference between radiation irradiated and scattered back to the laser cavity. In medical applications, laser Doppler methods were applied for different purposes including tissue vibration measurement14 and eye movements registration.15 Blood flow measurements have long been of special interest because the quantitative determination of blood flow provides essential information to diagnose serious diseases and circulatory disorders in certain parts of the body, including vessels. A laser Doppler flowmetry was developed as an effective and reliable method for noninvasive blood flow measurement.16 17 18 19 The self-mixing effect in diode lasers provides remarkable advantages in blood circulation measurement. Intra-arterial measurements of the velocity and the average flow of red blood cells were investigated using a fiber-coupled laser Doppler velocimeter based on self-mixing effect.20 This technology is close to being a commercial product for clinical application. The efficiency of the self-mixing velocimeter was tested in vivo with the optical fiber inserted in the artery in upstream and downstream blood flow conditions.16 Blood pressure and cardiovascular pulsation are fundamental indicators of cardiovascular disease. The pulse is considered one of the four most fundamental medical parameters. The abnormal shape and rhythm of arterial pulsations are directly related to diverse cardiovascular disorders. Small and weak pulses can be related to heart failure, shock, or aortic stenosis. Large and bounding pulses can represent hyperkinetic states, aortic regurgitation, or abnormal rigidity of arteries. Arrhythmia can lead to a changing amplitude or irregularity of pulsation. The abnormal amplitude of pulsation can also be related to the blood pressure. Pulse wave velocity is known to be correlated with blood pressure. The pulsation of the carotid artery can be an indicator of cerebrovascular disease. In our preliminary publication, the method enables an optical no-touch measurement of skin surface vibrations, which can reveal the pulsatile propagation of blood pressure waves along the vasculature.21 The same method and equipment were applied to detect small moving micrometer-size particles22 and as an optical noninvasive method for blood flow velocity measurement.23 This work is directed toward the development of a simple optical method for the observation of the pulse wave profile and delay time as well as small-particle flow detection. The self-mixing method was selected because it presents the significant advantages of compactness and simplicity of alignment, in comparison with the conventional methods. The problems of self-mixing signal dependence on the distance to moving object and sensitivity of the method are specially investigated. 2.Theoretical BackgroundThe pulse wave as a pressure wave causes changes in the radius of blood vessels and the movement of their wall. Typically, vessel wall expansion and shrinkage results in movement on the skin surface, which can reveal the pulsatile propagation of pulse waves along the vasculature and can contain such useful parameters as period of pulsation, moment of pulse wave arrival, and pulsation profile. The laser light is coupled into a fiber and guided toward a moving object—the skin near the arteries. A small part of the Doppler-shifted light scattered by the moving object is collected by the same fiber and guided back into the laser. The Doppler-shifted light interferes with the laser light present in the laser cavity and causes an intensity modulation of the light inside the laser cavity. The frequency of this intensity modulation is related to the Doppler shift. The self-mixing effect in a semiconductor laser diode is observed as modulation of the amplitude and the spectra of the emitted light due to the optical feedback of backscattered light into the laser cavity. This external optical feedback affects such internal parameters of the laser diode as threshold gain and lasing frequency. The light backscattered from the target comes into a laser active cavity and causes changes in the number of carriers in the active area and so in the threshold of excitation current.10 11 12 24 In this way, the backscattered light is active in the process of laser generation and affects inversion. The theory to explain the phenomena observed in the self-mixing process was developed by several authors. An analytical model for the three-mirror cavity was proposed and widely used to explain optical feedback-induced changes in output parameters of diode laser. The amplitude and spectral behavior of the laser with optical feedback were studied.25 A spectral line narrowing or broadening depending on feedback conditions was shown to take place in the output spectra of the semiconductor lasers.26 A theoretical model for the shape and the amplitude of self-mixing signals was described.17 A broadening of the apparent line width of the semiconductor laser modes with the external cavity was shown to be due to the coherent nature of the feedback and multiple reflections in the external cavity.27 A detailed theoretical analysis of stability for a semiconductor laser with an external cavity showed that instability is related to jumps of the laser frequency between external cavity modes or to feedback-induced intensity pulsations due to the carrier density dependence on the refractive index.28 The conditions that determine whether an external cavity laser oscillates in the mode with lowest threshold gain was discussed,29 where the mode coupling between the sidemodes was shown to enable the external-cavity laser to oscillate stably in a mode even though it has sidemodes with higher gain. The results of numerical analyses of the external feedback on a single-mode semiconductor laser demonstrated that the lasing mode with the minimum line width is most stable rather than the mode with the minimum threshold gain.30 31 A three-mirror cavity model can be used to describe the self-mixing method applied for measurements in this study. The principal scheme of the method is presented in Figure 1. Two mirrors R1 and R2 constitute the laser cavity. The moving object (skin) can be presented as a third mirror R3. The light reflected from the target interfered with the light at the laser front facet with different phase swift determined by the distance to the target. Mirror R3 and one of the laser facets, R2, constitutes an effective laser mirror Re, the reflectivity of which depends on distance. The dependence of effective reflection from the second laser mirror on the length of external cavity causes changes in threshold of generation and the output light power of the laser. It is clear that the laser optical output includes modulation term dependent on the feedback strength and the distance of the external reflector. It corresponds to a variation of the λ/2 displacement at the external reflector and is a repetitive function with a period of 2π rad. This model is based on coherence of light inside the external cavity. Figure 1Schematic of a simple laser with external optical feedback: l, laser-cavity length; L, distance from laser-cavity front face to target; R1, R2, and R3, laser mirrors and target. 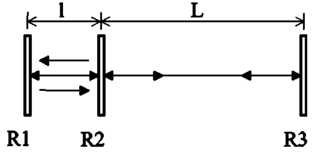 According to the three-mirror model,18 25 the field in the laser cavity can be calculated by applying the amplitude and phase criteria for the stationary state of the light propagating in the laser cavity. In such an approach, we can see that diode laser undergoes threshold gain and lasing frequency variations. The changes in threshold gain and therefore in the optical output variation ΔP due to feedback was shown to have a nonmonotonic dependence on length of the external cavity: where R is reflectivity of the laser facets, l is length of the laser cavity, R ext is reflectivity of the moving object (skin), ω is the lasing frequency with optical feedback, τ ext =2L/c is the round-trip time of the laser light in the external cavity, and L is the distance from the front facet of the laser cavity to the moving object (skin).The maximum value of optical output takes place when the waves from laser cavity and external cavity meet each other in the same phase at the laser front facet. This condition can be satisfied if the effective optical length of external cavity is the same as or is multiplied to be the effective optical length of laser cavity. The maximum optical output is realized when the following condition is satisfied: where η is a refractive index of the cavity, and m=M′−M is difference of mode index. This means that the maximum output is attained at the external-cavity length equal to integer multiples of the effective laser cavity length ηl.The dependence of the self-mixing signal on distance between the laser and moving object and threshold gain (pump current) was investigated in experiments. 3.Experiment3.1.Self-Mixing Signal Dependence on DistanceThe experimental setup for measurement of the dependence of self-mixing signal on distance is presented in Figure 2. A Philips 1550-nm GaInAsP LD CQF 58 with monomode fiber with a 1-m length was used in our experiments. There is a special potentiometer P for precise adjustments of the laser pump current. A special low-noise two-channel amplifier used for the signals from the PD and from the resistor in the laser current chain, correspondingly. Light consists of nine longitudinal modes, and the shift between them was 1.11 nm (Figure 3). The frequency difference between the longitudinal modes of laser active cavity was Δf=1.25×10¹¹ Hz, the equivalent optical (taking into account the refractive index) longitudinal size of the cavity was about 1.2 mm. Figure 2Schematic experimental arrangement with amplifiers for PD and LD output signals and with LD current regulation. Used laser package from Philips CQF 58, which contain an optical fiber of 1 m length: PD, photodiode (integral), and LD, laser diode.  The measured dependence of the self-mixing interference on the distance between laser and target is presented in Figure 4 (first five maximums and others). The distance between minimum and maximum on the self-mixing modulation function curve was 0.89 mm. Figure 4Dependence of self-mixing interference on the distance: left, first five maximums, and right, all maximums. Here horizontal axis represents the distance between optical fiber output and target, and the vertical axis, the signal amplitude in arbitrary units. 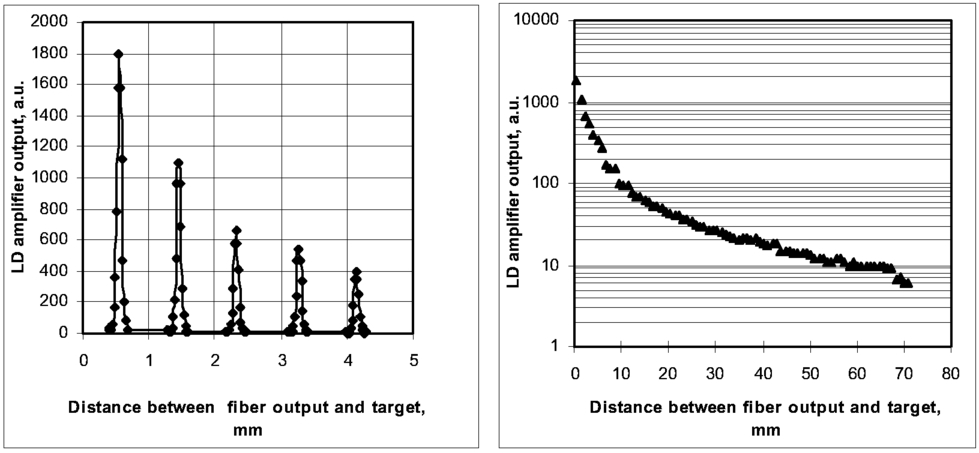 We used a reflective surface attached to a loudspeaker cone driven by a signal generator as a target, to provide phase variations of the external optical feedback. The diode laser package incorporates a PD accommodated in the rear facet to monitor the laser power. This characteristic of the device is particularly well suited to observing the self-mixing interference and it provides a convenient internal detector. A typical output signal obtained in this case is shown in Figure 5. The feedback was less than 10 in all experiments. The upper trace in Figure 5 is the signal applied to achieve the periodic target movement, and the resultant intensity modulation (middle trace) is the self-mixing signal observed. Another structure of the same device was also observed. For signal separation and capturing, there is an additional resistor (R=50 Ω) with intermittent potential in the laser pump current chain. In the same figure (lower trace) the self-mixing signal is presented. Figure 5Typical signals observed from self-mixing: upper trace, signal applied to achieve the periodic target movement; middle and lower traces, self-mixing signals from the PD and the resistor in the laser current chain. Here the horizontal axis represents time, and the vertical axis, the signal amplitude in arbitrary units. 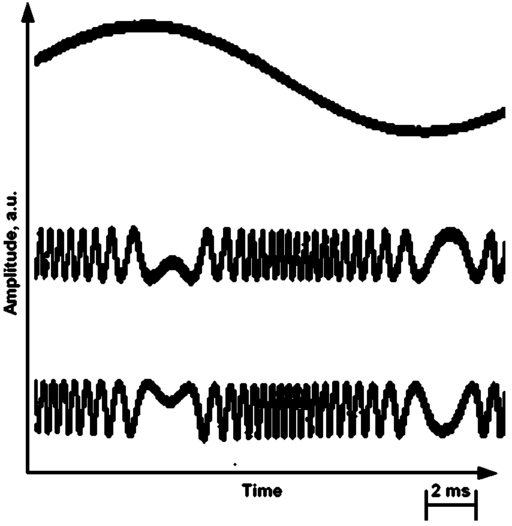 The theoretical value for distances between the positions of two maximums on the self-mixing modulation function curve is about 1.2 mm. The difference between theoretical estimation of distance between maximums and the measured real value of 0.89 mm (Figure 4) would be explained by slightly different length of laser cavity used in theoretical estimation. This length was derived from passport data of light spectrum of the diode laser (Figure 3). The dependence of the self-mixing signal amplitude maximums on distance can be explained by the characteristics of spatial broadening of laser light beam as well as by its limited longitudinal coherence. The spatial broadening of the beam from the optical fiber was measured by the method applied in Ref. 21. The radiation angle of the fiber was 40 deg at a 90 level and the intensity dependence on distance from the fiber r was typical for spherical wave 1/r2. The decrease of the measured maximums (Figure 4) with increased distance fit well with this dependence. The longitudinal coherence is determined by the width of the radiated light spectrum. If the round-trip time of the light in the external cavity τ ext =2L/c is within the coherence time, the interference between the backscattered field and field inside the laser active cavity is strongest. If the round-trip time is larger than the laser light coherence time, the phase changes between the intracavity and backscattered light cause a strong reduction of the interference and consequently the self-mixing signal. Introducing the longitudinal coherence length through the width of the spectrum of the radiated light l coh =c/Δf the relative reducing of the self-mixing signal is proportional to the ratio16 where I coh is level of the signal for τ ext ≪l coh or 2L/c≪c/Δf.In our experiments, a multimode laser was used and its spectrum consists of a series of narrow lines (Figure 3). In this case, there are two different coherence scales. One is determined by the width of single longitudinal mode. On the other hand, the whole spectrum includes N modes separated by ΔF=c/2l, where l is length of the laser cavity. The total intensity is obtained as a sum of N uncorrelated spectrum lines and the longitudinal coherence length I coh =2l has its minimal value 2.4 mm. The real length of the external cavity L consists of two parts: the length of the optical fiber lf=1 m and distance from the fiber r and L=lf+r, which is much longer than the coherence length. The relatively small changes in distance L caused by variances of r (Figure 4) cannot affect the condition L≫l coh . Calculated by Eq. (3), the dependence of the self-mixing signal on distance r from the fiber is not significant. In this case, the measured dependence of maximums amplitude on distance (Figure 4) was caused by the decrease of light intensity with distance caused by the beam broadening only. 3.2.Self-Mixing Signal Dependence on Laser Current and Sensitivity of the MethodFirst, we measured the self-mixed signal amplitude as a function of the laser pump current. The pump current was adjusted precisely with a potentiometer and the output signals of both channels were recorded simultaneously. These characteristics are similar and one of them shown is in Figure 6. As we can see in both cases, the self-mixed signal dependence on the laser pump current as inversely proportional, and the maximum value of the signal corresponds to the pump current near threshold. Figure 6Mixed signal amplitude dependent on laser current: the used laser was QF 4142 with a threshold current I th =24 mA. Here the horizontal axis is laser current in milliamperes and the vertical axis, the signal amplitude in arbitrary units.  Second, we measured the sensitivity of self-mixing as a method. We registered a maximum distance L max =42 mm (distance from optical fiber output to target) when the self-mixed signal amplitude in the amplifier output is equal to the noise (SNR is 1). This situation corresponds to the minimum reflected signal that we were able to measure without additional signal processing. Thereafter, we geometrically calculated the amount of a radiation reflected from the target to the optical fiber input in the case of L max . The measured optical radiation distribution from the optical fiber in different directions is the same on both plane surfaces and the calculated spatial angle for 90 of radiation is 10 deg. The calculated geometrical laser spot surface of reflected radiation on the plane surface of the optical fiber input S=πr2=π(2L tan φ)2=168 mm 2. We calculated geometrically minimum optical power P min (SNR=1), reflected back to a laser cavity, without considering losses from the refracting of different surfaces, losses from matching, and losses from mixing in the case of an optical fiber core diameter of 9 μm and a laser output optical power P=0.05 mW (near threshold). As a result, P min =S fiber /S×P=19 pW, which gives a satisfactory sensitivity for this method. 3.3.Application of Method for Flow DetectionThe experimental scheme used to investigate the flow effects of self-mixing with a pigtail diode laser is shown on Figure 7. The pigtail laser package consists of an LD, which is kept at constant temperature by Peltier element, and a PD. The matched monomode optical fiber is 1 m long with a core diameter of 9 μm and without any lens, which means that the SNR of output signal can be improved by having a collecting lens in the fiber output end. In this scheme, the light from the pigtail heterojunction InGaAs LD (Philips CQF 58) with a wavelength of 1550 nm and with an output optical power 1.0 mW is emitted from the fiber output and reflected back into the laser cavity via the same fiber. The liquid used is an aqueous suspension of polymer microspheres with a sphere diameters of 7.0 μm, a polymer density of 1.05 g/cm3, a refractive index of 1.59, a concentration approx. 107 spheres/ml, produced by Duke Scientific Corporation. The rotating speed of the vessel containing liquid can be adjusted in range of 0.1 to 0.7 turns/s. The end of the fiber is fixed at under 45 deg near to the liquid surface. The distance from the fiber end to the liquid surface is 1 mm and distance from the rotation center is 4 mm. The speed of rotating vessel was increased in five equal steps and the self-mixing signal power spectrum was recorded. As we can see from the Figure 8, the spectrum maximum corresponds to the particle flow rate, which increases proportionally to the rotation speed of the turning vessel. A PC with a data acquisition card (PCI-MIO-16E-1) was used to record the output signal. The data acquisition resolution is 12 bits and frequency of discretization in our case is 50 kHz. After discretization, the signal was filtered by a high-pass filter (HPF) to reduce the low-frequency noise level. The third order filter was used in that case. The HPF filtering limits the theoretical minimum velocity that can be detected (1.6 mm/s); the upper frequency limit is set by the Nyquist criteria (19 mm/s). After filtering, the signal was windowed and the power spectral density was calculated inside 2048 sample frames. To obtain a reasonable SNR, the power spectrum was averaged over 40 frames, the frames were 50 overlapped. The length of the signal that was processed was 2048×40×0.5×0.2×10−4 s≅0.8 s, which means that the first measurement result can be obtained in less than a second, and for continuous measurements, the time resolution is limited by the frame size and discretization frequency 2048×0.2×10−4 s≅0.04 s. A sliding window additionally smoothed the calculated power spectrum; the window size was 200 points. Thereafter, the frequency with the maximum amplitude was detected and the frequency-to-velocity transform was performed. National Instruments graphical programming software LabView was used to record and for signal-processing purposes. 3.4.Application of Method for Pulse Profile MeasurementThe pulse profile registration was performed using the same setup and equipment as represented in Figure 2. The probing ray was led via the optical fiber to the skin surface (arm artery). At the end of the fiber, a special clamp was attached to minimize the interfering signal due to involuntary tremors of the body (the position of the fiber tip relative to the arm was fixed). The signals were recorded with a sampling rate of 10 kHz, which gave a bandwidth of 0 to 5000 Hz, the duration of the recording was 10 s. The recorded signal was preprocessed using a sliding window, the length of the Hanning windowed signal was 128 points, and power spectrum was calculated after every 8 points (resolution 0.8 ms) using the fast Fourier transform (FFT) algorithm. For every calculated power spectrum segment the frequency with maximum amplitude was detected, which gave us the time-dependent Doppler frequency (pulse profile). See the sliding processing part of the upper channel in Figure 12 in Sec. 3.5. We used the National Instruments data acquisition board (DAQ) AT-M10-16E-10 to digitize the signals locally and transmit the digital data to the PC with a resolution of 12 bits. As we can see in the frame of the recorded pulse profile signal in Figure 9, the shape of each pulsation has more peaks, including a major peak and a secondary peak immediately following the major peak. The reasons for this are the reflections of the blood pressure wave, but the output signal of our system represents the absolute value of the skin vibrations, because we can not distinguish movement toward or away from the probing ray. In this figure, time t2 corresponds to the maximum velocity of vessel extension, and time t4 to the maximum velocity of vessel restriction. We have the maximum diameter of the vessel at time t3 and the normal diameter at t1 and t5, respectively. 3.5.Application of Method for Pulse Wave Delay Time MeasurementPulse wave delay time is measured as a time interval between the electrocardiogram (ECG) signal and the skin vibration signal near different arteries of the human body. We used a four-lead system with the standard ECG clinical device Mingograf-4 produced by Siemens-Elema for ECG recordings. The setup for measurement is represented in Figure 10. Six different measurement points Mp1 to Mp6 were used to measure the pulse wave in different arteries. Both of the signals were recorded with a sampling rate of 10 kHz, and the duration of the recording was 10 s. The recorded signals are shown in Figure 11. The first signal (upper curve) is the ECG used as a reference signal for the time measurement, the second curve is a processed laser Doppler signal (pulse profile), and the third curve is a signal from the LD used as an input signal (without processing). The recorded laser Doppler signal was preprocessed (Figure 12) using a sliding window, the length of the Hanning windowed signal was 128 points and the power spectrum was calculated after every 8 points (resolution 0.8 ms) using the FFT algorithm. For every calculated power spectrum the frequency with the maximum amplitude was detected. The maximum of every pulse profile t2 (Figure 9) was detected using the adaptive level peak detector, after which the pulse vibration starting point t1 was determined. The calculated time-dependent frequency (pulse profile) never goes exactly to the zero because of the noise, and that makes it difficult to determine the exact starting point of the pulse vibration. In this paper, the starting point of the pulse wave was fixed to the time point where tangent of the maximum value of the first derivative of current pulse profile and the zero frequency converge. The discretization frequency of the ECG was reduced to 335 Hz, because there is no relevant information above 100 Hz. Thereafter, the ventricular electrical activation starting point R peak (Figure 11) in the ECG was located by the adaptive level peak detector. The pulse delay was calculated as a time difference between the R peak of the ECG and the following pulse starting point of the laser Doppler signal. The results of the pulse delay measurements are presented in Table 1. One recording (10 s) contains about 12 to 13 pulses. The mean delay of the pulses was calculated without the maximum and minimum values of every data series. The heart rate mean values are calculated in the same way. The values of the heart rate are different for different points of the human body because these measurements are made at different time moments. Table 1
4.ConclusionsSimple equipment based on self-mixing with the use of the same LD was applied to record different cardiovascular parameters: pulse wave shape, pulse wave delay, and blood flow. From the results of experimental investigation of the method some general conclusions can be derived:
REFERENCES
P. A. Roos
,
M. Stephens
, and
C. E. Wieman
,
“Laser vibrometer based on optical-feedback-induced frequency modulation of a single-mode laser diode,”
Appl. Opt. , 35 6754
–6761
(1996). Google Scholar
V. P. Ryabukho
and
S. S. Ul’yanov
,
“Spectral characteristics of dynamic speckle-fields interference signal for surfaces motion measurements,”
Measurement , 10
(1), 39
–42
(1992). Google Scholar
X. C. Lega
and
P. Jacquot
,
“Deformation measurement with object-induced dynamic phase shifting,”
Appl. Opt. , 35 5115
–5121
(1996). Google Scholar
C. B. Carlisle
,
R. E. Warren
, and
H. Riris
,
“Single-beam diode-laser technique for optical path-length measurements,”
Appl. Opt. , 35 4349
–4354
(1996). Google Scholar
B. Deveraj
,
M. Takeda
,
M. Kobayashi
,
M. Usa
, and
K. P. Chan
,
“In vivo laser computed tomographic imaging of human fingers by coherent detection imaging method using different wavelengths in near infrared region,”
Appl. Phys. Lett. , 69 3671
–3673
(1996). Google Scholar
G. F. Schmid
,
B. L. Petrig
,
C. E. Riva
,
K. H. Shin
,
R. A. Stone
,
M. J. Mendel
, and
A. M. Laties
,
“Measurement by laser Doppler interferometry of intraocular distances in humans and chicks with a precision of better than ±20 mm,”
Appl. Opt. , 35 3358
–3361
(1996). Google Scholar
H. Mignon
,
G. Grehen
,
G. Gouesbet
,
T. H. Xu
, and
C. Tropea
,
“Measurement of cylindrical particles with phase Doppler anemometry,”
Appl. Opt. , 35 5180
–5190
(1996). Google Scholar
N. Schunk
and
K. Petermann
,
“Numerical analysis of the feedback regimes for a single-mode semiconductor laser with external feedback,”
IEEE J. Quantum Electron. , 24
(7), 1242
–1247
(1988). Google Scholar
S. Schuster
,
T. Wicht
, and
H. Haug
,
“Theory of dynamical relaxation oscillations and frequency locking in a synchronously-pumped laser diode,”
IEEE J. Quantum Electron. , 27
(2), 205
–211
(1991). Google Scholar
R. F. Kazarinov
and
R. A. Suris
,
“Heterodyne reception with injection laser,”
JETF , 66
(3), 1067
–1078
(1974). Google Scholar
R. Lang
and
K. Kobayashi
,
“External optical feedback effects on semiconductor injection laser properties,”
IEEE J. Quantum Electron. , 16 347
–355
(1980). Google Scholar
B. Zakharov
,
K. Meigas
, and
H. Hinrikus
,
“Coherent photodetection with the aid of a gas laser,”
Sov. J. Quantum Electron. , 20 189
–193
(1990). Google Scholar
W. M. Wang
,
W. J. O. Boyle
,
K. T. V. Grattan
, and
A. W. Palmer
,
“Self-mixing interference in a diode laser: experimental observations and theoretical analysis,”
Appl. Opt. , 9 1551
–1558
(1993). Google Scholar
S. S. Ul’yanov
,
V. P. Rayabukho
, and
V. V. Tuchin
,
“Speckle interferometry for biotissue vibration measurement,”
Opt. Eng. , 33
(3), 908
–914
(1994). Google Scholar
A. V. Skripal
and
D. A. Usanov
,
“Semiconductor laser interferometry of eye movements,”
Proc. SPIE , 3908 7
–12
(2000). Google Scholar
F. F. M. de Mul
,
L. Scalise
,
A. L. Petoukhova
,
M. Herwijnen
,
P. Moes
, and
W. Steenbergen
,
“Glass-fiber self-mixing intra-arterial laser Doppler velocimetry: signal stability and feedback analysis,”
Appl. Opt. , 41
(4), 658
–667
(2002). Google Scholar
M. H. Koelink
,
M. Slot
,
F. F. M. de Mul
,
J. Greve
,
R. Graaf
,
A. C. M. Dassel
, and
J. G. Aarnoudse
,
“Laser Doppler velocimeter based on the self-mixing effect in a fiber coupled semiconductor laser: theory,”
Appl. Opt. , 31 3401
–3408
(1992). Google Scholar
S. K. O¨zdemir
,
S. Shinohara
,
S. Takamiya
, and
H. Yoshida
,
“Noninvasive blood flow measurement using speckle signals form a self-mixing laser diode: in vitro and in vivo experiments,”
Opt. Eng. , 39
(9), 2574
–2580
(2000). Google Scholar
H. W. Jentink
,
F. F. M. de Mul
,
H. E. Suichies
,
J. G. Aarnoudse
, and
J. Greve
,
“Small laser Doppler velocimeter based on the self-mixing effect in a diode laser,”
Appl. Opt. , 2 379
–385
(1988). Google Scholar
L. Scalise
,
W. Steenbergen
, and
F. de Mul
,
“Self-mixing feedback in a laser diode for intraarterial optical blood velocimetry,”
Appl. Opt. , 40
(25), 4608
–4615
(2001). Google Scholar
K. Meigas
,
H. Hinrikus
,
R. Kattai
, and
J. Lass
,
“Coherent photodetection for pulse profile registration,”
Proc. SPIE , 3598 195
–202
(1999). Google Scholar
K. Meigas
,
“Method for small particle detection by laser,”
Opt. Eng. , 9 2587
–2591
(1998). Google Scholar
K. Meigas
,
H. Hinrikus
,
R. Kattai
, and
J. Lass
,
“Simple coherence method for blood flow detection,”
Proc. SPIE , 3915 112
–120
(2000). Google Scholar
H. Kakiuchida
and
J. Ohtsubo
,
“Characteristics of a semiconductor laser with external feedback,”
IEEE J. Quantum Electron. , 9 2087
–2097
(1994). Google Scholar
L. Goldberg
,
H. F. Taylor
,
A. Dandridge
,
J. F. Weller
, and
R. O. Miles
,
“Spectral characteristics of semiconductor lasers with optical feedback,”
IEEE J. Quantum Electron. , 18
(4), 555
–564
(1982). Google Scholar
A. Olsson
and
C. L. Tang
,
“Coherent optical interference effects in external-cavity semiconductor lasers,”
IEEE J. Quantum Electron. , 17
(8), 1320
–1323
(1981). Google Scholar
B. Tromborg
,
J. H. Osmundsen
, and
H. Olesen
,
“Stability analysis for a semiconductor lasers in an external cavity,”
IEEE J. Quantum Electron. , 20
(9), 1023
–1032
(1984). Google Scholar
B. Tromborg
,
J. Mork
, and
V. Velichansky
,
“On mode coupling and low-frequency fluctuations in external-cavity laser diodes,”
Quantum Semiclassic. Opt. , 9
(5), 831
–851
(1997). Google Scholar
N. Shunc
and
K. Petermann
,
“Numerical analysis of the feedback regimes for a single-mode semiconductor lasers with external feedback,”
IEEE J. Quantum Electron. , 24 1242
–1247
(1988). Google Scholar
N. Yanong
,
K. T. V. Grattan
,
B. T. Meggitt
, and
A. W. Palmer
,
“Characteristics of laser diodes for interferometric use,”
Appl. Opt. , 28
(17), 3657
–3662
(1989). Google Scholar
|
||||||||||||||||||||||||||||||||


CITATIONS
Cited by 40 scholarly publications and 3 patents.
Semiconductor lasers
Laser resonators
Doppler effect
Optical fibers
Laser damage threshold
Signal processing
Laser optics


