1.IntroductionLocalized reflectance measurements have been used to determine the absorption and reduced scattering coefficients (μa and μs ′) of tissues and turbid media. Light intensity as a function of distance, diffusion theory approximation, or statistical Monte Carlo simulations are usually utilized to estimate μa, μs ′, the effective attenuation coefficient (μ eff ), and light penetration depth (δ) of the tissue or the turbid medium.1 2 3 4 We constructed a localized reflectance optical probe that had the ability to control and vary temperature within a small depth in the tissue. The probe had source-detector distances that ranged between 0.4 and 1.9 mm, which are close to those used by Bevilacqua et al.;5 We report the design and performance of this probe and results of the effect of temperature changes on μa and μs ′ of intact human skin between 590 and 980 nm. Several aspects of the apparatus used in this study were reported.6 7 8 9 Effects of temperature on the optical properties of tissue, thermal effects of laser excitation, and photocoagulation have been of interest in the past few years.10 11 12 13 14 15 16 17 18 19 Transmittance increased and diffuse reflectance signal decreased when the surface temperature of ex-vivo skin or aortic specimens were elevated to 70 °C by laser excitation. The changes were primarily reversible until photocoagulation occurred. Temperature effect on the birefringence of ex-vivo rat-tail tendon was reported and attributed to change in collagen conformation.14 15 16 A reversible temperature effect on near-infrared (600 to 1050 nm) μs ′ of ex-vivo human dermis and subdermis, and linear variation of μs ′ with temperature were reported.18 A nonreproducible temperature effect and random distribution of μa values was observed when tissue temperature was changed between 25 and 40 °C.18 We discuss the effect of heating and cooling intact human skin on the values of cutaneous μa and μs ′. μa and μs ′ in the wavelength range 550 to 980 nm increased on heating and decreased on cooling. The linear relationship between μs ′ and temperature was confirmed. As both μa and μs ′ of skin decreased by lowering the temperature, the calculated light penetration depth (δ) increased as temperature was lowered, indicating cooling-induced transparency of human skin. We studied the optical effects of prolonged probe-skin interaction and the resultant signal drift. We performed single-person and interperson measurements. We determined the fractional change in μa and μs ′, as temperature was modulated over 90-min contact time between skin and the optical probe. The observations are interpreted based on the dependence of blood perfusion and refractive index mismatch on temperature. 2.InstrumentationThe apparatus used in this study comprises a light source module, a tissue interface module, and a signal detection module as shown schematically in Fig. 1. These three modules were interconnected through a branched optical fiber bundle. Light from a 5-W incandescent lamp (Gilway Technical Lamps, Woburn, Massachusetts) powered by a constant voltage source was modulated at 150 Hz by an optical chopper coupled to a lock-in amplifier (Stanford Research Systems, Sunnyvale, California). The light beam was then passed through one of six 10-nm bandpass filters assembled in a filter wheel. A portion of the filtered light was diverted by a beamsplitter and focused onto a silicon photodiode to generate a reference signal, which was used to correct for long-term drift in lamp intensity. The rest of the filtered light beam was focused onto one end of the illuminating fiber housed at the source tip of the fiber bundle. Several filters were used throughout the course of the study, including filters with central wavelengths at 550, 560, 590, 660, 750, 800, 900, 950, and 980 nm. During any one experiment one to six filters were used. The probe tip contained one light introduction fiber and six light collection fibers that were mounted in a 3-mm outer-diameter stainless steel tube, which was situated at the center of a 2-cm-diam, 6.25-mm-thick, aluminum disk shown in Fig. 1. A thermoelectric element was mounted on the backside of the disk and connected to a temperature controller (both from Marlow Industries, Dallas, Texas). A thermocouple (Omega Engineering, Stanford, Connecticut) embedded in the disk was used to deliver a feedback signal to the temperature controller. The optical probe tip, with source fiber and the six light collection fibers (400-μm low-OH silica, Fiberguide Industries, Stirling, New Jersey), and the aluminum disk were components of the temperature-controlled probe or the tissue interface module. The other ends of the light collection fibers were arranged in a circular pattern in the detector tip, in the detection module. The output of each of the six fibers was sequentially focused on a silicon photodiode using a stepper-motor-controlled rotating shutter. The filter wheel was rotated to select a filter. A series of optical measurements were performed while selecting a different source-detector distance by rotating the shutter. Light intensity versus source-detector distance was determined at the selected wavelength, and the process was repeated at the other wavelengths. 3.Calibration and Data Reduction3.1.Measurement of the Optical Fibers ThroughputLight throughput of each fiber, Tfj, was determined by illuminating the common tip of the fiber bundle and measuring the intensity of light transmitted of each fiber. The 5-W source lamp and room light were turned off. A Lieca spotting tungsten lamp was mounted on a lamp stand 2-m away from the probe head, and was aligned to uniformly illuminate the probe and surrounding aluminum disk. Light throughput for fibers 1 through 6 was determined by switching the shutter position through a LabView® routine. The procedure was repeated three times with the spotting tungsten lamp being slightly moved every time. At each spotting lamp position, signal for every fiber was divided by signal for fiber 1. Then such ratios were averaged for three lamp positions to give a throughput factor for each fiber. Typical source-detector distances were: r1=0.44, r2=0.78, r3=0.92, r4=1.22, r5=1.40, and r6=1.84 mm. Typical ratios of light throughput, Tfj, for different fibers were: 1.00, 0.948, 0.961, 0.969, 0.993, and 0.943, respectively, with ±2 variation. 3.2.Light Source Calibration and Data ReductionIn addition to the use of a reference detector, we performed direct measurement of the illuminating intensity at all wavelengths before or after each reflectance measurement and designated this measurement as a “control run.” A photodiode mounted in a fixture was placed in touch with the probe tip of the fiber bundle and connected to a wide dynamic range amplifier (Melles Griot, Boulder, Colorado). The lamp intensity at each wavelength defined as S(c)i was measured at the exit of the source fiber as the signal from the amplifier at wavelength λi. The reference detector signal was R(c)i at the same λi. This setup was used to detect long-term change in the output of the tungsten lamp. The lamp was replaced when its output S(c)i decreased by more than 20. The values of S(c)i and R(c)i were used in the data reduction step. Two data files were generated for each measurement, one for a sample run (sample), and the other for a lamp intensity (control) run. Both files had two columns of data: the signal detector intensity and the reference detector intensity. The output of each measurement was: S(s)ij signal for filter i and aperture j for the sample, R(s)ij the reference signal for filter i and aperture j combination, S(c)i signal for filter i control run, R(c)i the reference signal for filter i control run, and Tfj the throughput factor for fiber j, determined in Sec. 3.1. The corrected localized reflectance of the sample for wavelength (filter) i and source-detector distance (aperture) j is: Dark current measurements were performed for both the sample and the reference detectors before each run and were found to be too small to correct.3.3.Optical Calibration Using Tissue-Simulating PhantomsReflectance data for several solid and liquid phantoms were collected for all sampling distances and wavelengths. Scattering liquid phantoms had different concentrations of a lipid emulsion (10 Intralipid suspension®, Pharmacia Incorporated, Clayton, North Carolina). Liquid tissue-simulating phantoms had similar composition to those used in previous studies.6 8 Absorbing tissue-simulating phantoms contained 0.0 to 5.0 g/dL hemoglobin and 0.65 lipid solution. Tissue-simulating solution phantoms were placed in a 50-mL centrifuge vial covered with a polyethylene film (15-μm-thick commercial Clingwrap® brand, Dow Chemical Company, Midland, Michigan) and secured around the mouth of the vial using a rubber band. The vial was inverted on top of the optical probe and reflectance measurements were performed at each source-detector distance. Opal glass (Edmund Scientific, Barrington, New Jersey) plastic rods loaded with titanium dioxide and a pigment to generate white, and different levels of red colors of different absorption and scattering properties, were used as solid phantoms. The liquid phantoms were used for calibration and solid phantoms were repeatedly run to check measurement reproducibility. 4.Simulation Studies4.1.Monte Carlo Simulation of Photon Trajectories in Dermal TissueWe performed Monte Carlo simulation studies using a program provided by Jacques.4 The calculations are similar to what we reported in previous communications.6 7 8 Simulations were performed according to probe geometry and the following inputs. A 400-μm pencil beam was injected in the tissue model, and the number of photons injected was 200,000 per run. Light was assumed to propagate from fiber (n=1.5) into tissue (n=1.4). Thickness of the tissue layer was set from 5 to 25 mm. Light emitted at each of the 400-μm light collection fibers was calculated for a matrix of a number of μs ′ and μa combinations. The resultant log e Rk versus log e(Rl/Rk) was plotted as a grid for each wavelength λj. Here, Rk is a simplified expression of R(ri,λj) of Eq. (1), which represents the corrected reflectance at a distance rk and Rl represents the corrected reflectance at a distance rl from the source. The constant μa and μs ′ points were connected to form grid lines in the log e Rk versus log e(Rl/Rk) space. Reflectance signals at each source-detector distance were determined for a set of lipid suspensions of different concentrations: hemoglobin solution in lipid suspension, opal glass disks, and plastic rods polymerized to incorporate different levels of the scattering and absorbing pigment. Using the optical probe geometry described in Sec. 2, the Monte Carlo grid generated by the calculations and by graphing log e R1 versus log e(R6/R1) is shown in Fig. 2. R1 was the diffuse reflectance signal measured at fiber 1 and R6 was the diffuse reflectance signal measured at fiber 6. Figure 2Monte Carlo generated grid and superimposed experimental data points. The lines are calculated grid line. The numbers are the μa and μs ′ values. The symbols at the bottom of the grid are the data points for hemoglobin in 0.65 lipid suspension measured at six wavelengths. The circles and diamonds on the right-hand corner are for lipid suspensions at six wavelengths. The (x) symbols in the upper right-hand corner of the grid are for solid plastic phantoms containing titanium dioxide. The (x) symbols on the left center of the grid are for opal glass. The squares are for an orange/red plastic phantom that contained titanium dioxide and a red pigment. Triangles are data points for human skin. 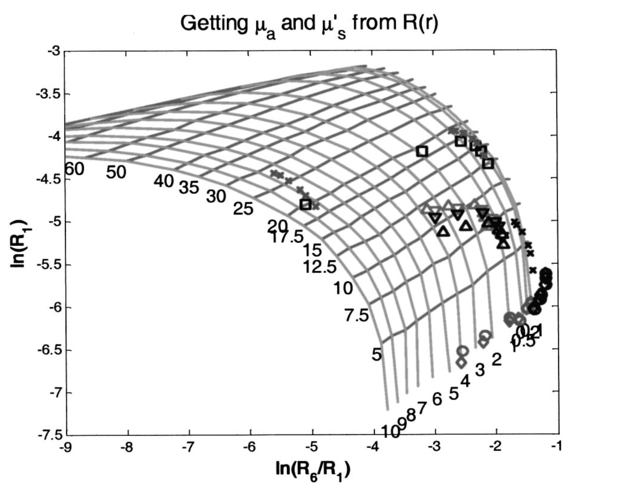 The experimental values were overlapped on the Monte-Carlo-generated grid, and μa and μs ′ of the reference solutions were determined by the use of tables generated from the grid as shown in Fig. 2, where the lines are calculated grid lines and the numbers are the μa and μs ′ values. The symbols at the bottom of the grid are the data points for hemoglobin in 0.65 lipid suspension measured at six wavelengths. The circles and diamonds on the right-hand corner are for lipid suspensions at six wavelengths. The (x) symbols in the upper right-hand corner of the grid are for solid plastic phantoms containing titanium dioxide. The (x) symbols on the left center of the grid are for opal glass. The squares are for an orange/red plastic phantom that contained titanium dioxide and a red pigment. Triangles are data points for human skin. Determination of μa and μs ′ values from spatially resolved (localized) reflectance measurement using a fiber optics probe with a small source detector distance was previously discussed.5 6 9 4.2.Modeling of Thermal Response of Human SkinA model was developed to simulate the temperature response of human skin on contact with the probe disk. The model was constructed in finite-element formalism using the FIDAP software package (Fluid Dynamics Analysis Program, Fluent Incorporated, Lebanon, New Hampshire). The generalized heat diffusion equations were solved for a cylindrical geometry comprising the 2-cm-diam aluminum disk and a 6-cm-diam section of human tissue that was assumed to be 3 cm deep. The top surface of the disk was maintained at a set temperature value between 44 and 20 °C. The initial skin surface temperature was calculated to be approximately 32.2 °C by the model. Initial tissue temperature was calculated to be 32.7 and 33.0 °C at a depth of 1 and 2 mm below the skin surface, respectively. The initial temperatures corresponded to steady-state conditions assumed for a resting human forearm, exposed to a room environment at 22 °C. 4.2.1.Data input and assumptions for the thermal model of human skinThe equations governing the thermal model required input of thermal properties of the disk material and the adjoining tissue, as well as thermal boundary conditions surrounding the system geometry. The 3-cm-deep tissue section was divided into three discrete layers, each having a unique set of thermal properties. The top, or “skin” layer, was assumed to be 2 mm thick and comprised mainly of dermal tissue. The middle layer was assumed to be 3 mm thick and comprised mainly of adipose tissue. The bottom 25-mm layer was assumed to consist mainly of muscle tissue having a fixed body core temperature of 37 °C along its lower boundary. Actual thickness of each layer may vary from person to person. Thin sublayers such as the epidermis (approximately 100 μm thick) were not individually defined within the main layers. This was primarily because we considered that their impact on the overall tissue temperature calculations would have been negligible, and partly because thermal property data for these subdermal layers are not available in the literature. The physical relationship between the tissue boundaries used, the thermal calculation, and the geometry of the optical system is shown in Fig. 3. Inputs of the thermal model are listed in Table 1. Literature data for human tissues were used when available. Specific heat values were not found for human skin or adipose tissue. Data from similar animal tissues were substituted in the calculation as an approximation. Metabolic heat values also were not found for skin or adipose tissue. We assumed that the metabolic heat values to have relatively small contribution of heat produced in the skin. Table 1
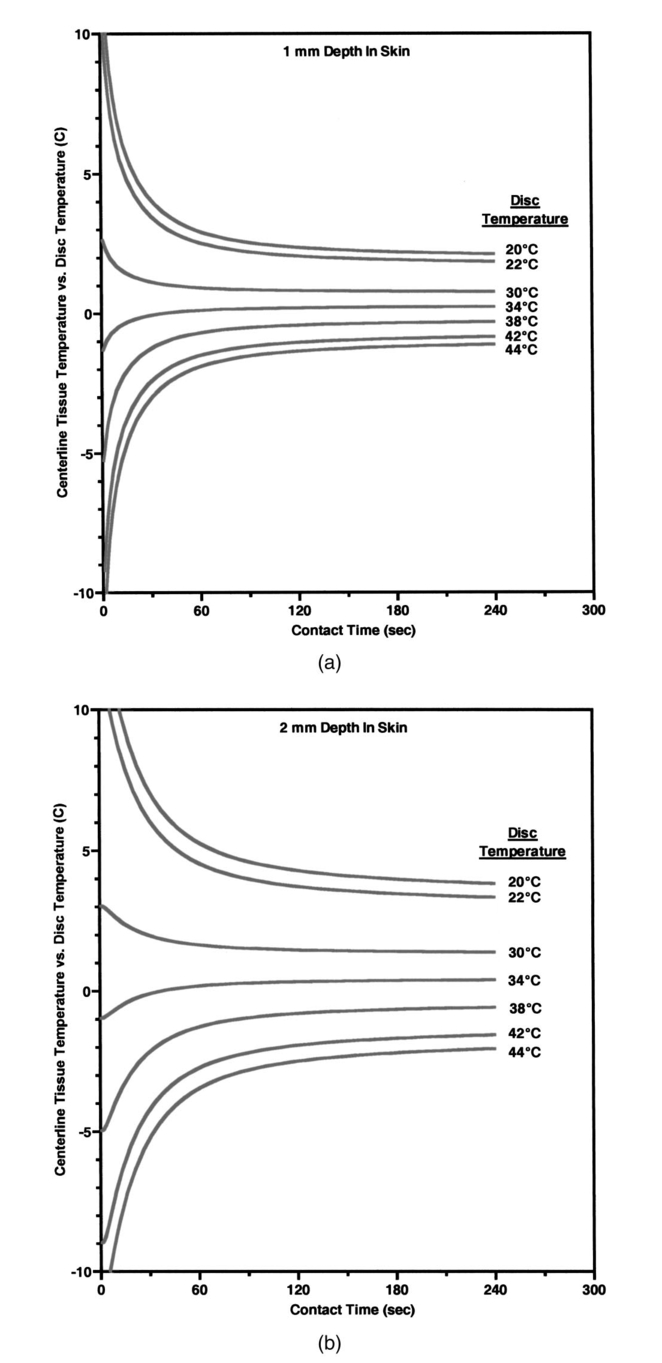
Heat associated with local blood perfusion was incorporated in the model by assuming the blood entered the tissue at 37 °C and exited at the calculated tissue temperature level. The corresponding quantity of heat transferred to the tissue by the blood was expressed as: where W is the local blood perfusion rate from Table 1, Cp is the specific heat value of blood (3840 J/kg °C) and T tissue is the local tissue temperature. Perfusion units in Table 1 incorporate a mass flow (kg/s) of blood, which was obtained by multiplying the volumetric units given in published data by the blood mass density (1060 kg/m3).Thermal calculations of tissue temperature demonstrate that the skin surface rapidly reaches the temperature of the highly conductive aluminum disk surrounding the optical probe. The rapid change creates large temperature gradients in the dermal layer, causing heat conduction to locally dominate other sources of energy such as that resulting from blood perfusion and cellular metabolism. Thermal conductivity was, therefore, the dominant property governing the skin temperature distribution near the probe. Thermal conductivity values within hydrated tissues (skin, muscle, etc.) generally vary by small amounts, as main component of these tissues is water. Therefore, only minor inaccuracies are expected in the model by assuming the sublayers had conductivity values identical to the main layers. Values for the tissue-specific heat were less certain but were not expected to compromise accuracy of the thermal modeling results after the initial 30 s of contact with the probe. Within the first 30 s, the rate of tissue temperature change is greatest and therefore the specific heat values can substantially impact the relationship between temperature and time. Thin sections (sublayers) of tissue, however, have insignificant mass and subsequently any differences between actual and assumed specific heat values were assumed to have negligible effect on the calculated temperature values. A complete set of thermal boundary conditions was applied to the model cylindrical geometry. The lower boundary of the muscle layer (3 cm below the skin surface) was held at 37 °C to represent body core temperature. The radial surfaces of the tissue cylinder (6 cm diam) and the aluminum disk (2 cm diam) were assumed to be adiabatic. The top surface of the disk was held at one of the specified control temperatures. The entire disk material was considered to have the same temperature prior to contact with the skin. A heat transfer coefficient of 20 W/m2 °C was applied to the exposed skin surface to account for gray-body radiation exchange plus a minor amount of ambient air convection (on the order 1 m/s) at an environmental temperature of 22 °C. The effects on heat transfer caused by sweat effusion and evaporation were not accounted for in the model. 4.2.2.Output of the thermal model of human skinUsing the boundary conditions and the thermal properties in Table 1, the model calculated an initial tissue temperature distribution with 32.2 °C on the skin surface. Initial tissue temperatures were expected to represent a resting human forearm that is subjected to 22 °C noncirculating room air. On contact with the disk, the model simulated skin temperature versus time (starting with the initial tissue temperature distribution), as plotted in Figs. 4 5 6. Figure 4Model results of the dependence of cutaneous temperature on contact time with a disk at a constant temperature of 38 °C. The solid lines are for the depth along the centerline, the dotted lines are for the depth along 5 mm from the center.  Figure 5Model results of the dependence of cutaneous temperature on contact time with a disk at a constant temperature of 34 °C. The solid lines are for the depth along the centerline, the dotted lines are for the depth along 5 mm from the center.  Figure 6Model results of the dependence of cutaneous temperature on contact time with a disk at a constant temperature of 20 °C. The solid lines are for the depth along the centerline, the dotted lines are for the depth along 5 mm from the center. 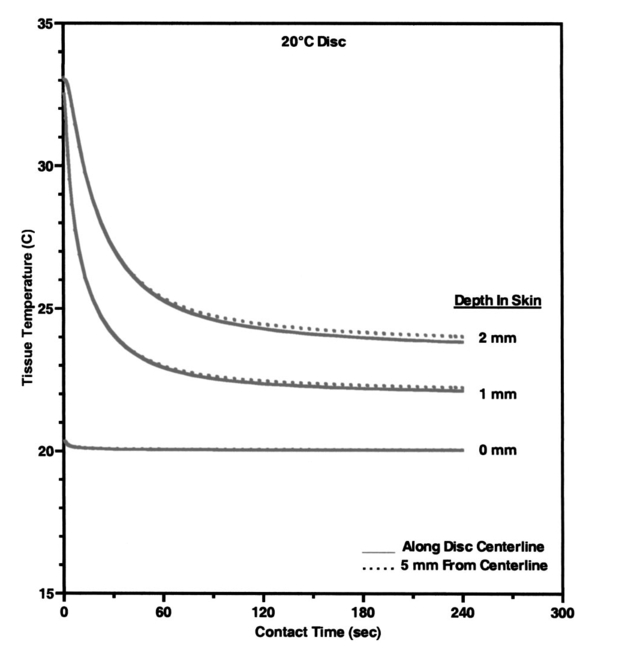 During the period following contact between the disk and the skin surface, the model calculated the rate at which heat was transferred by conduction between the aluminum disk and the skin. The heat conduction caused a continuous temperature change in the tissue during a 240-s contact period, during which the disk temperature remained essentially uniform and constant. At 240 s from the onset of interaction between the aluminum disk and the skin, the tissue approached thermal equilibrium with the disk and surrounding environment, making longer contact periods unnecessary for the model simulation. Figures 4 5 6 plot the calculated temperature history of the skin tissue corresponding to each case of disk temperature. Results are plotted for three tissue depths (including the skin surface, 1 and 2 mm depth) along the disk centerline location and at a radial distance of 5 mm from the disk centerline. The centerline and the 5-mm radial locations differed from each other by a maximum of 0.2 °C during the contact period. Figure 4 illustrates the results when the temperature of the disk was set at 34 °C, which is close to the temperature of the skin surface (32 to 33 °C). The dermis temperature at 1 and 2 mm reached equilibrium quickly and remained constant at a value close to the surface temperature. The equilibrium temperatures were calculated to be very close at the two depths. Figure 5 illustrates the simulation results when the temperature of the disk was set at 38 °C. The skin surface temperature was at the disk temperature (38 °C). The dermis temperature, initially at ≈33 °C at both 1 and 2 mm depth “warmed up” to the surface temperature, approaching 38 °C and equilibrating after approximately 120 s. The calculated equilibrium temperature at a depth of 1 mm differed from its value calculated at a depth of 2 mm in the tissue. At a disk temperature much lower than the skin temperature, i.e., 20 °C, the dermal layer “cooled down” to approach the skin surface temperature as shown in Fig. 6. It reached as asymptotic value after approximately 120 s from the interaction between the probe and the skin, with a larger constant difference between the asymptotic value and the skin surface temperature. In all three plots in Figs. 4, 5, and 6, the solid lines are for the depth along the centerline. The dotted lines are for the depth along 5 mm from the center. There was no significant difference between the calculated temperature values along the centerline of the disk (probe) and at 5 mm away from the center of the disk, which covered twice the area under the optical fibers where the optical measurements are performed. The small difference in calculated temperature at the centerline and at 5 mm away from center can be explained by the ratio of the diameter of the temperature-controlled disk to this 5-mm distance. The diameter of the disk was 20 mm and may be able to overcome skin temperature differences and create temperature equilibrium conditions up to 5 mm away from the center of the disk. Reducing the diameter of the temperature-controlled disk to 10 mm had no effect on the calculated temperatures. A disk diameter of <8 mm showed a difference between the temperatures at the two points. The results of the thermal simulations over multiple temperatures are summarized in Figs. 7(a) and 7(b) for 1 and 2 mm depth in the tissue. Thermal simulations show that it is possible to control tissue temperature at these depths in the tissue. However, there is an offset between the probe and tissue temperatures. The magnitude of the offset depends on the initial probe temperature. The offset between probe and tissue temperatures decreased as the contact time between the probe and skin increased. At a probe temperature of 20 °C, tissue temperature was controlled at a 1 mm depth with an offset of +3 °C after 60 s of contact time with the disk. The offset approached +2 °C after 240 s of contact. At 2 mm depth the offset was +5.3 °C at 60 s and decreased to +3.8 °C at 240 s. At 44 °C tissue temperature was controlled at a 1 mm depth with an offset of −1.9 °C after 60 s of contact time with the disk. At 40 °C, the offset approached −1.1 °C after 240 s of contact. At 2 mm depth, the offset was −4.5 °C at 60 s and decreased to −2.1 °C after 240 s of contact with the probe. Thermal modeling suggests that dermal temperature can be controlled within a depth of 2 mm into the skin and at a radial distance up to 5 mm from the center of the disk (optical probe). Equilibrium between the temperature controlled probe and the skin is reached after 60 to 240 s depending on the difference in their starting temperatures. 5.Experimental Results and Discussion5.1.Experiments on Human SubjectsWe performed four sets of experiments on human subjects using test protocols and informed consent forms approved by the Institution Review Board. All subjects were healthy volunteers from the research laboratories at Abbott Park, Illinois. In the first set of experiments, localized reflectance of the skin of 29 volunteers was measured at six wavelengths ranging between 550 and 900 nm, and at a constant probe temperature of 34 °C, which is close to the average skin temperature. The data were used to calculate μa and μs ′ for a limited population. The data are presented and discussed in Sec. 5.2. In the second experiment, localized reflectance of the skin of five volunteers was measured at 590 nm while the probe temperature was varied between 22 and 41 °C. The limits of this temperature range were selected to vary between room temperature and a maximum temperature tolerated by all volunteers. The data were used to calculate the effect of temperature on μa and μs ′ and is presented in Sec. 5.3. In the third experiment, localized reflectance was measured for seven volunteers, while probe temperature was stepped between 22 and 38 °C. The lower limit was close to room temperature and the upper limit was just above the body core temperature of 37 °C. The data were used to determine the effect of person-to-person variability on the temperature dependence of μa, μs ′, and δ at three wavelengths. These data are discussed in Sec. 5.4. In the fourth experiment, we investigated the effect of long-term interaction between the probe and the skin on the values of μa and μs ′. Localized reflectance of the skin of three volunteers was continuously measured for 90 min, while the probe temperature was repetitively stepped between 22 and 38 °C for 15 temperature cycles. These data are presented and discussed in Sec. 5.5. 5.2.Determination of μa and μs ′ of Human Skin at a Constant TemperatureIn this experiment, reflectance measurements were performed on the dorsal forearms of 29 subjects (including four with dark skin). μs ′ and μa were calculated from the reflectance data and the calibrated grid in log e R6/R1 versus log e R1 shown in Fig. 2. The average values of μs ′ and μa for all individuals at each wavelength were used to calculate photon-reduced mean free path [MFP ′=1/(μa+μs ′)] and light penetration depth (δ=1/μ eff =1/√[3μa(μa+μs ′)]). The calculated MFP ′ (mm) for the 29 subjects at 34 °C was 0.62 mm at 550 nm, 0.72 mm at 590 nm, 0.88 mm at 650 nm, 1.03 mm at 750 nm, 1.1 mm at 800 nm, and 1.23 mm at 900 nm. Thus MFP ′ has the same magnitude as the source-detector distances, indicating a limited number of multiple scattering events per photon.5 The value of δ was 0.72 mm at 550 nm, 0.92 mm at 590 nm, 1.42 mm at 650 nm, 1.67 mm at 750 nm, 1.92 mm at 800 nm, and 2.04 mm at 900 nm. Thus δ is within 2 mm, where the thermal model predicts temperature control of the tissue and also where cutaneous microcirculation is reported to occur.20 5.3.Temperature Dependence of μa and μs ′ of Individual’s SkinIn the second experiment, localized reflectance of the skin of five light-skin subjects was measured at 590 nm with the dorsal side of the forearm in constant contact with the temperature-controlled probe. Temperature was switched back and forth among three values between 25 and 41 °C. Plots of the regression lines for μs ′ versus probe temperature are shown in Fig. 8. Figure 8Relation between μs ′ and probe temperature for several light-skin subjects at 590 nm. Probe temperature was raised stepwise in the range from 25 to 41 °C, and then returned back in the same manner. The lines are the linear least square fitting of the experimental data, with their slopes labeled beside an individual’s line. The letters A through F refer to the different subjects. Tissue temperature deviates from the probe temperature at the upper and lower limits.  Plots of μs ′ versus temperature show no hysteresis in its thermal response, and the data fit straight lines. Data are labeled by subjects A through F. Subjects A, B, D, and F were Caucasian, Mediterranean, or Oriental, ranging in age between 35 and 58 years. Plots A and C are for the same subjects tested at two different times. The fitted slope (∂μs ′/∂T) for individual subjects was 0.053±0.0094 cm −1/°C. The intercept and the slope of the regression lines of μs ′ versus probe temperature plots varied from subject to subject. There is also difference in intercept for different measurements on the same subject, which is probably due to differences in repositioning the probe on skin. The dependence μs ′ on temperature for the intact human skin is similar to that reported for ex-vivo skin.18 The behavior of μa of intact human skin as a function of temperature is different from that of the μs ′. Figure 9 shows a plot of μa at different temperatures, determined at 590 nm and using the same temperature controlling steps used to generate the data in Fig. 8. Measurements are designated A through F in both Figs. 8 and 9. Data used for plots A and C were from measurements performed on the same subject. Figure 9Plot of the absorption coefficient as a function of temperature for the same subjects in Fig. 7. Data points for subjects B, C, and D were connected to show the time sequence of temperature effect on μa. Arrows indicate the direction of time sequences. Wavelength of measurement is 590 nm. 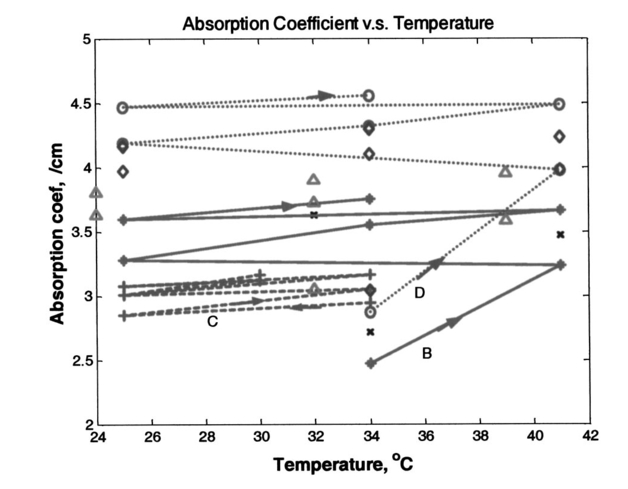 On a first glance the μa data points look randomly distributed in a manner similar to what was observed for ex-vivo human skin.18 However, connecting the data points in the sequence at which the temperature was changed and using arrows to indicate the direction of time sequences reveals an interesting trend shown in Fig. 9. Data points for subjects C, B, and D are connected to show the direction of change in μa. For the case of subject B, starting at 34 °C and raising the temperature to 41 °C, μa increases (as shown by the arrow) by ≈33. Subsequent cooling to 25 °C results in a smaller increase in μa. Heating again to 34 °C and then to 41 °C resulted in a further increase in μa. One more cooling stem to 25 °C resulted in further increase in μa. Returning back to the starting temperature of 34 °C resulted in a net increase in μa. The same behavior can be seen in the connected data points of subject D. Temperature cycling for subject C was performed between 25 and 34 °C and shows similar behavior except for a much limited increase in μa, and an actual decrease on first cooling from 34 to 25 °C. Still, the final value of μa on going back to 34 °C was higher than its starting value. Dependence of μa data of intact human skin in Fig. 9 first shows the short-term irreversibility of μa values on heating to or above 38 °C. Thus μa generally increased on heating and decreased on cooling. Second, the values of consecutively determined μa zigzagged upward. There is a cumulative effect of multiple times of heating and cooling. The value of μa depends on the thermal history of the skin. The upward zigzagging drift of μa can be explained by the pooling of blood in the cutaneous capillaries as temperature was changed. Laser Doppler flowmetry (LDF) measurements indicated enormous variation in the red blood cells flux from comparable sites in the same individual and even for the same site at different times.21 22 Correlation between LDF patterns and morphology of the underlying vasculature identified 1 mm2 areas of vascular “territories” surrounded in part by relatively avascular areas.23 24 The temperature-controlled probe used in this study covers a wide area of the vasculature that is greater than the area probed by the fibers, which are 400 μ in diameter and any of them can be located on the top of these identified heterogeneous vascular structures or a void area in-between. Thus, while each of the fibers collected a localized signal, blood perfusion is affected by the response of the neighboring vascular structures to temperature changes. We now attempt to interpret the results of the second experiment on temperature dependence of μs ′ of the skin of the five subjects shown in Fig. 8. Scattering of a biological tissue containing spherical scattering centers is approximated by Graaff et al.; and simplified by Chance et al.; as25 26: where a is the average radius of scattering particles, ρ is the number concentration of particles, n medium is the refractive index of the medium, λ is the wavelength of light, and m=n scatterer /nm is the mismatch of the refractive index. Equation (3) can be expressed in terms of the volume fraction of the scatterer in the tissue as:27 where φ (=1.33 πa3ρ) is the volume fraction of scattering centers in tissue. It is possible to use Eq. (4) to attempt interpretation of the temperature dependence of μs ′. Temperature can affect μs ′ by changes in one of the terms a, ρ, or m.One possible interpretation of the temperature effect on μs ′ is that scatter size a is changed, while the density ρ is unaffected. This interpretation is based on the assumption of reversible swelling of collagen fibers as a result of temperature change, which was suggested for the case of birefringence changes in rat-tail tendon and ex-vivo human skin scattering changes with temperature.14 15 18 In this case a 3 change in a leads to 7.5 increase in μs ′, and a 10 increase in a leads to a 22.5 increase in μs ′. However, this assumption of increasing scatterer size while the density remains the same only holds if scatterers are sparsely distributed and their volume fraction is low, which is unlikely the case of packed skin structure, thus rendering this interpretation implausible. A second possible interpretation based on Eq. (4) is a change in the dimension of the scatterer a as tissue thermally expands, while the volume fraction of scatterers in tissue remains unaffected. In this case 3 increase in a leads to a 1.8 decrease in μs ′, and 10 increase in a leads to a 5.8 decrease in μs ′. Thus the increase in the size of scattering particles while the volume fraction stays the same leads to a decrease in μs ′, which is contrary to the observed data. This interpretation is also based on the assumption of reversible swelling of collagen fibers as a result of temperature change, as was suggested for the rat-tail tendon and ex-vivo human skin.14 15 18 A third possible interpretation is a change in ρ on heating or cooling, which leads to physically unattainable results, as heating will decrease ρ due to tissue expansion, and hence will lead to a decrease in μs ′ as temperature is raised. As μs ′ values increase with temperature, this interpretation is also implausible. We offer an interpretation that was presented in a preliminary report, and is based on the effect of temperature on refractive index mismatch m, and hence μs ′. 9 n water determined at 589 nm decreases nonlinearly with increasing temperature.28 Since the interstitial fluid (ISF) contents are more than 90 water, it can be assumed that similar to water, n ISF decreases by 0.25 when the temperature rises from 20 to 45 °C. We simulated the change Δμs ′ as a function of temperature under different refractive index mismatch (m=n scatterer /n ISF ) conditions. We assumed that the protein content of ISF is equivalent to that of 3.5 serum, and thus n ISF =1.3351 at 20 °C. We applied a 0.25 decrease in n ISF between 20 and 45 °C. We assumed that the value of n scatterer was independent of temperature between 20 and 45 °C. We used two limits for n scatterer , 1.37 and 1.4, which are close to the reported average value of refractive index of the ex-vivo dermis of n=1.4 and the value of n=1.43±0.2 reported for the upper dermis human arm skin.29 30 A plot of the calculated Δμs ′ based on the aforementioned assumptions is shown in Fig. 10. The calculated values of Δμs ′ increase as temperature increases. The data points fall within the lines determined by the boundary values of m, indicating that the assumptions used in this calculation closely describe temperature dependence of Δμs ′ of cutaneous tissue. The depth in cutaneous tissue where temperature is controlled and varied is ≈2 mm, and the light penetration depth in tissue δ is estimated to vary in the range 0.72 at 550 nm to 2.04 mm at 900 nm. This 2 mm depth encompasses the blood capillaries, upper plexus, lower plexus, and the interconnecting arterio-venus anastomosises (shunts), which take part in the body temperature regulation.23 Changing the temperature of this cutaneous region by heating and cooling will change blood flow into the capillaries by opening and closing the arterio-venus shunts, thus affecting μa of the cutaneous tissue. Figure 10Calculated percent change in the μs ′ as a function of temperature under various refractive index mismatch conditions. The solid lines are the simulation results. The symbols are the experimental results for three subjects.  We interpret the temperature dependence of μa as resulting from the physiological response of the vascular bed surrounding the optical measurement areas. We interpret the observed temperature dependence of μs ′ as a physical phenomenon relating to temperature effect on the refractive index mismatch between the cutaneous fluid medium and cutaneous scattering centers. 5.4.Effect of Interperson Variations on the Temperature Dependence of the Mean of Optical Properties of Human SkinWe performed optical measurements on seven Caucasian and Oriental subjects at two set temperatures. The skin was allowed to equilibrate for 3 min at 38 °C and the optical signal was recorded. The probe temperature was lowered to 22 °C over a 1-min period, and allowed to equilibrate for two min. Then another set of measurements was performed at 22 °C. The μa and μs ′ values were determined for each temperature and wavelength and were used to calculate μ eff and hence δ and MFP ′. As shown in Fig. 11, all μa and μs ′ increased and all δ values decreased as temperature was elevated from 22 to 38 °C. Figure 11Change in μa, μs ′, and δ as a result of temperature change from 22 to 38 °C at wavelengths of 590, 750, and 950 nm.  As shown in Fig. 11, Δμa=[μa(38 °C)−μa(22 °C)]>0, Δμs ′=[μs ′(38 °C)−μs ′(22 °C)]>0, while Δδ=[δ(38 °C)−δ(22 °C)] is negative for each of the seven subjects. Statistical analysis of the mean values of μa, μs ′, and δ is given in Table 2. The student t-test on the sample distributions at the two temperatures indicates that the relationship μa(38 °C)>μa(22 °C) holds across all individuals with greater than 99 confidence, while the relationship μs ′(38 °C)>μs ′(22 °C) holds with less confidence. Structural differences between individual’s skin and positioning of the probe on the skin may have greater effect on the signal than the temperature-induced change in μs ′. The resultant effect of temperature on both μa and μs ′ at the three wavelengths is that δ(22 °C)>δ(38 °C), with greater than 95 confidence. The mean free path MFP ′(22 °C)>MFP ′(38 °C) at 590 nm, but with much less confidence at 750 and 950 nm. Table 2
Increase in light penetration depth in tissue (δ) on cooling is of particular interest, as it may allow mapping lower dermal layers (≈200 μm deeper) by lowering probe temperature. It can also be used to limit optical measurements to the upper layers by heating the skin and using an optical probe of small source detector distances. Temperature dependence of light penetration depth in skin makes it necessary to perform measurement of skin optical properties at a constant temperature. This will minimize errors due to temperature dependence of light penetration in tissue. Controlling skin temperature is necessary to defining the depth from which reemitted light is being collected. 5.5.Temperature Modulation of μa and μs ′ of Skin Over Prolonged Interaction Between the Optical Probe and Skin5.5.1.Time-behavior of thermal modulation plotsStudies of probe-skin contact over a long period of time are relevant to tracking of glucose change during a meal tolerance test or glucose clamp studies. Increase in glucose concentration decreases tissue μs ′. Glucose-independent decrease in μs ′ was also reported.31 32 33 We collected reflectance data continuously over 90 min of probe-skin contact and determined μa and μs ′ as temperature was repetitively stepped between 22 and 38 °C for 15 temperature modulation cycles. Each cycle comprised the following steps: skin was equilibrated for 2 min at a probe temperature of 22 °C, temperature was raised to 38 °C over the course of 1 min, and maintained for 2 min, then lowered to 22 °C over a 1-min period. At each temperature limit (during the 2-min window), four optical data packets were collected and values of μa and μs ′ were determined. Three light-skin volunteers were tested after 12 h of fasting and their glucose levels were determined before and after each experiment and were close to 90 mg/dL. Prior to each experiment, the subject washed his arm with warm water and dried it by blotting with a paper towel. A coupling fluid (silicone oil) was applied to the surface of the probe and on the arm. Plots are shown in Figs. 12, 13, and 14 for these subjects. Figure 12Effect of temperature modulation on μa, μs ′ of subject 1: (a) modulation of μs ′ at the 590 nm (top), 800 nm (center), and 950 nm (bottom); (b) modulation of μa at 590 nm; and (c) modulation of μa at 800 nm (▾) and at 950 nm (•).  Figure 13Effect of temperature modulation on μa and μs ′ of subject 2: (a) modulation of μs ′ at the 590 nm (top), 800 nm (center), and 950 nm (bottom); (b) modulation of μa at 590 nm; and (c) modulation of μa at 800 nm (▾) and at 950 nm (•).  Figure 14Effect of temperature modulation on μa and μs ′ of subject 3: (a) modulation of μs ′ at the 590 nm (top), 800 nm (center), and 950 nm (bottom); (b) modulation of μa at 590 nm; and (c) modulation of μa at 800 nm (▾) and at 950 nm (•). The irregularity in the overall modulation pattern (the peak around the 50-min contact time) is obvious in μa at 590 nm (b) and to a smaller extent in μa at 800 and 950 nm (c). The temperature modulation pattern of μs ′ is similar to that of subjects 1 and 2. 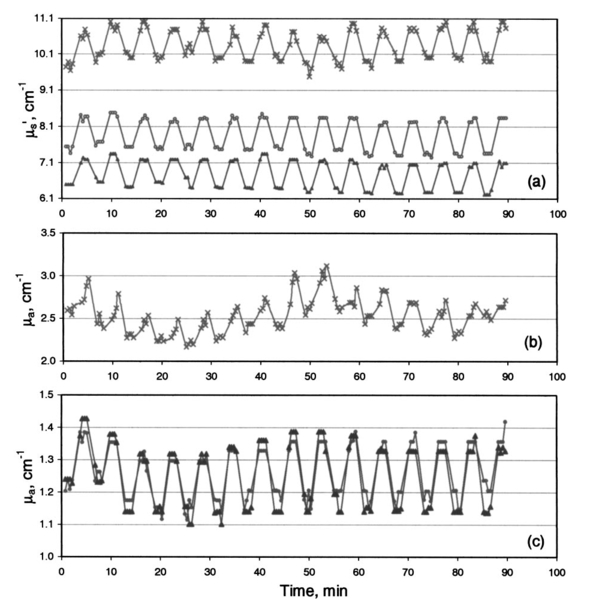 Plots of the time course of temperature modulation reveal several interesting features. First, the fast reversible step change in μa and μs ′ for repeated heating and cooling cycles. Second, the step function is more prominent for μs ′ than μa. Third, the μa and μs ′ plots over time are independent of each other. While μa generally increases in time, μs ′ either decreases or stays the same. Finally, the time course of the 590-nm μa varied from subject to subject. Since we have suggested that the temperature effect on μa and μs ′ are due to different phenomena (Sec. 5.3), the similarity of these plots raises the possibility of incomplete separation between μa and μs ′. We studied the effect of temperature modulation on μa and μs ′ of skin-simulating phantoms.9 We used a 5-mm stack of commercial ham slices as a phantom with no interstitial fluid, no blood, and no blood circulation. There was no temperature modulation in μs ′ values. The temperature response of μa and μs ′ of ham slices was similar to that of opal glass and other solid phantoms. We used a 1.4-cm-thick skin section of freshly euthanized pig as a phantom with interstitial fluid, stationary blood, and no blood circulation. The values of μa determined at several sites of the skin were 0.8 to 1.5 cm−1. The change Δμa between 22 and 38 °C was 0.0 to 0.1 cm−1, leading to a fractional change Δμa/μa of approximately 0.5×10⁻² °C −1. The range of values for nine human subjects was 2 to 3 cm−1 at 590 nm. Δμa (38 to 22 °C) was 0.4±0.12 cm −1, leading to (Δμa/μa) of ≈1×10⁻² °C −1. The change in μs ′ was different. The μs ′ values determined at several sites of the pig skin was 10 to 14 cm−1. The change Δμs ′ between 22 and 38 °C was 0.9 to 1.0 cm−1, leading to a fractional change for pig skin (Δμs ′/μs ′) of ≈0.5×10⁻² °C −1. The range of values for nine human subjects was 9 to 11 cm−1 at 590 nm and Δμs ′ (38 to 22) was 0.68±0.20 cm −1, leading to Δμs ′/μs ′ of ≈0.46×10⁻² °C −1. The pig skin showed the same change in μs ′ and a smaller change in μa compared to that of intact human skin. The diminished temperature response of μa of ham slices and ex-vivo pig skin compared to intact human skin may be due to the absence of blood circulation. The different response of skin-simulating phantoms to temperature modulation from that of intact human skin suggests that there is sufficient separation between μa and μs ′. This is further confirmed by the response of the two coefficients when the skin is heated above 41 °C and cooled. Temperature steps were applied.9 While μs ′ showed a reversible response, μa showed a consistent increase, the two optical parameters were independent. 5.5.2.Calculation of the drift in optical parameters on probe-skin contactThe first two subjects had similar profiles that slightly differed from that of the third. We performed a student t-test on the data of the first two subjects using temperature modulation cycles 1 through 5 and 11 through 15. We used cycles 3 through 6 and 11 through 14 for the third subject. We calculated long-term effects of skin-probe interaction as front-to-end drift in μa, and in μs ′. Comparisons were made among μa and μs ′ (at 22 and 38 °C) calculated for the first 30 min and the last 30 min from the start of probe-skin contact. The time lapse between the mean of the early five cycles and the late five cycles was 1 h. In all temperature-modulation cycles, μa and μs ′ at 38 °C were larger than μa and μs ′ at 22 °C. The drift in the absorption and scattering coefficients was calculated for subjects 1 and 2 as: Drift=100[μ(11–15)-μ(1–5)]/μ(1–5). The quantity μ is either of μa or μs ′, and the numbers in parentheses indicate the range of the temperature modulation cycles on which the coefficients were averaged. The mean values of μa and μs ′ over five temperature modulation cycles were also used to calculate within-cycle fractional changes [Δμa/μa]T and [Δμs ′/μs ′]T, and the drift in these fractional change values. Within-cycle fractional changes [Δμa/μa]T and [Δμs ′/μs ′]T were calculated as: where the temperature T1 was 38 °C and T2 was 22 °C. The fractional change in the μs ′ is related to the temperature effect on the refractive index by a model similar to that used for calculating the data points in Fig. 10.5.5.3.Drift in μa and in μs ′ and in [Δμa/μa]T and [Δμs ′/μs ′]TThe front-to-back drift in μa and in μs ′ values on prolonged skin-probe contact is summarized in Table 3. The mean of μa over five temperature modulation cycles drifts upward by +0.79 to +25.5 (+0.79×10⁻² to +25.5×10⁻²) over the 1-h mean time between the first and last cycles. This increase in μa on prolonged contact with the probe can be explained by blood pooling in the region of contact between the skin and probe. The drift in μs ′ over the same contact period is much smaller, ranging between +0.5 and −3.25 (+0.5×10⁻² and −3.25×10⁻²) and is mostly negative. Table 3
We examined the statistical significance of the drift using the student t-test. The calculated probability that the mean values for the first five cycles and the last five cycles (11 to 15) are from the same population indicates no overlap (i.e., statistically significant drift) between front to back values of μs ′ and μa for subject 1 at both temperatures limits. This also applies for subject 2 at 38 °C for all wavelengths and for the case of subject 2 at 22 °C at 800 and 950 nm. Data for subject 3 showed overlap (i.e., no statistically significant drift) between the initial and final values of μa and in μs ′. The magnitude of the drift and the statistical significance of it varied from person to person. The calculated [Δμa/μa]T and [Δμs ′/μs ′]T for the three subjects are given in Table 4 for a ΔT of 16 °C. [Δμa/μa]T values varied in the range +1.49×10⁻³ °C −1 to +8.73×10⁻³ °C −1 for the three subjects. The calculated drift in [Δμa/μa]T was statistically significant for subjects 1 and 2 (no overlap between initial and final values) and less significant (some overlap) for subject 3. Except for the 950-nm wavelength for subject 1, the front-to-back drift in [Δμa/μa]T ranged between −0.18×10⁻³ to +1.87×10⁻³. Table 4
The drift in [Δμa/μa]T over time is generally positive. Since μa increases as a function of probe-skin contact, this fractional value should decrease. Thus an increase in Δμa overwhelms the possible decrease in the fractional value due to increase in μa. It is noticeable from Figs. 12, 13, and 14 that Δμa increases as a function of contact time, suggesting strong dependence of μa on the thermal history of the sample. [Δμs ′/μs ′]T varied in the range +3.1×10⁻³ to +7.01×10⁻³ (°C−1). The front-to-back drift in [Δμs ′/μs ′]T ranged between +1.1×10⁻³ to −0.19×10⁻³ per hour. Similar to the case of [Δμa/μa]T, [Δμs ′/μs ′]T also increases as a function of time (positive drift). Since μs ′ decreases as a function of probe-skin contact, this fractional value should increase unless Δμs ′ values decrease faster than μs ′. The fractional change [Δμs ′/μs ′]T drifts in an opposite direction to that of μs ′. We now discuss the significance of the drift (or conversely the overlap of initial and final values) of these calculated parameters for prolonged time on the noninvasive determination of analytes in the human body. Glucose induces 5×10⁻⁴ to 1.0×10⁻³ per mmol/L fractional decrease in μs ′ for deep human tissue between 500 and 900 nm.31 32 33 Monte Carlo simulation on phantoms suggests that the calculated effect of 1 mmol glucose or 0.1 °C on μs ′ (i.e., Δμs ′) is −1×10⁻³. 34 The present study suggests that a 1 °C change in cutaneous temperature induces a fractional change in μs ′, [Δμs ′/μs ′]T, equivalent to 5.8 to 11.6 mmol/L of glucose (104 to 209 mg/dL). Additionally, [Δμs ′/μs ′]T varies according to the lengths of probe-skin contact time. Front-to-back drift in μs ′ of cutaneous tissue is large compared to the reported glucose-induced change in the μs ′. 31 32 33 The statistical significance of the drift as gauged by the p values varied by subject and by wavelength. The magnitude of nonspecific drift due to the probe-skin interaction will hamper attempts for noninvasive measurements of analytes by tracking changes in μs ′ values. 6.ConclusionsThe temperature-controlled probe detects photons that are remitted from different depths in the tissue down to ≅2 mm. Thermal modeling suggests that temperature of the tissue volume that is optically sampled can be controlled at a probe temperature up to 44 °C and down to 20 °C. For a given subject, μs ′ is linearly dependent on temperature. Between-person μa is distinguishably larger at 38 than at 22 °C at the wavelengths we studied. Between-person δ is distinguishably higher at 22 than at 38 °C. The major contribution to differentiation in the near-IR light penetration depth δ in tissue is the change in blood μa. In general, δ increased on cooling and was modulated over a large number of temperature cycles. We studied the thermal aspects of probe-skin interaction. We attempted to separate the short-term temperature effect from the long-term effect of the probe-skin interaction. We interpret the short-term reversible change in μa to blood perfusion. We attribute the long-term upward drift in μa to increased blood pooling in the dermis. We attribute the short-term change in μs ′ to the effect of temperature on n ISF . We attribute the long-term decrease in μs ′ during skin-probe contact to structural factors in the skin. Hydration of the protein fibers may cause a slow and consistent decrease in μs ′ due to change dimensions of the scattering centers at constant volume fraction. We recognize three effects of probe-skin interaction. First, there is a short-term reversible within-temperature-modulation cycle of μa and μs ′. Second, superimposed on this is a long-term drift in μa and μs ′. Third, there is a change in [Δμa/μa]T and [Δμs ′/μs ′]T on prolonged probe-skin interaction that varies for each individual and wavelength. The instantaneous and reversible temperature dependence of μs ′ over a number of cycles suggests that it is a physical phenomenon related to the effect of temperature on the refractive index mismatch between cutaneous scattering centers and surrounding medium. Temperature dependence of μa results from physiological response of the vascular bed and surrounding areas. We compared the effect of temperature change and probe-skin interaction on the measured and calculated effect of glucose on cutaneous scattering coefficients. The effect of glucose concentration is within the range of change in μs ′ induced by 1 °C-temperature change and natural drift at a constant temperature. AcknowledgmentWe acknowledge the help of Ronald Hohs in electronic design, Dr. Arnold Stalder in optical design, Dr. Wolfgang Haller at the National Institute for Science and Technology for construction of the solid phantoms, and Dr. Steven Jacques (Oregon Graduate Research Institute) for the Monte Carlo program. We appreciate the encouragement of Professor Jan Greves (University of Twente, the Netherlands) and Dr. James Babb, Abbott Laboratories. REFERENCES
R. A. J. Groenhuis
,
J. J. Ten Bosch
, and
H. A. Ferwerda
,
“Scattering and absorption of turbid materials from reflection measurement, 1. Theory,”
Appl. Opt. , 22 2456
–62
(1983). Google Scholar
A. Kienle
,
L. Lilge
,
M. S. Patterson
,
R. Hibst
,
R. Steiner
, and
B. C. Wilson
,
“Spatially resolved absolute diffuse reflectance measurements for noninvasive determination of optical scattering and absorption coefficients of biological tissue,”
Appl. Opt. , 35 2304
–14
(1996). Google Scholar
F. Bevilacqua
,
D. Piguet
,
P. Marquet
,
J. D. Gross
,
B. J. Tromberg
, and
Depeursinge
,
“In vivo local determination of tissue optical properties: applications to human brain,”
Appl. Opt. , 38 4939
–4950
(1999). Google Scholar
R. A. Bolt
,
J. Kanger
,
F. F. de Mul
,
X. Wu
,
S. Yeh
, and
O. S. Khalil
,
“Determination of optical properties of strongly absorbing turbid media,”
Proc. SPIE , 3917 168
–175
(2000). Google Scholar
S. J. Yeh
and
O. S. Khalil
,
“Multivariate method for the determination of tissue optical properties from diffuse reflectance profiles,”
Proc. SPIE , 3597 456
–464
(1999). Google Scholar
X. Wu
,
S. J. Yeh
,
T. W. Jeng
, and
O. S. Khalil
,
“Non-invasive determination of hemoglobin and hematocrit using a temperature-controlled localized reflectance tissue photometer,”
Anal. Biochem. , 287 284
–293
(2000). Google Scholar
S. J. Yeh
,
O. S. Khalil
,
C. F. Hanna
,
S. Kantor
,
X. Wu
,
T-W. Jeng
, and
R. A. Bolt
,
“Temperature dependence of optical properties of in-vivo human skin,”
Proc. SPIE , 4250 455
–461
(2001). Google Scholar
W. C. Lin
,
M. Motamedi
, and
A. J. Welsh
,
“Dynamics of tissue optics during laser heating of turbid media,”
Appl. Opt. , 35 3413
–3420
(1996). Google Scholar
J. W. Pickering
,
S. Bosman
,
P. Posthumus
,
P. Blockland
,
J. F. Beek
, and
M. J. C. van Gemert
,
“Change in the optical properties (at 632.8 nm) of slowly heated myocardium,”
Appl. Opt. , 32 367
–371
(1992). Google Scholar
F. Chambettaz
,
F. M. Weible
, and
R. P. Salathe
,
“Temperature dependence of reflectance and transmittance of the artery exposed to air during laser irradiation,”
IEEE Trans. Biomed. Eng. , 40 105
–107
(1993). Google Scholar
W. C. Lin
,
M. Motamedi
, and
A. J. Welsh
,
“Nonlinear optical behavior of ocular tissue during laser irradiation,”
Appl. Opt. , 34 7979
–7985
(1995). Google Scholar
D. J. Maitland
and
J. T. Walsh
,
“Quantitative measurements of linear birefringence during heating of native collagen,”
Lasers Surg. Med. , 20 310
–318
(1997). Google Scholar
V. Sankaran
and
J. T. Walsh
,
“Birefringence measurements of rapid structural changes during collagen denaturation,”
Photochem. Photobiol. , 68 846
–851
(1998). Google Scholar
D. Beghuin
,
K. Schonenberger
,
G. Delacretaz
, and
R. P. Salathe
,
“Temperature-related reversible birefringence changes in rat tendon,”
Appl. Opt. , 39 3388
–3395
(2000). Google Scholar
Y. Kakihana
,
M. Kessler
,
A. Krug
,
H. Yamada
,
T. Oda
, and
N. Yoshimura
,
“Dynamic change in intercapillary hemoglobin oxygenation in human skin following various temperature changes,”
Microvasc. Res. , 56 104
–112
(1998). Google Scholar
J. Laufer
,
R. Simpson
,
M. Kohl
,
M. Essenpreis
, and
M. Cope
,
“Effect of temperature on the optical properties of ex vivo human dermis and subdermis,”
Phys. Med. Biol. , 43 2479
–2489
(1998). Google Scholar
J. T. Bruulsema
,
J. E. Hayward
,
T. J. Farrell
,
M. Essenpreis
, and
M. S. Patterson
,
“Optical properties of phantoms and tissue measured in vivo from 0.9–1.3 mm using spatially resolved diffuse reflectance,”
Proc. SPIE , 2979 325
–334
(1997). Google Scholar
I. M. Braverman
,
“The cutaneous microcirculation: ultrastructure and microanatomical organization,”
Microcirculation (Philadelphia) , 4 329
–340
(1997). Google Scholar
T. Tenland
,
E. G. Salerud
,
E. G. Nilsson
, and
P. A. Oberg
,
“Spatial and temporal variations in human skin blood flow,”
Int. J. Microcirc.: Clin. Exp. , 2 81
–90
(1983). Google Scholar
A. A. K. Hassan
and
J. E. Tooke
,
“Effect of change in local skin temperature on postoral vasoconstriction in man,”
Clin. Sci. , 74 201
–206
(1988). Google Scholar
I. M. Braverman
,
A. Keh
, and
D. Goldminz
,
“Correlation of laser Doppler wave patterns with underlying microvascular anatomy,”
J. Invest. Dermatol. , 95 283
–286
(1990). Google Scholar
R. Graaff
,
J. G. Aarnoudse
,
J. R. Zijp
,
P. M. A. Sloot
,
F. F. de Mul
,
J. Greve
, and
M. H. Koelink
,
“Reduced light-scattering properties for mixtures of spherical particles: a simple approximation derived from Mie calculations,”
Appl. Opt. , 31 1370
–1376
(1992). Google Scholar
B. Chance
,
H. Liu
,
T. Kitai
, and
Y. Zhang
,
“Effect of solutes on the optical properties of biological materials,”
Anal. Biochem. , 227 351
–362
(1995). Google Scholar
H. Lui
,
B. Beauvoit
,
M. Kimura
, and
B. Chance
,
“Dependence of tissue optical properties on solute-induced change in refractive index and osmolality,”
J. Biomed. Opt. , 1 200
–211
(1996). Google Scholar
A. Knuttel
and
M. Boehlau-Godau
,
“Spatially confined and temporally resolved refractive index scattering evaluation of human skin performed with optical coherence tomography,”
J. Biomed. Opt. , 5 83
–92
(2000). Google Scholar
J. Maier
,
S. Walker
,
S. Fantini
,
M. Franceschini
, and
E. Gratton
,
“Non-invasive glucose determination by measuring variations of the reduced scattering coefficient of tissues in the near-infrared,”
Opt. Lett. , 19 2062
–64
(1994). Google Scholar
J. T. Bruulsema
,
J. E. Hayward
,
T. J. Farrell
,
M. S. Patterson
,
L. Heinemann
,
M. Berger
,
T. Koschinsky
,
J. Sandhal-Christiansen
,
H. Orskov
,
M. Essenpreis
,
G. Schmelzeisen-Redeker
, and
D. Bo¨cker
,
“Correlation between blood glucose concentration in diabetics and noninvasively measured tissue optical scattering coefficient,”
Opt. Lett. , 22 190
–192
(1997). Google Scholar
L. Heinemann
and
G. Schmelzeisen-Redeker
,
“Non-invasive continuous glucose monitoring in Type I diabetic patients with optical glucose sensors,”
Diabetologia , 4 848
–854
(1998). Google Scholar
J. Qu
and
B. Wilson
,
“Monte Carlo modeling studies of the effect of physiological factors and other analytes on the determination of glucose concentration in vivo by near infrared optical absorption and scattering measurements,”
J. Biomed. Opt. , 2 319
–325
(1997). Google Scholar
|
|||||||||||||||||||||||||||||||||||||||||||||||||||||||||||||||||||||||||||||||||||||||||||||||||||||||||||||||||||||||||||||||||||||||||||||||||||||||||||||||||||||||||||||||||||||||||||||||||||||||||||||||||||||||||||||||||||||||||||||||||||||||||||||


CITATIONS
Cited by 50 scholarly publications and 4 patents.
Skin
Tissues
Temperature metrology
Modulation
Tissue optics
Blood
Scattering


