1.IntroductionImmunofluorescence is a well-established and powerful technique to demonstrate the spatial distribution of a protein of interest within single cells or complex biological tissue. Double immunofluorescence with spectrally distinct fluorophores can also determine whether a pair of proteins co-localize, with a resolution limited by the wavelengths of light used for the measurements, or approximately 0.5 μm. Antibodies provide very high specificity, and fluorescence measurements exhibit high sensitivity, with low background. Therefore, measurements of fluorescence intensities have proven highly useful for characterization of the spatial localization of specific proteins within biological cells or tissues. By exploiting fluorescence resonance energy transfer (FRET), the spatial resolution of co-localization of two fluorophores is increased to the scale of 5 nm.1 FRET depends on the close physical interaction of two fluorophores, a donor and an acceptor; it is dependent on the distance between them to the sixth power and does not occur if this distance exceeds ∼10 nm. 1 The fluorophores also need to fulfill two other requirements: The emission spectrum of the donor must overlap with the excitation spectrum of the acceptor and the dipoles of the molecules must be oriented appropriately to allow energy transfer.1 These requirements are relatively easy to achieve, and measurements of FRET can be performed using fluorescein as the donor and rhodamine as the acceptor. FRET can be detected in several ways. Using standard fluorescence intensity measures, FRET is characterized by a quenching of the donor fluorescence with a corresponding emission of acceptor fluorescence, all while exciting at the donor’s absorption peak. In ideal cases, these measures would be large and interpretable, but in reality the signals are small and plagued by interference from crosstalk between direct excitation of the acceptor at the donor excitation wavelengths and emission of the donor extending to the acceptor emission wavelengths.2 The most convincing measure of FRET in spatially interesting biological tissues involves photobleaching the acceptor fluorophore independently of the donor and measuring the resultant dequenching of the donor fluorescence that resulted from FRET.1 3 4 This technique is reliable, but makes spatially distinct measurements difficult and tedious and is destructive. This technique cannot be performed on dynamic processes occurring in living cells or tissue. An alternative to measurements of FRET based on fluorescence intensity depends on fluorescence lifetime determina- tions. Lifetimes are the average amount of time fluorophores spend in the excited state before emitting a photon and returning to the ground state; they are measured in nanoseconds.1 5 6 The fluorescence lifetime of a fluorophore is affected by its local microenvironment and by FRET. In the presence of a suitable acceptor within a distance for FRET, the lifetime of a donor’s fluorescence will decrease and can be measured quantitatively.7 8 The decrease in lifetime is proportional to the distance between the donor and the acceptor. Fluorescence lifetime imaging microscopy (FLIM) allows quantitative determinations of the distance between a donor and an acceptor fluorophore on the scale of nanometers, but with the added benefit of microscopic imaging within cells or tissue, to pinpoint where in a biological tissue, within the resolution of the light microscope, the FRET is occurring. Our approach utilizes FLIM measurements in the time domain, which also permits quantifying the proportion of molecules displaying FRET within a microscopic region. In this report, we describe the characteristics of the commonly used FRET pair fluorescein and rhodamine using a commercially available multiphoton microscope and time-correlated single-photon counting hardware and software for FLIM measurements. We demonstrate that FLIM measurements allow easy and quantifiable measures of FRET within biological tissue with high spatial resolution. These results lay the groundwork for quantitative FRET analysis in a variety of immunolabeled cells or tissue. We also demonstrate that green fluorescent protein (GFP) color variants are amenable to FRET measurements with FLIM using our system. After investigating some of the fundamental characteristics of the fluorescence lifetimes of fluorophores suitable for biological investigations, we apply double immunofluorescence to tissue from transgenic mouse models of Alzheimer’s disease. This disease is characterized by the progressive accumulation of senile plaques, composed primarily of the amyloid-β peptide.9 10 Amyloid-β forms β-sheet structures within subclasses of senile plaques, and the distribution of this morphological form of amyloid-β may occur on multiple spatial scales, both between types of plaques and within individual plaques. We demonstrate that double immunofluorescence with distinct anti-amyloid-β antibodies can lead to detectable differences in co-localization of epitopes within 10 nm, detectable by FRET using FLIM, possibly suggesting differences between intra- and intermolecular FRET. 2.ResultsWe have been using commercial multiphoton microscopes for in vivo imaging of senile plaques in transgenic mouse models of Alzheimer’s disease.11 12 13 14 Multiphoton microscopy depends on pulsed near-infrared lasers with high peak power, which is easily achieved when the pulses are ∼100 fs, as with Ti:sapphire lasers (Tsunami, 10-W Millenia Xs pump laser, Spectra Physics). These lasers are not inexpensive, but provide an ideal pulsed excitation source for time-domain FLIM, with a repetition rate at about 80 MHz. At this rate, a new pulse occurs every 12.5 ns or so, allowing a sampling rate that is above the Nyquist frequency for most fluorescence lifetime applications. The laser is coupled to a commercial multiphoton microscope (Radiance 2000, Biorad) that allows several scanning speeds and multiple image sizes. Synchronization signals from the Biorad scan head are fed directly to the high-speed time-correlated single-photon counting (TCSPC) acquisition hardware (SPC-830, Becker & Hickl). This allows pixel-by-pixel registration of the accumulated photons with the laser scanning. Figure 1 (see Color Plate 1) shows a schematic of the optical setup. The FLIM acquisition board allows up to 4096×4096 pixels with reduced temporal resolution, or up to 2048 time bins at lower spatial resolution for the most accurate lifetime determinations. We routinely use 128×128 pixels at 256 time bins per pixel (∼40 ps per time bin) as a compromise among short acquisition times, good spatial resolution, and high temporal resolution of the fluorescence decays. Figure 1Schematic representation of the FLIM acquisition system. A femtosecond pulsed Ti:sapphire laser (Tsunami, Spectra Physics) is used for fluorescence excitation. This generates a pulse train at about 80 MHz. A commercial multiphoton microscope (Radiance 2000, Biorad) is used for laser scanning, coupled to an upright microscope (BX50, Olympus). Fluorescence imaging is achieved either with the multiphoton acquisition software (Lasersharp, Biorad), or with the FLIM acquisition software (SPCImage, Becker & Hickl). Fluorescence lifetimes are recorded using a high-speed photomultiplier (PMH-100, Becker & Hickl) and a fast time-correlated single-photon counting acquisition board (SPC-830, Becker & Hickl) that allows high temporal resolution lifetime acquisition with high spatial resolution imaging. Laser pulse synchronization signals together with x-y scan synchronization signals allow assignment of the collected photons resulting from each laser pulse on a pixel-by-pixel basis. Acquisition time depends on the sample, but generally requires several minutes of scanning. Fluorescence lifetimes are calculated from the raw data with single or multiexponential curve fits through the 256 time bins within each pixel. A matrix is created with the curve fit data for each pixel, allowing color coding by lifetime, superimposed over the intensity image. Color Plate 1 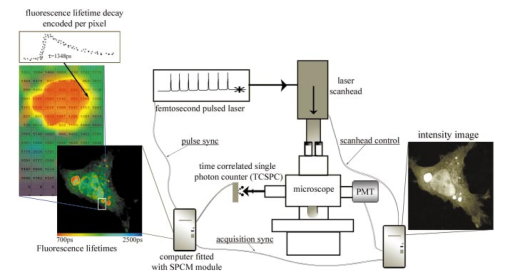 The choice of detectors is particularly important, since it is desirable to have both high sensitivity and very fast response times. We are using a fast photomultiplier tube with a FWHM response time of about 150 ps (PMH-100, Becker & Hickl). This detector is fast enough to resolve lifetimes shortened by FRET, but the detector is also rugged, reliable, inexpensive, and suitable for a multiuser facility with both experienced and inexperienced operators. The data analysis software (SPCImage, Becker & Hickl) allows multiexponential curve fitting of the acquired data on a pixel-by-pixel basis using a weighted least-squares numerical approach.15 The sum of all time bins is equivalent to the intensity image, and this is displayed to an image pseudocolored according to the curve-fit results. A matrix is created with the curve-fit data for each pixel, and a pseudocolor range can be defined for the exponential decay time results. The images can be color coded to display the distribution of any one of three exponential decay times or the mean decay per pixel. Therefore each image can be easily displayed in a meaningful way to compare lifetimes within or between other images. In order to characterize this system for meaningful FRET results, we began with genetic constructs expressing color variants of green fluorescent protein. We made constructs based on the established FRET pair CFP-YFP.16 17 18 Expression vectors for each of these fluorophores were made, as well as a fusion construct linking CFP to YFP for maximal FRET. Using these tools transfected into live cells, we imaged the lifetimes of CFP alone, YFP alone, and the fusion of CFP-YFP, as shown in Fig. 2 (see Color Plate 2). Fluorescence emission was collected using a 480-nm bandpass filter and BG39 glass for rejection of the excitation source, which was tuned to 740 nm. This wavelength was chosen because it excites CFP without exciting YFP, minimizing crosstalk. The results show that CFP alone exhibited a single fluorescence decay of 2.9±0.1 ns that was homogeneously distributed throughout each cell. When fused to YFP, however, the single fluorescence lifetime of CFP was shortened to 1.8±0.1 ns. These values were obtained by averaging the single exponential curve-fit results within areas of interest in groups of cells for each condition. CFP cotransfected with YFP leads to a lifetime indistinguishable from that of CFP alone, since there is no FRET, and YFP alone is not detected with this choice of excitation wavelength and emission filter. The absence of signal in the cells transfected with YFP alone under these imaging conditions suggests that autofluorescence contributes a negligible signal in the bright, CFP-transfected cells. These results demonstrate that FRET between CFP and YFP can be easily detected using FLIM, permitting experiments with ge- netically encoded functional markers based on FRET between this pair of fluorophores.19 20 Figure 2CFP and YFP exhibit FRET that is detectable with FLIM. Genetic constructs were made that express CFP alone, YFP alone, or CFP-YFP as a fusion protein. These constructs were transfected into a clonal cell line (H4), and imaged in vitro with FLIM 24 h after transfection. The cells were maintained in Hank’s balanced salt solution (Gibco) containing 10 mM N -2-hydroxyethylpiperazine- N -2-ethane sulfonic acid (HEPES) at 22 °C. Images were acquired using a 20×water immersion objective (Olympus, NA=0.95) , for 3 min for each sample at 512×512 pixels, at a rate of 1 frame/s. FLIM images are binned spatially to 128×128 pixels for these experiments. A bandpass filter (480/DF30-nm Chroma Technology) with BG39 glass to block excitation wavelengths was used for image acquisition. In (a), cells expressing CFP alone have a single lifetime component of 2.9±0.1 ns. The images are pseuodocolored according to fluorescence lifetimes from 1.5 (blue) to 3.0 ns (red). YFP (b) is not excited with multiphoton excitation at 740 nm. CFP cotransfected with YFP (c) yields a fluorescence lifetime indistinguishable from CFP alone-transfected cells, 2.9±0.1 ns, indicating that there is no FRET between these individual proteins. However, when CFP is fused to YFP in the same construct, the fluorophores are forced into close proximity and the lifetime of CFP is reduced in these cells to 1.9±0.1 ns, indicative of FRET. Scale bar=20 μm. 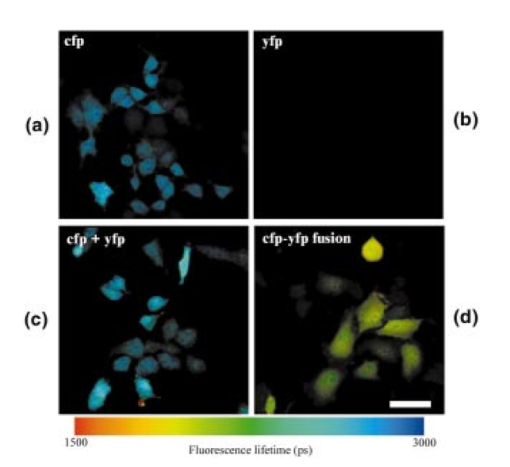 In previous work, we determined FRET between pairs of antibodies targeted with appropriately labeled antibodies.4 21 22 23 24 We sought to both confirm the validity of FRET measurements with FLIM and to understand better the potential conflicts from environmental factors, such as concentration dependence, pH, and conjugation to proteins on the fluorescence lifetimes. Figure 3 shows the pH dependence of the lifetime of fluorescein in solution, both free and coupled to an immunoglobulin G (IgG) antibody. Fluorescent samples were placed in glass capillary tubes and imaged with a 20× water immersion objective (Olympus). The concentration of fluorophore in each sample was 10 μM. We found no differences in measured lifetimes from concentrations that were barely detectable up to about 1 mM fluorescein, where homo-FRET or inner filtering effects made measurements noticeably complex. Photons were acquired for 3 min per sample, increasing the laser intensity as necessary for low pH samples, since the quantum yield of fluorescein drops significantly at these levels. Care was taken not to exceed the count rate of the detector, which was 2×10⁶ photons/s. The resulting images accrued about 1×10⁴ photons per pixel, distributed over the 10 ns lifetime acquisition range. Average values from the curve-fit results were determined from approximately 6000 pixels in a rectangular area of interest for each sample. The results demonstrate that the lifetime of fluorescein at pH 7.4 is shortened from ∼3.9 to ∼2.6 ns when covalently labeled to an antibody, and that there is a weak linear decrease in lifetime with decreasing pH. Both free and labeled fluorescein exhibit a similar dependence on pH. These results indicate that the decrease in lifetime when the antibody is labeled is important for interpreting FRET data, since a comparison cannot be made with established values of the lifetime of free fluorescein, but must be made with measured values of each labeled antibody. The pH dependence of the lifetime of fluorescein supports previously reported values describing different prototropic forms of fluorescein.25 In our samples, however, we did not observe complex exponential decays of fluorescein fluorescence at any pH, despite the probable existence of multiple lifetimes in some of the samples. This may reflect an inability of our system to differentiate lifetimes that are close to each other. The use of faster photon-counting detectors, such as a microchannel plate detector and/or increased temporal resolution of the TCSPC acquisition may permit resolution of mixtures of fluorophores with similar lifetimes. Figure 3pH dependence of fluorescein and fluorescein-labeled IgG antibody. Samples of either free fluorescein or fluorescein-labeled antibody (10d5, Elan Pharmaceuticals) were prepared in triethanolamine-buffered saline (TBS) supplemented with citrate, at varying concentrations of H +. The samples were loaded into glass capillary tubes (borosilicate, 1 mm diameter, WPI), and placed on the stage of the multiphoton microscope. Each sample was scanned for 3 min while fluorescence lifetimes were acquired using a 20×water immersion objective (Olympus, NA=0.45) . The FLIM images were processed for lifetimes and summary data for each sample were obtained by averaging the lifetimes within a large region of interest in the spatially uniform field. Measurements were performed in triplicate for each sample. The free fluorescein solutions have longer lifetimes than the fluorescein-labeled antibody, and each shows a weak dependence on pH, with the lifetimes higher at elevated pH. 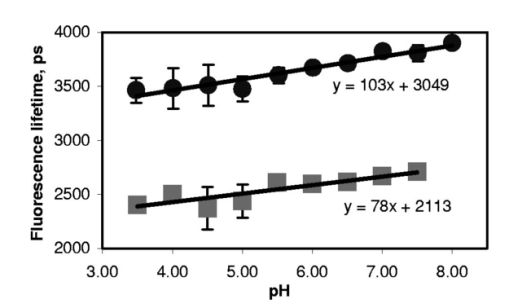 A similar, popular technique for targeting fluorophores to biologically relevant molecules relies on the highly specific and sensitive binding of biotin and streptavidin. With this technique, biotinylated antibodies are used to target the epitopes, and fluorescently labeled streptavidin conjugates are used to target the biotin. Figure 4 demonstrates the effect on the fluorescence lifetime of fluorescein when bound to streptavidin in the presence of either free biotin or biotinylated antibody. Samples buffered at pH 7.4 were placed in glass capillary tubes and lifetime images were acquired for 3 min per sample. The lifetimes for each sample were determined by averaging the curve-fit results in rectangular areas of interest, comprising at least 5000 pixels. Samples were prepared and imaged in triplicate. The lifetime of fluorescein streptavidin (4,6-dichlorotriazin-2-ylaminofluorescein DTAF-streptavidin, Jackson Immunologicals) is 2.6±0.03 ns, and is unaffected by the presence of free biotin 2.6±0.01 ns, but increased slightly by the presence of biotinylated antibody (goat anti-mouse, Jackson, 2.7±0.03 ns, p<0.05, Student’s t -test). Within each sample, the pixel-to-pixel noise was less than 50 ps, allowing separation of the two lifetime values, but probably only within bright samples and not biological specimens. This result indicates that the streptavidin-biotin technique for immunofluorescence is slightly but significantly sensitive to the direct labeling of the biotinylated antibody and is amenable to FRET determinations, which is similar to the results obtained with fluorescein-labeled antibodies. Figure 4Lifetime dependence of labeled streptavidin complex. Solutions of DTAF-streptavidin (Jackson Immunologicals) were placed in glass capillary tubes at 0.1 mg/ml in phosphate-buffered saline (PBS). Fluorescence lifetime images were acquired for 3 min using 800 nm excitation and a green emission filter (515df30, Chroma Technology). The average values were determined from within each sample. The streptavidin-antibody solution resulted in aggregates that precipitated but still allowed lifetime measurements. Fluorescein-labeled streptavidin with free biotin led to a slight but insignificant decrease in fluorescence lifetime. In the presence of biotinylated antibody, however, the lifetimes are modestly elevated, suggesting a dequenching of the fluorophore (p<0.05, Student’s t -test). 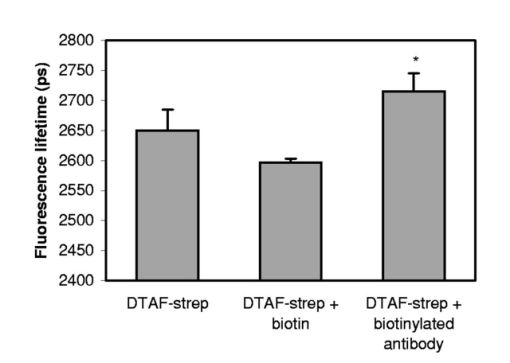 In order to show FRET between fluorescein and rhodamine in a controlled manner, we made peptides with either single or double labels of fluorescein and rhodamine. An 8-amino acid peptide was labeled either singly, at the N-terminal, or doubly at each terminal. In the absence of any secondary structure, the N and C terminals of an 8-mer are well within the Forster’s distance for FRET. In fact, the fluorescence lifetime of fluorescein decreases from 3.2±0.1 ns in the singly-labeled peptide to 1.6±0.05 ns in the doubly-labeled peptide. This result indicates that our FLIM setup is easily able to measure FRET between this fluorescein and rhodamine. One of the advantages of using FLIM to measure FRET, however, particularly with time-domain measurements, is that it is possible to not only measure the degree of FRET on a pixel-by-pixel basis, but also the proportion of FRETing molecules within each pixel. This is possible since the curve-fitting procedure results in both a lifetime measure and an amplitude measure, so that with a multiexponential fit, the fraction of FRETing molecules is deconvolved with the degree of FRET. To test the sensitivity of this measure with our system, we mixed, in varying ratios, known concentrations of singly and doubly-labeled peptides to generate a calibration curve, as shown in Fig. 5. Each sample has two FRETing populations, but at different proportions. By fixing the lifetimes during curve-fitting at each of the measured lifetimes of the 0 and 100 samples, the amplitudes of the exponents become the dependent variables. The amplitudes provide a measure of the proportion of fluorescence lifetimes contributing to each decay. The mixtures exhibit a linear response in the amplitude of the FRET-derived fluorescence lifetime, indicating that our experimental technique is capable of resolving both the degree of FRET and the proportion of FRET in a spatially resolved way. This result demonstrates that two lifetimes in a mixed population can be distinguished and assigned a relative amplitude that is proportional to their relative concentration. While we used a mixture of FRETing and non-FRETing fluorescein in this example, this approach can be used to resolve mixtures of fluorophores, even spectrally similar fluorophores, as long as their lifetimes are sufficiently separable. Figure 5Calibration curve for mixed populations of FRET and non-FRET pairs. An 8-amino acid peptide was synthesized and labeled with fluorophores. The peptide sequence was GKVQIVYK, which is homologous to a region of the human tau protein.35 Fluorescein was conjugated to the N-terminal residue, and rhodamine was attached to the C-terminal amino acid. The doubly-labeled peptide is a positive control for FRET, since the two fluorophores are separated by only 8 amino acids, which is well within the range for FRET. Singly-labeled peptides were also made with either fluorescein or rhodamine on the appropriate peptide terminal. FLIM was used to characterize the three peptides in solution at 0.1 mg/ml in ethyl alcohol (ETOH)/ H 2 O at 70:30 using a green bandpass filter (515/df30) to select for the fluorescein (donor) fluorescence. No signal was obtained from the rhodamine-alone-labeled peptide when exciting at 800 nm for multiphoton fluorescence. The fluorescein-alone sample resulted in a homogeneous monoexponential curve fit with a mean lifetime of 3.2±0.1 ns. The doubly-labeled peptide had two lifetime components, at 3.2±0.1 and at 1.4±0.2 ns. The amplitude of each of these lifetimes was approximately 50, indicating that only half of the doubly-labeled peptide was exhibiting FRET, suggesting that the peptide was a 50:50 mixture of peptide that was doubly-labeled and peptide labeled with fluorescein alone. Mixtures of singly-labeled and doubly-labeled peptides were made at varying ratios, corrected for the measured concentration of doubly-labeled peptide. These samples were placed into glass capillary tubes and imaged using FLIM. Double exponential curve fits were performed on the samples, fixing the fluorescence lifetimes at 1.4 and 3.2 ns, and calculating the amplitude corresponding to these lifetimes, which represent the fraction of each of these lifetimes within each sample. The calibration curve plots the calculated amplitude of the fast lifetime component as a function of the fraction of doubly-labeled peptide in the sample mixtures. The results demonstrate that the curve-fitting routine reliably estimates the fraction of FRETing to non-FRETing molecules within a sample, on a pixel-by-pixel basis. This is a significant advantage of using time-domain FLIM for FRET measurements compared with other FRET determinations, which cannot discriminate between weakly associating fluorophore pairs or a mixed population of strongly associating and nonassociating pairs. 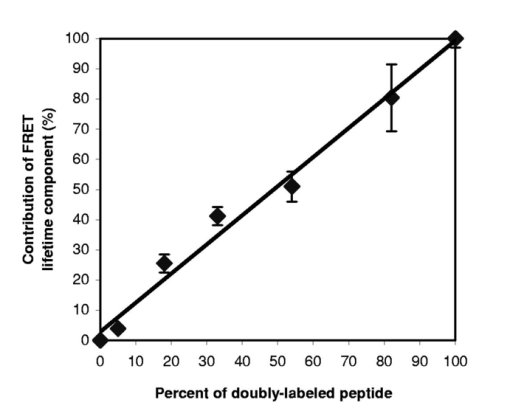 After establishing some baseline parameters for FRET determinations, we evaluated our FLIM system in histological sections. We applied directly labeled antibodies to tissue from mouse brain. The brains were from 20-month-old Tg2576 mice, which overexpress mutant human amyloid precursor protein (APP), leading to the progressive development of senile plaques similar to those found in Alzheimer’s disease tissue.26 Senile plaques occur with various morphologies, including compact or dense-core plaques, as well as diffuse aggregates, all resulting from deposition of the amyloid-β peptide in the brain.27 28 It is known that the amyloid-β peptides deposit in β-pleated sheet conformation in dense-core plaques, allowing easy detection with histological stains that recognize β-sheet structures, and not necessarily amyloid-β specifically.29 Antibodies, however, recognize distinct epitopes of the amyloid-β peptide, and can be used to target both dense-core and diffuse deposits. We used a fluorescein-labeled antibody (10d5, Elan Pharmaceuticals30) that recognizes amino acids 3 to 6 of amyloid-β and labels all morphological types of senile plaques. The FLIM acquisition of antibody-labeled plaques revealed homogeneous lifetimes within and between plaques (Fig. 6) (see Color Plate 2). Double immunofluorescent labeling, however, of the same plaques with another anti-amyloid-β antibody (3d6, recognizing amino acids 1 to 5, Elan Pharmaceuticals30) labeled with rhodamine revealed a different pattern of fluorescence lifetimes. First, there was detectable FRET between the antibodies throughout the plaques. The fluorescence lifetimes of fluorescein decreased from 2.6±0.1 ns in the fluorescein-alone tissue, to 1.9±0.1 ns in the doubly-labeled tissue. We have previously shown that these two antibodies co-localize with each other on amyloid-β deposits, despite the nearly overlapping epitopes near the N-terminals of amyloid-β.13 Our FLIM results demonstrate that the antibodies are indeed extremely close to each other, within 10 nm. This distance is closer than can be determined by co-localization studies. Surprisingly, we also observed spatially distinct profiles of FRET within individual plaques. In dense-core plaques, there was a higher degree of FRET in the periphery of the plaque than in the core. This is demonstrated most effectively in the pseuodocolored image of Fig. 6(b). This result indicates that the amyloid-β peptide has a different three-dimensional conformation in the core of a plaque compared with the periphery or diffuse plaques. It is important to note that this is not due to packing density (since FLIM is concentration independent31 32), but implies a difference in the relative conformation of the two epitopes to one another. We expect intermolecular FRET to be less close (hence have longer lifetimes) than intramolecular FRET, and this therefore suggests that the core of a plaque may favor a β-pleated sheet-packing orientation that favors intermolecular interactions between the N-terminals of amyloid-β peptides. This result will be pursued further with a range of antibodies with discrete epitopes along the sequence of amyloid-β. Figure 6Senile plaques like those found in Alzheimer’s disease are morphologically nonuniform. Cryostat sections from 18-month-old Tg2576 mouse brains were processed for immunohistochemistry as previously described. Directly labeled antibodies against the amyloid-β peptide were used. FITC-labeled 10d5 was used alone in some tissue sections, and both FITC-10d5 and rhodamine-labeled 3d6 antibody were used together in other sections. These antibodies both recognize epitopes at or near the N-terminal of amyloid-β, but do not compete with each other for binding. FLIM acquisition was performed using a 515df30 interference filter, and a 20×water immersion objective (Olympus, NA=0.45) . Excitation was at 800 nm, and fluorescence was acquired for 3 min per sample. Three tissue sections from three different mice were used for each sample, acquiring images of approximately eighteen plaques for each case. As shown in (a), the fluorescence lifetime of FITC-10d5 immunolabeling is uniform across the plaques, with a mean lifetime of 2.6±0.1 ns. (b) A representative example of a plaque that is doubly labeled with FITC-10d5 and rhodamine-3d6. In this example, FRET is observed throughout the plaque, as evidenced by the reduction in the fluorescence lifetime of fluorescein to 0.9±0.1 ns. It is interestingly that the lifetimes are no longer uniform across the plaque, but show spatially distinct differences from the core of the plaque to the periphery. The blue color in the core represents longer lifetimes and less FRET than the fringes. Scale bar=20 μm. Color Plate 2 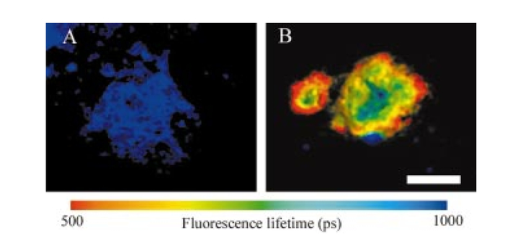 3.DiscussionWe describe the development of a time-domain FLIM system using commercially available components. By coupling a high-speed TCSPC acquisition board with a laser scanning multiphoton microscope, we were able to obtain high spatial resolution images with high temporal resolution lifetimes on a pixel-by-pixel basis. Using this system, we characterized the fluorescence lifetime of fluorescein conjugated to monoclonal antibodies and streptavidin reagents, which are commonly used for immunohistochemistry. We also demonstrated FRET between cells transfected with green fluorescent protein color variants, further establishing their usefulness for addressing both static and dynamic determinations of protein interactions.3 17 33 34 High-resolution FLIM permits detection of FRET in doubly-labeled cells and tissue, permitting co-localization of protein pairs with resolutions less than 10 nm. As opposed to frequency-domain FLIM, this system permits determinations of both degree of FRET as well as the proportion of molecules within a volume exhibiting FRET. We also describe the implementation of this system for FRET determinations in biological tissue from a transgenic mouse model of Alzheimer’s disease. This mouse develops senile plaques similar to those found in the human disease, and characterization of these neuropathological lesions in vitro or in vivo will aid in our understanding of the disease. Our results indicate that individual senile plaques exhibit two morphological conformations of amyloid-β peptide that are detectable with FLIM. This may provide a clue as to the initial formation of senile plaques or to the maturation of a plaque over time. Further experiments with a range of antibodies recognizing specific epitopes within the amyloid-β peptide, and transgenic mice at an age when plaques are just beginning to appear, may help elucidate these issues. In conclusion, FLIM is a powerful spectroscopic technique for analyzing FRET interactions on a spatial scale of less than 10 nm. With the recent availability of commercial electronics for high-speed detection of fluorescence lifetimes, coupled with the recent popularity of laser scanning multiphoton microscopes, this technique should see more widespread use for ultra-high resolution analysis of protein–protein interactions in complex biological tissue. AcknowledgmentsThis work is supported by National Institute of Health grants AG08487 and EB00768, and a Pioneer Award from the Alzheimer Association. REFERENCES
G. W. Gordon
,
G. B. X. H. Liang
,
B. Levine
, and
B. Herman
,
“Quantitative fluorescence resonance energy transfer measurements using fluorescence microscopy,”
Biophys. J. , 74 2702
–2713
(1998). Google Scholar
F. S. Wouters
and
P. I. Bastiaens
,
“Fluorescence lifetime imaging of receptor tyrosine kinase activity in cells,”
Curr. Biol. , 9
(19), 1127
–1130
(1999). Google Scholar
P. J. McLean
,
H. Kawamata
,
S. Ribich
, and
B. T. Hyman
,
“Membrane association and protein conformation of alpha-synuclein in intact neurons. Effect of Parkinson’s disease-linked mutations,”
J. Biol. Chem. , 275
(12), 8812
–8816
(2000). Google Scholar
N. J. Emptage
,
“Fluorescent imaging in living systems,”
Curr. Opin. Pharmacol. , 1
(5), 521
–525
(2001). Google Scholar
Q. S. Hanley
,
V. Subramaniam
,
D. J. Arndt-Jovin
, and
T. M. Jovin
,
“Fluorescence lifetime imaging: multi-point calibration, minimum resolvable differences, and artifact suppression,”
Cytometry , 43
(4), 248
–260
(2001). Google Scholar
P. I. Bastiaens
and
A. Squire
,
“Fluorescence lifetime imaging microscopy: spatial resolution of biochemical processes in the cell,”
Trends Cell Biol. , 9
(2), 48
–52
(1999). Google Scholar
P. J. Verveer
,
A. Squire
, and
P. I. Bastiaens
,
“Improved spatial discrimination of protein reaction states in cells by global analysis and deconvolution of fluorescence lifetime imaging microscopy data,”
J. Microsc. , 202 451
–456
(2001). Google Scholar
B. T. Hyman
and
J. Q. Trojanowski
,
“Consensus recommendations for the postmortem diagnosis of Alzheimer disease from the National Institute on Aging and the Reagan Institute Working Group on diagnostic criteria for the neuropathological assessment of Alzheimer disease,”
J. Neuropathol. Exp. Neurol. , 56
(10), 1095
–1097
(1997). Google Scholar
W. R. Markesbery
,
“Neuropathological criteria for the diagnosis of Alzheimer’s disease,”
Neurobiol. Aging , 18 S13
–19
(1997). Google Scholar
B. J. Bacskai
,
S. T. Kajdasz
,
R. H. Christie
,
C. Carter
,
D. Games
,
P. Seubert
,
D. Schenk
, and
B. T. Hyman
,
“Imaging of amyloid-beta deposits in brains of living mice permits direct observation of clearance of plaques with immunotherapy,”
Nat. Med. , 7
(3), 369
–372
(2001). Google Scholar
R. H. Christie
,
B. J. Bacskai
,
W. R. Zipfel
,
R. M. Williams
,
S. T. Kajdasz
,
W. W. Webb
, and
B. T. Hyman
,
“Growth arrest of individual senile plaques in a model of Alzheimer’s disease observed by in vivo multiphoton microscopy,”
J. Neurosci. , 21
(3), 858
–864
(2001). Google Scholar
B. J. Bacskai
,
S. T. Kajdasz
,
M. E. McLellan
,
D. Games
,
P. Seubert
,
D. Schenk
, and
B. T. Hyman
,
“Non-Fc-mediated mechanisms are involved in clearance of amyloid-beta in vivo by immunotherapy,”
J. Neurosci. , 22
(18), 7873
–7878
(2002). Google Scholar
B. J. Bacskai
,
W. E. Klunk
,
C. A. Mathis
, and
B. T. Hyman
,
“Imaging amyloid-beta deposits in vivo,”
J. Cereb. Blood Flow Metab. , 22
(9), 1035
–1041
(2002). Google Scholar
F. K. Chan
,
R. M. Siegel
,
D. Zacharias
,
R. Swofford
,
K. L. Holmes
,
R. Y. Tsien
, and
M. J. Lenardo
,
“Fluorescence resonance energy transfer analysis of cell surface receptor interactions and signaling using spectral variants of the green fluorescent protein,”
Cytometry , 44
(4), 361
–368
(2001). Google Scholar
A. G. Harpur
,
F. S. Wouters
, and
P. I. Bastiaens
,
“Imaging FRET between spectrally similar GFP molecules in single cells,”
Nat. Biotechnol. , 19
(2), 167
–169
(2001). Google Scholar
R. Pepperkok
,
A. Squire
,
S. Geley
, and
P. I. Bastiaens
,
“Simultaneous detection of multiple green fluorescent proteins in live cells by fluorescence lifetime imaging microscopy,”
Curr. Biol. , 9
(5), 269
–272
(1999). Google Scholar
A. Y. Ting
,
K. H. Kain
,
R. L. Klemke
, and
R. Y. Tsien
,
“Genetically encoded fluorescent reporters of protein tyrosine kinase activities in living cells,”
Proc. Natl. Acad. Sci. U.S.A. , 98
(26), 15003
–15008
(2001). Google Scholar
A. Miyawaki
,
J. Llopis
,
R. Heim
,
J. M. McCaffery
,
J. A. Adams
,
M. Ikura
, and
R. Y. Tsien
,
“Fluorescent indicators for
Ca2+
based on green fluorescent proteins and calmodulin,”
Nature (London) , 388
(6645), 882
–887
(1997). Google Scholar
R. B. Knowles
,
J. Chin
,
C. T. Ruff
, and
B. T. Hyman
,
“Demonstration by fluorescence resonance energy transfer of a close association between activated MAP kinase and neurofibrillary tangles: implications for MAP kinase activation in Alzheimer disease,”
J. Neuropathol. Exp. Neurol. , 58
(10), 1090
–1098
(1999). Google Scholar
A. Kinoshita
,
C. M. Whelan
,
C. J. Smith
,
I. Mikhailenko
,
G. W. Rebeck
,
D. K. Strickland
, and
B. T. Hyman
,
“Demonstration by fluorescence resonance energy transfer of two sites of interaction between the low-density lipoprotein receptor-related protein and the amyloid precursor protein: role of the intracellular adapter protein Fe65,”
J. Neurosci. , 21
(21), 8354
–8361
(2001). Google Scholar
N. Sharma
,
P. J. McLean
,
H. Kawamata
,
M. C. Irizarry
, and
B. T. Hyman
,
“Alpha-synuclein has an altered conformation and shows a tight intermolecular interaction with ubiquitin in Lewy bodies,”
Acta Neuropathol. (Berlin) , 102
(4), 329
–334
(2001). Google Scholar
N. Sharma
,
J. Hewett
,
L. J. Ozelius
,
V. Ramesh
,
P. J. McLean
,
X. O. Breakefield
, and
B. T. Hyman
,
“A close association of torsinA and alpha-synuclein in Lewy bodies: a fluorescence resonance energy transfer study,”
Am. J. Pathol. , 159
(1), 339
–344
(2001). Google Scholar
N. Klonis
and
W. H. Sawyer
,
“Spectral properties of the prototropic forms of fluorescein in aqueous solution,”
J. Fluoresc. , 6
(3), 147
–157
(1996). Google Scholar
K. Hsiao
,
P. Chapman
,
S. Nilsen
,
C. Eckman
,
Y. Harigaya
,
S. Younkin
,
F. Yang
, and
G. Cole
,
“Correlative memory deficits, Abeta elevation, and amyloid plaques in transgenic mice,”
Science , 274
(5284), 99
–102
(1996). Google Scholar
S. H. Yen
,
W. K. Liu
,
F. L. Hall
,
S. D. Yan
,
D. Stern
, and
D. W. Dickson
,
“Alzheimer neurofibrillary lesions: molecular nature and potential roles of different components,”
Neurobiol. Aging , 16
(3), 381
–387
(1995). Google Scholar
D. W. Dickson
,
“Neuropathological diagnosis of Alzheimer’s disease: a perspective from longitudinal clinicopathological studies,”
Neurobiol. Aging , 18 S21
–26
(1998). Google Scholar
G. Kelenyi
,
“Thioflavin S fluorescent and Congo red anisotropic stainings in the histologic demonstration of amyloid,”
Acta Neuropathol. (Berlin) , 7
(4), 336
–348
(1967). Google Scholar
B. T. Hyman
,
R. E. Tanzi
,
K. Marzloff
,
R. Barbour
, and
D. Schenk
,
“Kunitz protease inhibitor-containing amyloid beta protein precursor immunoreactivity in Alzheimer’s disease,”
J. Neuropathol. Exp. Neurol. , 51
(1), 76
–83
(1992). Google Scholar
M. Elangovan
,
R. N. Day
, and
A. Periasamy
,
“Nanosecond fluorescence resonance energy transfer-fluorescence lifetime imaging microscopy to localize the protein interactions in a single living cell,”
J. Microsc. , 205 3
–14
(2002). Google Scholar
J. R. Lakowicz
,
H. Szmacinski
,
K. Nowaczyk
,
K. W. Berndt
, and
M. Johnson
,
“Fluorescence lifetime imaging,”
Anal. Biochem. , 202
(2), 316
–330
(1992). Google Scholar
F. J. van Kuppeveld
,
W. J. Melchers
,
P. H. Willems
, and
T. W. Gadella Jr.
,
“Homomultimerization of the coxsackievirus 2B protein in living cells visualized by fluorescence resonance energy transfer microscopy,”
J. Virol. , 76
(18), 9446
–9456
(2002). Google Scholar
T. Ng
,
A. Squire
,
G. Hansra
,
F. Bornancin
,
C. Prevostel
,
A. Hanby
,
W. Harris
,
D. Barnes
,
S. Schmidt
,
H. Mellor
,
P. I. Bastiaens
, and
P. J. Parker
,
“Imaging protein kinase C alpha activation in cells,”
Science , 283
(5410), 2085
–2089
(1999). Google Scholar
M. von Bergen
,
P. Friedhoff
,
J. Biernat
,
J. Heberle
,
E. M. Mandelkow
, and
E. Mandelkow
,
“Assembly of tau protein into Alzheimer paired helical filaments depends on a local sequence motif [(306)VQIVYK(311)] forming beta structure,”
Proc. Natl. Acad. Sci. U.S.A. , 97
(10), 5129
–5134
(2000). Google Scholar
|
CITATIONS
Cited by 146 scholarly publications and 1 patent.
Fluorescence resonance energy transfer
Luminescence
Fluorescence lifetime imaging
Tissues
Proteins
Multiphoton fluorescence microscopy
Microscopes

