1.IntroductionConversion of precursors by photolytic chemistry (“flash photolysis”) is a relatively new tool for biomedical research. By synthesis of suitable precursors (“caged compounds”) it is possible to optically probe cell and tissue function with high spatiotemporal resolution.1 2 Using conventional UV illumination, the photoactivation of caged precursors can be accurately targeted within the plane of focus of the optical system, but significant uncaging also occurs in the cone of illumination above and below the focal plane. With the introduction of two-photon excitation3 it has now become possible to confine the flash photolysis to a diffraction-limited volume in all three dimensions (≪1 fl).4 5 The unique ability of two-photon flash photolysis (TPFP) to produce a three-dimensionally resolved chemical source has allowed entirely new types of biological experiments. For example, the highly localized release of neurotransmitters by TPFP has been used to map the distribution of membrane receptors on neurons and other cells at high resolution.5 6 7 In cardiac muscle, TPFP of caged Ca 2+ has recently been utilized to probe the subcellular Ca 2+ dynamics in intact cells.8 9 10 Conventional photoactivation of caged fluorochromes (using one-photon photolysis) has been used to measure diffusion coefficients and protein turnover in intact cells.11 12 13 TPFP of caged fluochromes should provide the improved spatial resolution of two-photon excitation. In general, intercellular dye transport has been studied by introducing dye via patch pipettes (e.g., Refs. 14 15 16) or loaded from the bathing medium (e.g., Refs. 17 and 18). However, TPFP of caged dyes could provide a source whose dimensions are closer to a point, which would simplify the analysis and even open the possibility of studying transport in microscopic regions of the cell. In this paper we use the high resolution provided by TPFP of caged fluorochromes to measure diffusion coefficients in solution and optically probe transport properties between fiber cells of the mammalian lens. In a novel application of TPFP of caged Ca 2+ we demonstrate how this method can help reveal the temporal properties of microscopic Ca 2+ release events (“ Ca 2+ sparks”) in cardiac muscle cells and can be used to probe spatial transport properties in different subcellular compartments of mouse oocytes. These experiments demonstrate that TPFP makes it possible to study a variety of cellular processes at high spatial and temporal resolution. 2.Materials and Methods2.1.Stationary Spot Two-Photon Flash PhotolysisIllumination for two-photon excitation was provided by a mode-locked titanium:sapphire (Ti:S) laser tuned to a wavelength of ∼700 and ∼750 nm for photolysis of caged Ca 2+ and fluorescein, respectively. After passing it through a Pockels cell (Conoptics, Danbury, Connecticut), the beam was coupled into a modified confocal microscope (Zeiss LSM 410, Jena, Germany)19 to form a stationary spot parfocal with the confocal image plane but bypassing the scanner system. The photolysis volume (0.5 μm in plane and 1.4 μm axially8) was determined by TPFP of caged fluorescein-dextran immobilized in a polyacrylamide gel. Fluorescence changes in response to stationary spot photolysis were monitored using the 488-nm line of an argon ion laser (Uniphase, San Jose, California) and the conventional confocal mode of the microscope. The pinhole was set to a diameter of ∼1.5 Airy units, resulting in a point spread function (PSF) with a full width at half maximum (FWHM) diameter of 400 nm in the plane and 900 nm in the axial direction. Accurate axial alignment between the photolysis spot (near-infrared light from the Ti:S laser) and the recording plane (488-nm light from the Ar + laser) was ensured by adjustment of a lens in the Ti:S beam path to correct longitudinal chromatic aberration.8 Flash intensities were kept low (⩽1 mW at the sample) to prevent photobleaching of fluo-3 (or released fluorescein) and cage depletion at the site of photolysis (confirmed by the square dependence of released Ca 2+ /fluorescein on flash intensity). 1. Uncaging of fluorescein in model solutions. Solutions for flash photolysis were prepared in a simple buffer containing 140 mM KCl and 20 mM N-2-hydroxyethyl piperazine-N′-2 ethane sulfonic acid (HEPES), pH 7.4. In this solution CMNB-caged fluorescein (Molecular Probes, Eugene, Oregon) was dissolved to a final concentration of 1 mM. The photolysis spot was focused ∼50 μm above the coverslip to avoid edge effects. 2. Uncaging of fluorescein in rat lenses. Lenses were dissected from adult rats into phosphate-buffered saline (PBS) at 37°C, transferred to an intracellular medium containing (in mM) MgCl 2 1, ethyleneglycol-bis-(β-aminoethylether)- N,N,N′,N′ tetraacetic acid (EGTA) 0.5, NaCl 10, Na 2 adenosine triphosphate (ATP) 2, KCl 20, K-gluconate 120, HEPES 10, pH 7.3, 300 mOsm/kg and cut through the equator using a fresh scalpel blade. Lens hemispheres were inspected for structural integrity using a dissecting microscope and transferred to a perfusion chamber sealed at the bottom with a coverslip so that the cut face of the lens rested on the coverslip. The chamber contained a solution of 1 mM CMNB-caged fluorescein (Molecular Probes) in an intracellular medium. The chamber was mounted on the two-photon/confocal microscope and caged fluorescein was released by stationary spot TPFP and monitored as described above. For x-y scanning the pixel dwell time was ∼25 μs and an average of two frames were recorded; during line scans the pixel dwell time was ∼15 μs and an average of four scan lines were recorded. Following recording of the fluorescence time course, the argon ion laser was used to image the local fiber cell structure in brightfield mode. 3. Fluorescent labeling of lens sections. Equatorial sections of adult rat lenses 10 μm thick were obtained as described previously.20 The sections were treated on slides for 1 h with blocking solution (3 w/v bovine serum albumin, BSA, 3 v/v fetal calf serum in PBS), washed three times for 5 min in PBS and treated for 2 h with either undiluted anti-MP70 (connexin ×50) mouse monoclonal antiserum or with rabbit anti-connexin×46 antibody (Alpha Diagnostic International, San Antonio, Texas) diluted 1:200 in blocking solution. The slides were washed three times for 5 min in PBS and treated for 1.5 h in the dark with antimouse (or antirabbit) Alexa Fluor 488 antibody, diluted 1:200 in blocking solution. After being washed three times for 5 min in PBS, the slides were labeled for 1.5 h in the dark with Alexa Fluor 350-conjugated wheat germ agglutinin (WGA, Molecular Probes; 40 μg/ml in PBS) to label fiber cell membranes.21 Finally, after washing them three times for 5 min in PBS, the slides were mounted in 10 μ1 Citifluor AF1 and stored at 4°C. 4. Generation of artificial model sparks. Artificial Ca 2+ release events resembling Ca 2+ sparks22 but with a known underlying release wave form were generated using TPFP of the Ca 2+ cage DM-Nitrophen.23 Solutions for flash photolysis were prepared in a simple buffer (140 mM KCl and 20 mM HEPES, pH 7.4). To this solution 0.8 mM DM-Nitrophen (Calbiochem, Alexandria, Australia) and 100 μM Fluo-3 (Molecular Probes) were added. The free Ca 2+ concentration was adjusted to 100 nM by adding CaCl 2. Between 30 and 480 responses were averaged to improve the signal-to-noise ratio of line scan images of “artificial sparks.” Owing to the two-photon nature of the excitation process, the photolysis rate is expected to be proportional to the square of the flash intensity. To confirm the squared flash time course (for comparison with the reconstructed release time course), we also measured two-photon excited fluorescence in a dilute solution (100 μM) of fluorescein in response to flashes that were used to generate model sparks. 5. Imaging of rat cardiac myocytes. Enzymatically isolated rat cardiac myocytes were prepared from 250-g Wistar rats as described elsewhere.24 For line scan imaging, isolated ventricular myocytes were incubated with 5 μM of the AM form of fluo-4 (Molecular Probes) for 25 min at room temperature (20 to 22°C). The cells were then placed in a solution containing 2 mM CaCl 2 and 10 to 20 μM of nifedipine (to allow identification of well-separated spark sites). The labeled cells were placed in the chamber of a confocal microscope (Zeiss LSM 410, Jena, Germany) with a glass coverslip as its bottom. Trains of action potentials were evoked by field stimulation at a frequency of 0.33 Hz to repeatedly activate spark sites. Indicator fluorescence was excited using the 488-nm line of an argon ion laser and detected between 510 and 550 nm (HQ filter, Chroma Technology, Brattleboro, Vermont). Fifty confocal lines were acquired during each field stimulation. The field stimulus was triggered after the first ten lines and the resulting Ca 2+ transients were recorded during the remaining forty line scans. Line scanning was performed at the maximum scan speed of 1.4 ms/line. The total exposure time was therefore 70 ms/stimulus and trains of up to 100 stimuli could be recorded without detectable cell damage. 6. Mathematical modeling of photorelease and diffusion. For comparison with experimental data, the photorelease and diffusion of caged fluorescein and caged Ca 2+ were simulated using the measured PSFs of photorelease and confocal recording. The model equations were implemented using FACSIMILE (see also Refs. 24 and 25). For the modeling of artificial sparks, a diffusion coefficient of DM-Nitrophen (D DM ) in water was estimated as 4×10⁻⁶ cm 2/s based on the molecular weight of DM-Nitrophen.24 On and off rates for DM-Nitrophen Ca 2+ binding were 3×10⁷ M −1 s −1 and 0.144 s−1, respectively.26 The on and off rates for Ca 2+ binding to fluo-3 were 2×10⁸ M −1 s −1 and 150 s−1, respectively, resulting in a Kd of 0.75 μM (similar to values used previously).26 For the full parameter set used to model sparks in intact heart cells, see Ref. 24. 7. Oocyte collection and microinjection. F 1 hybrid mice of B6CB (C57Bl/6JLac×CBA/CaLac) 21 to 28 days old were primed with an intraperitoneal injection of 7.5 IU pregnant mares’ serum gonadotrophin (PMSG, Intervet, UK). At 44 to 52 h, their ovaries were punctured with a sterile needle and cumulus-enclosed oocytes were collected. The oocytes were mechanically stripped of their cumulus cells using a mouth pipette. The oocytes were microinjected as described previously27 with a solution containing fluo-3 pentapotassium salt (Molecular Probes) and the photolabile Ca 2+ chelator dimethoxynitrophenyl-EGTA-4 (DMNPE-4)28 to final concentrations of 50 μM and 1 mM in the oocyte cytosol, respectively. Fluo-3 and DMNPE-4 were dissolved in 120 mM KCl, 20 mM HEPES, pH 7.5 for injection. To allow time for diffusion of dye within the oocytes, a period of at least 20 min from the time of microinjection was allowed and the oocytes were stored in M2 medium at 37°C for not more than 4 h. The injected oocytes had their zonae removed by a brief (10-s) incubation in acid Tyrode’s solution. The oocytes were then immediately transferred to a heated chamber (Intracel) at 37°C containing 500 μl of M2 without bovine serum albumin. The oocytes were allowed to attach to the glass base in BSA-free M2 before the addition of 500 μl of M2 containing a fraction (14 mg/ml) V BSA. 8. Data processing. Image processing and analysis were performed using custom routines written in the IDL programming language (Research Systems, Boulder, Colorado). 3.Results3.1.TPFP of Caged FluoresceinAt the cellular level, solutes are moved by diffusion, and most classical approaches for measuring diffusion (such as radioisotope tracers) have insufficient spatial or temporal resolution to measure diffusion coefficients with submicron resolution. Newer optical methods, such as fluorescence recovery after photobleaching (FRAP)29 and wide-field flash photolysis2 have increased spatial resolution but suffer from problems arising from the wide-field nature of the probe beam. Thus out-of-focus effects can contaminate the in-plane recordings of fluorescence change. Two-photon excitation provides a three-dimensionally resolved source of excitation which, in conjunction with a suitable photoactivatable compound, can provide a microscopic “point source” with which to probe local diffusive properties. To explore this idea further, we carried out tests using TPFP of caged fluorescein. A line scan image of the fluorescence changes in response to a 20-ms flash that was focused in a model solution containing 1 mM CMNB-caged fluorescein is shown in Fig. 1(a). The fluorescence rose rapidly after the onset of the flash and spread to a full width at half maximum of ∼3 μm at the end of the flash. After the flash ended, the fluorescence rapidly declined to the background value, and ∼15 ms after the end of the flash the fluorescence profile was well described by a Gaussian distribution [Fig. 1(b)]. Therefore, from this point in time forward, the solution of the diffusion equation for a point source in three dimensions should be a good approximation of the recorded transient [with an appropriate choice of parameters; compare also Eq. (3.5) in Ref. 30]: where F0 is the background fluorescence, D is the fluorescein diffusion coefficient, C is a constant that characterizes the amplitude of the distribution, and t0 is a time offset. For a given trial choice of D, C and t0 were adjusted so that the profile shown in Fig. 1(b) was fit by the resulting Gaussian distribution. Essentially t0 depends only on the width of the profile and C is determined by the peak amplitude at the center of the profile shown in Fig. 1(b) (a value of ∼580 resulted in a good fit that was largely independent of the choice of D). Using this procedure, the best fit of the decay time course of fluorescence decay [Fig. 1(c)] was obtained for D=4×10⁻⁶ cm 2/s, a value close to the reported diffusion coefficient of fluorescein in aqueous solution (5.1×10⁻⁶ cm 2/s at 25°C).31 This datum suggests that TPFP of caged fluorescein can be used to obtain a measure of macromolecular diffusion at a microscopic distance.Figure 1Flash photolysis of CMNB-caged fluorescein. (a) Line scan image of the fluorescence increase caused by a two-photon flash lasting 20 ms. The flash time course is indicated beside the line scan image. Scale bars: 5 μm, 20 ms. (b) Profile through the fluorescence distribution F (in arbitrary units, a.u.) 15 ms after termination of the flash. Also shown is a Gaussian profile calculated from the solution of diffusion Eq. (1). (c) Time course of fluorescence at the center of the photolysis volume. The theoretical curves were calculated by evaluating Eq. (1) at x=0 using diffusion coefficients D=4×10⁻⁵ cm 2/s, 4×10⁻⁶ cm 2/s and 4×10⁻⁷ cm 2/s.  3.2.TPFP of Caged Fluorescein in the Mammalian LensMolecular mobility also plays an important role in intercellular communication. Communication between cells can occur via specialized membrane channels of which gap junction (GJ) channels form a superfamily.32 These GJs allow low molecular-weight solutes to pass between cells and also allow electrical coupling. In the mammalian lens, GJ-mediated intercellular communication is important for maintaining the high transparency of this avascular organ.33 The lens is composed of many closely packed fiber cells that are connected by GJ “plaques” formed by connexin proteins. Mammalian fiber cells express two connexin isoforms, connexin46 (Cx46) and connexin50 (Cx50).34 35 To visualize GJ plaques, a longitudinal section of lens tissue was labeled with antibodies against Cx50 and the fluorescently labeled membrane marker wheat germ agglutinin. Large GJ plaques on the broad sides of fiber cells are clearly visible in a longitudinal section through fiber cells [Fig. 2(a)]. Two-photon imaging of the stained section revealed that smaller plaques were also present in the bands of fluorescence between fiber cells. These gray bands represent the membrane on the narrow sides of fiber cells seen in cross-section. The close-packed arrangement of fiber cells and the location of GJ plaques in the cell membrane can be more clearly seen in transverse sections through the equator of the lens [Fig. 2(b)]. In this view of a region close to the lens periphery, fiber cells are discernable in cross-section. Note that the fiber cells are accurately aligned in rows and connected by large GJ plaques (stained with an antibody to Cx46) on the broad sides of fiber cells within these rows. Also visible in this section are smaller bright spots representing GJ plaques on the narrow sides of fiber cells that connect fiber cells in adjacent rows. In a tissue region deeper in the lens, the distribution of GJ plaques (stained with the same Cx46 antibody) was much less regular [Fig. 2(c)]. In this region cells were not as regularly organized into rows and the Cx46 staining was more uniformly distributed around the cell periphery. Figure 2Changes in lens cell structure are associated with changes in cell–cell coupling as assessed by TPM and TPFP. (a) Side-on views of peripheral lens fiber cells obtained by TPM show gap junction “plaques” composed of densely packed connexin protein channels (white) lying within cell membranes. (b) Transverse views of the cells in (a) show their orderly arrangement, hexagonal shape, and the distribution of plaques around the cell perimeters at the lens equator. Small plaques are resolved in the narrow sides of the hexagons [arrows in (a) and (b)]. (c) Deeper in the lens, the connexin channels are distributed more evenly around the cell perimeters, which have rounded and become less orderly. (d) TPFP within a single cell (at the point marked by the asterisk) in the peripheral lens region results in preferential transfer of uncaged dye in a direction corresponding to the rows of cells shown in (b). (e). A similar dye release in a region corresponding to the cells shown in (c) results in a more isotropic pattern of cell–cell coupling. All scale bars: 5 μm. 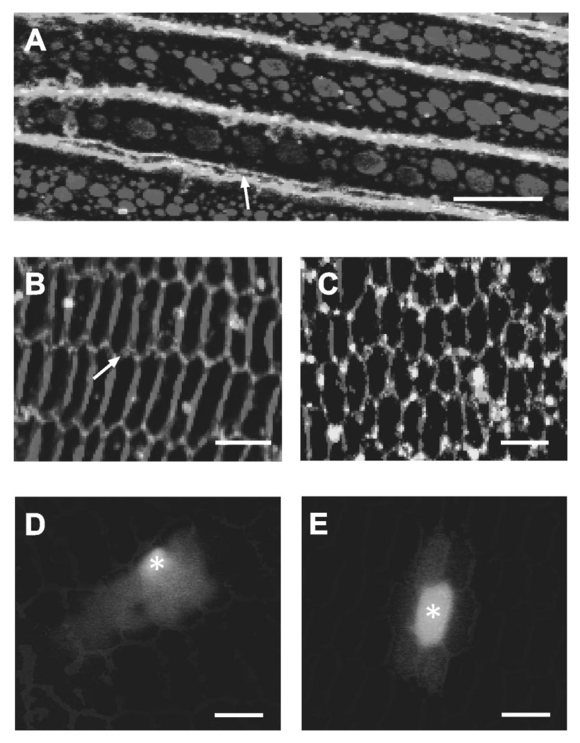 From these structural data, one might expect regional variations in functional cell-to-cell coupling. To test this idea, we developed a method to measure diffusion from an identified cell using TPFP of caged fluorescein which, as shown earlier, should have sufficient spatial resolution to measure diffusion from the very narrow, but elongated, fiber cells. (Note that the “hourglass” wide-field illumination pattern would cause variable degrees of photolysis over a number of fiber cells that curve through the focal plane. Since this illumination pattern is convolved with the complicated 3-D cell geometry, quantitative analysis of such an experiment would be problematic.) To achieve TPFP of a fluorescent tracer whose movement could be monitored by confocal microscopy, we added CMNB-caged fluorescein to the intracellular solution that was used to bathe bisected (equatorial section) rat lenses. After allowing time for diffusion of caged fluorescein into the cut fiber cells, TPFP was used to liberate fluorescein inside a target cell by placing the stationary spot from a Ti:S laser ∼40 μm from the cut surface. When the photolysis spot was placed in a peripheral fiber cell [corresponding to the region shown in Fig. 2(b)], the fluorescein spread rapidly into adjacent cells within the same row. This can be seen in the steady-state image of fluorescence taken ∼10 s after continuous photorelease was initiated [Fig. 2(d)]. Upon closer inspection, a small increase in fluorescence was also detected in cells adjacent to the row containing the chosen target cell. This probably reflects transport through gap junctions in the narrow sides of fiber cells. In contrast, when TPFP was performed in a region deeper within the lens [corresponding to the region shown in Fig. 2(c)], the pattern of fluorescence observed after ∼10 s did not indicate strong directed transport, as observed at the periphery. Rather, the fluorescence distribution was approximately isotropic around the target cell in which the fluorescein was released [Fig. 2(e)]. A smaller increase in fluorescence was also observed in some of the more distant cells. These results suggest that functional intercellular coupling is correlated with the local distribution of GJ plaques. To study the time course of the increase in fluorescence in response to the uncaging of fluorescein at higher temporal resolution, a confocal line was scanned repeatedly across several cells in a region similar to that shown in Fig. 2(e). The resulting line scan image showed that the fluorescence increased rapidly in the cell in which the photolysis spot was located [Fig. 3(a)] and approached a steady level with a half time to peak of ∼200 ms. The fluorescence in the cell immediately above this cell also increased quite rapidly (with a half time of ∼800 ms) and ultimately reached a level of ∼50 of that in cell 1. The fluorescence in the cells adjacent to these two cells approached a saturating level significantly more slowly (with a half time of >2 s) and the fluorescence increased to <10 of the maximal level reached in the target cell [Fig. 3(b)]. It is interesting that the maximal fluorescence level recorded in one of the cells (cell 4) adjacent to the bright target cell was smaller than that recorded in cell 3, which was next to the comparatively dimmer cell 2. These observations suggest that the coupling strength (i.e., permeability) may vary significantly from cell to cell. Figure 3Time course of fluorescent dye diffusion following TPFP, in a target cell and its neighbors deep in the lens. (a) Line scan image showing fluorescence of released fluorescein in the target cell (1) and three neighboring cells (2 to 4) through time (x-axis). Vertical and horizontal scale bars: 2 μm and 1 s, respectively. (b) Plots of fluorescence within the four cells through time [traces are numbered according to the cell numbers in (a)]. Although fluorescence in the outermost cells (3 and 4, inset with longer time scale) increased more slowly, and to lower steady-state levels, this level was lowest for the cell immediately adjacent to the target cell (i.e., cell 4), not the cell two cells away (cell 3), suggesting variable cell-coupling strength in the lens. 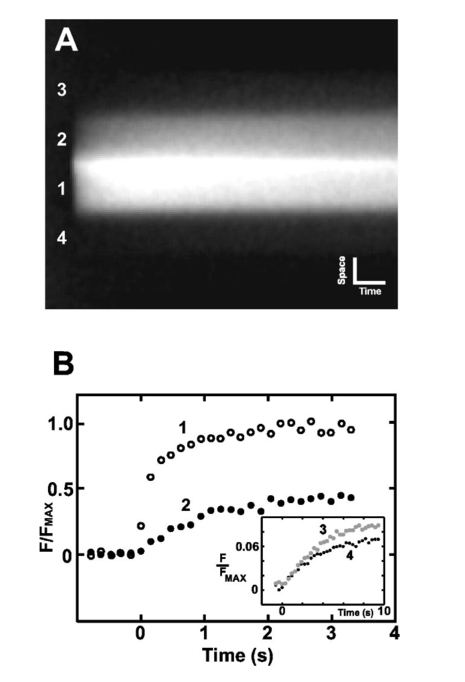 3.3.TPFP of Caged Ca 2+ to Measure Ca 2+ Release FluxesThe previous results demonstrate the ability of TPFP of caged compounds to measure microscopic transport. Such measurements could also provide a method by which to gauge the strength of a subcellular chemical source since the rate of release is determined by the illumination intensity and time course. Within muscle cells, microscopic Ca 2+ signaling events have been observed (called Ca 2+ sparks) that are elementary events underlying muscle activation.22 36 37 However, determination of the Ca 2+ flux underlying Ca 2+ sparks (which is due to Ca 2+ release channel gating) has previously relied on untested mathematical algorithms for flux reconstruction from confocal fluorescence images (see Ref. 24). An alternative approach is to parameter fit a suitable model to experimental data. To test this approach, we used TPFP to provide a controlled chemical source of Ca 2+ with spatiotemporal properties comparable in size to the source underlying Ca 2+ sparks. The model included Ca 2+ release, Ca 2+ and indicator diffusion, and Ca 2+ binding to Ca 2+ buffers (as well as optical blurring). The distribution of a Ca 2+ release flux in the model (q Ca ) was described by a function with six adjustable parameters: where and F is Faraday’s constant, I0 is related to the amplitude of release, σ describes the spatial extent of the source, and t1, τ1, t2, and τ2 characterize the time course of release. By appropriate choice of the temporal parameters, this relationship can be used to describe approximately rectangular shaped or exponentially rising and falling release time courses. In the fitting process the parameters I0, t1, τ1, t2, τ2, and σ were varied to achieve an optimal fit of the model to the recorded fluorescence data. The diffusion coefficients of the indicator dye, Ca 2+ and the Ca 2+ binding characteristics were set to values reported in the literature (see also Ref. 24). If the uncaging flash intensity is sufficiently small (so that local cage depletion is negligible), the square of the flash time course should be directly proportional to the Ca 2+ release flux from the cage. A line scan image of an artificial spark generated by TPFP of the Ca 2+ cage DM-Nitrophen in a small volume of test solution (see Sec. 2) is shown in Fig. 4(a). In this experiment, the flash time course had a rectangular shape and lasted for 10 ms. The fitting procedure resulted in a line scan image that was very similar to the “artificial spark” [Fig. 4(b)] both in time course [Fig. 4(c)] and spatial extent [Fig. 4(d)]. The model Ca 2+ release flux was in good agreement with the flash photolysis time course [Fig. 4(e)], suggesting that our fitting method could provide an adequate description of the underlying Ca 2+ release flux. Similar experiments with exponentially decaying flashes also showed good agreement between the reconstructed release time course and the square of the flash time course. Applying this algorithm to an averaged (n=11 from one site) Ca 2+ spark recorded from an isolated rat ventricular myocyte showed that Ca 2+ release rises rapidly and decays approximately exponentially with a time constant of ∼15 ms [Fig. 4(f)].Figure 4Reconstruction of microscopic Ca 2+ release fluxes. (a) Line scan image of an artificial Ca 2+ spark generated by TPFP of the Ca 2+ cage DM-Nitrophen using a flash that lasted 10 ms. The image shows the increase in fluo-3 fluorescence in response to the uncaging flash. Scale bar: 2 μm. (b) The best-fit simulated line scan image that was calculated using a model of Ca 2+ and fluo-3 movements and binding. (c) In this graph the time courses of normalized fluorescence recorded at various locations of the artificial spark (dashed lines) are compared with the corresponding time courses of the “best fit” model calculation (solid lines). (d) Comparison of fluorescence profiles extracted from experimental data (dashed) and fit (solid). (e) This image shows the distribution of Ca 2+ release flux underlying the simulation that best fit the experimental data. The graph next to the image compares the estimated time course of release (gray) with the flash time course. (f) The fitting approach validated using TPFP [(a) to (e)] was applied to an average Ca 2+ spark recorded in an intact heart cell loaded with the indicator fluo-4. The average spark is shown next to the fitted spark. The time course of Ca 2+ release underlying the fitted spark is shown on the right. Scale bars: 2 μm, 10 ms. 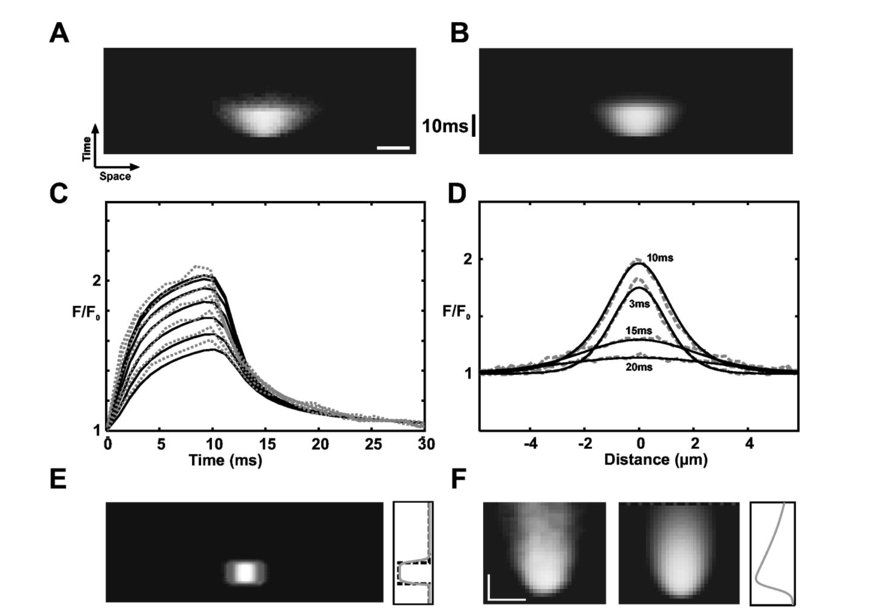 3.4.TPFP of Caged Ca 2+ in Mouse OocytesIt is well known that cells contain microscopic intracellular compartments such as the nucleus, and Ca 2+ signaling within the nucleus has been suggested to be important in the determination of gene expression.38 To examine whether previous measurements of Ca 2+ transport in the cytoplasm are also applicable to nuclear Ca 2+ transport, we used TPFP of caged Ca 2+ to probe nuclear Ca 2+ diffusion. For these experiments we used DMNPE-4 injected into mammalian oocytes. Although similar to DM-Nitrophen,39 DMNPE-4 has a lower affinity for Mg 2+, which makes it more suitable for experiments in the presence of physiological Mg 2+ levels. Flashes with a rectangular time course lasting 60 ms were used to photolytically liberate Ca 2+ in the oocyte cytosol and inside a nucleolus [see Fig. 5(a)]. Comparison of the fluorescence changes in response to these flashes suggests that the fluorescence signal from the Ca 2+ indicator fluo-3 spreads less quickly inside the nucleolus [Fig. 5(b)] than in the cytoplasm. This point can be seen more clearly in Fig. 5(c), which compares the spatial profiles of the fluorescence distribution in the cytoplasm and the nucleolus toward the end of the photolysis flash. The time course of the spatial spread of the fluorescence response in these two compartments is summarized in Fig. 5(d). To test the idea that the faster spread in the cytoplasm could be explained by a larger effective diffusion coefficient in the cytoplasm (compared with the nucleolus), calculations using a simplified model of diffusion were performed. The model considered the movement of a diffusible substance that was released for 60 ms from the measured photolysis volume (see Sec. 2) and its movement was characterized by an effective diffusion coefficient D eff . Note that the model did not attempt to capture the full complexity of the Ca 2+ movements, binding, and indicator diffusion in the oocyte because the details of the Ca 2+ buffering and indicator binding properties are not well characterized in mouse oocytes. The evolution of the FWHM of the calculated fluorescence distribution was determined for a number of effective diffusion coefficients and compared with the experimental data. The spread of fluorescence in the cytosol was well described by the model when an effective diffusion coefficient of 5×10⁻⁶ cm 2/s was used. The observed time course of fluorescence spread in the nucleolus, on the other hand, was well fitted by a curve obtained using D eff =2.5×10⁻⁶ cm 2/s in the model simulation, suggesting that the effective diffusion coefficient in the nucleolus was only half of that in the cytosol. Figure 5TPFP of DMNPE-4 in intact mouse oocytes. (a) Brightfield image of a mouse germinal vesicle stage oocyte that has two very distinct circular nucleoli (arrow). (b) Line scan images of the fluorescence changes in response to a 60-ms uncaging flash recorded in the cytoplasm and a nucleolus. The oocyte was loaded with DMNPE-4 and the Ca 2+ indicator fluo-3. (c) Comparison of the spatial fluorescence profiles at the end of the flash duration. (d) Time course of the increase in FWHM of the fluorescence profiles in cytoplasm and nucleolus. The solid lines were calculated from a model simulation using effective diffusion coefficients D eff =2.5×10⁻⁶ cm 2/s and D eff =5×10⁻⁶ cm 2/s, respectively. 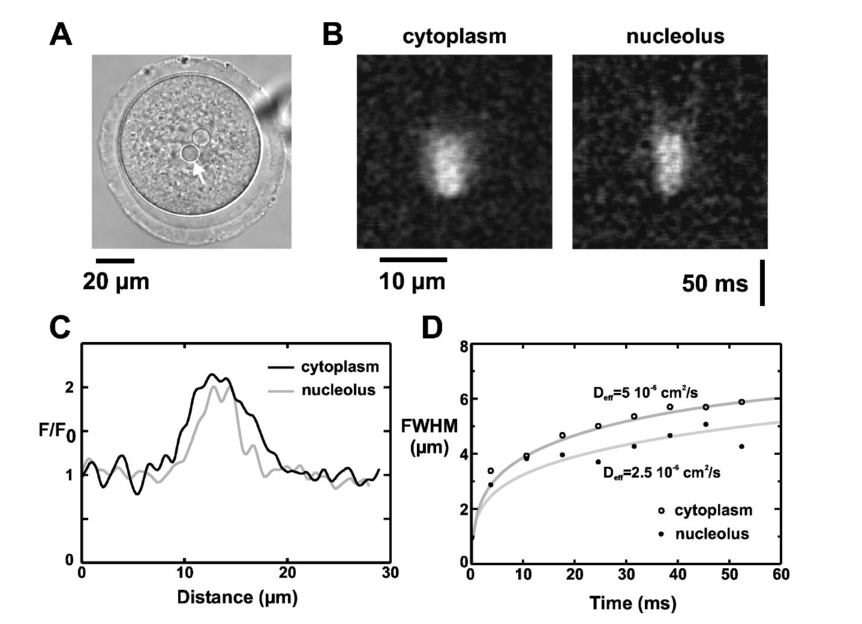 4.DiscussionIn this study we demonstrated the general utility of TPFP, which was used to reveal intercellular communication of lens fiber cells and Ca 2+ movements within cardiac myocytes and mouse oocytes. In all of these experiments the unique three-dimensional spatial localization provided by TPFP was critical. 4.1.Measurement of Macromolecular Diffusion by TPFP of Caged FluoresceinA previous study demonstrated the use of caged fluorochromes to measure diffusion coefficients in solution using conventional UV uncaging.11 Here, we show that corresponding measurements can be conducted using TPFP of caged fluorochromes (albeit with the higher spatial resolution provided by TPFP). The diffusion coefficient for fluorescein obtained using TPFP (4×10⁻⁶ cm 2/s) is in reasonable agreement with a value reported in the literature (5.1×10⁻⁶ cm 2/s at 25°C).3 The measurement in this study was performed in an air-conditioned room at a temperature of 20°C. Assuming a Q10 of diffusion of 1.35, the value from Ref. 31 corresponds to D=4.4×10⁻⁶ cm 2/s at 20 °C and is in good agreement with our result. In applying Eq. (1) to our data, we assumed that the fluorescein distribution was approximately spherical. Although the photolysis volume was not spherical (but rather an ellipsoidal shape, see Sec. 2) the decaying distribution will rapidly approach spherical symmetry, owing to diffusion. This was also confirmed by mathematical modeling (not shown), which indicated that deviations from spherical symmetry were <3 at times >=15 ms after cessation of the photolysis flash. In fact, waiting for the diffusion profile from the photolysis spot to assume spherical symmetry is advantageous because it simplifies subsequent analysis. On the other hand, the source size is increased by this procedure, but the relative increase is not large compared with the size of the source produced by wide-field photolysis. Measurement of diffusion coefficients by TPFP provides an attractive alternative to other multiphoton techniques capable of quantifying diffusion [e.g., multiphoton fluorescence photobleaching recovery (MP-FPR)40 and fluorescence correlation spectroscopy (FCS)].41 Compared with MP-FPR, it has the benefit that a bright signal is detected against a dark background (which should improve the signal-to-noise ratio)2 and data acquisition and analysis should be simpler than in equivalent FCS approaches. A potential limitation of our method is the commercial availability of appropriate caged compounds. Currently these are caged HPTS, caged fluorescein derivatives, and dextran-fluorescein. On the other hand, a succinimidyl ester of caged carboxyfluorescein is available that can be used to link the fluorochrome to amine groups on other macromolecules, extending the feasibility of our approach to a host of other applications. 4.2.TPFP of Caged Fluorescein to Probe Intercellular Coupling in SituThe data presented in this study show that TPFP of caged fluorescein allows intercellular coupling to be measured in situ with high spatial resolution. Measurement of dye transfer is one of the primary tools used to study gap junction function and complements electrical measurements that provide information about ion movement. In isolated and cultured cell systems, the tracer dye is frequently introduced via a patch or intracellular pipette (e.g., Refs. 14 15 16). Alternatively, the dye can be introduced by scrape loading via the bathing medium.17 18 42 While this method can be used in whole tissues, the spatial resolution is comparatively low and generally limits this approach to studying average coupling properties in a whole tissue region.17 In comparison, the ability to produce a spatially confined source by TPFP provides not only local measurements of transport properties but also the ability to carry out multiple independent tests within the same preparation. Thus it would be possible to measure the effect of an intervention on transport without having to physically wash out the tracer probe between interventions. The data presented in Fig. 2 indicate that intercellular coupling changes qualitatively and quantitatively throughout the lens. While the coupling at the periphery was strongly directional, intercellular coupling deeper within the lens was approximately isotropic. The patterns of dye movement observed in a peripheral and a more central region within the lens were correlated with changes in the local distribution of gap junctions that were visualized by two-photon immunofluorescence microscopy. A more detailed analysis of our data indicates that there are also variations in intercellular coupling from cell to cell. This is suggested by the observation that the dye levels reached in cells adjacent to the target cell (which should be a function of local coupling strength) varied from cell to cell even though the membrane area in contact was comparable (cf. Fig. 2 and Fig. 3). Such variations may be due to differences in plaque density between fiber cells or different gap junction channel opening probabilities. Future experiments using the methods presented here should be able to examine these possibilities. Furthermore, it should be possible to extend the analysis of such dye transport data generated by TPFP-released fluorochromes to obtain quantitative estimates of local membrane permeabilities. Similar types of analysis have already been used in conventional dye transport studies, e.g., Refs. 17, 18, and 43. Using the technique described here, the analysis should benefit from the increased spatial resolution provided by TPFP. An alternative approach to probe GJ permeability is to utilize fluorescence recovery after photobleaching (e.g., Ref. 43). After the fluorochrome is selectively bleached in a small region of tissue, the observed rate of fluorescence recovery should be a function of the intercellular coupling to cells that were not exposed to the bleaching illumination (which serve as a reservoir of dye). In principle, it should be possible to use two-photon excitation to selectively bleach the dye within a target cell and achieve local resolution similar to that with the uncaging approach. However, as noted earlier, the reduced contrast associated with FRAP methods decreases the signal-to-noise ratio. For example, in experiments using conventional one-photon illumination, the directed transport of tubulin was detected using caged fluorochromes,44 but could not be resolved in FRAP experiments.45 4.3.TPFP of Caged Ca 2+ to Measure Microscopic Ca 2 Release FluxesTo advance our understanding of the microscopic basis of Ca 2+ sparks (and similar local signals), it is desirable to obtain a direct measure of the Ca 2+ release flux underlying the observed fluorescence signal. Several algorithms have been proposed in the literature to reconstruct the release flux from the fluorescence record.46 47 To overcome the noise limitations associated with such approaches, we have implemented a novel fitting approach in which a numerical model of the Ca 2+ movements is fitted to the experimental data.24 This fitting approach is less noise sensitive than other methods (in which high-order numerical derivatives of noisy experimental data have to be calculated) and also provides measures of parameter sensitivity. A common shortcoming of all approaches (including our own) had been the lack of an experimental test that could verify the ability of these algorithms to provide a reasonable estimate of the Ca 2+ release flux. To test our algorithm, we reconstructed the known time course of Ca 2+ release produced by TPFP of DM-Nitrophen. This method not only produced events that were comparable in magnitude and time course to real Ca 2+ sparks but also incorporated limitations of the recording systems in a way that would not easily be produced by purely synthetic data. By using low illumination intensities, we ensured that saturation effects were avoided so that the rate of uncaging was proportional to the square of the instantaneous illumination intensity. This point can be confirmed by increasing illumination power and examining the power dependence of total yield.4 To our knowledge, this is the first time that reconstruction algorithms have been so accurately tested. Our results show that we can obtain a reasonable description of the time course of Ca 2+ release on a time scale of milliseconds with a spatial resolution of ∼1 μm. From the reconstructed time course we can estimate that the total release current is >7 pA,24 which suggests that at least fifteen ryanodine receptors participicate in generating Ca 2+ sparks. Put another way, during a Ca 2+ spark, ∼200,000 Ca 2+ ions are released. The kinetic features of Ca 2+ release should be reproduced in models for cardiac excitation-contraction coupling and must reflect the intrinsic gating of intracellular Ca 2+ release channels as well as the strength of the Ca 2+ source. Our data and other studies8 9 39 suggest that TPFP of caged Ca 2+ will be one of the key techniques to further clarify the microscopic basis and regulation of local Ca 2+ signaling. 4.4.Probing Transport Properties in Mammalian Oocytes by TPFP of Caged Ca 2+In experiments with mouse oocytes we have used DMNPE-4 to release Ca 2+ at different points within the cell. DMNPE-4 (KD∼19 nM for Ca 2+ at pH 7.4) undergoes a ∼21,000-fold change in Ca 2+ affinity upon photolysis and has a comparatively low affinity for Mg 2+ (KD∼7 mM). 39 We achieved an approximately twofold increase in fluorescence (Fig. 4) during the peak of the transient at illumination powers that were significantly below intensities that caused visible photodamage. Assuming a Ca 2+ binding affinity of fluo-3 of ∼0.75 μM inside the cell24 and a resting [Ca 2+] of 100 nM, it can be calculated (see Ref. 22) that photolysis resulted in an increase of the free Ca 2+ concentration to ∼230 nM within the cell. When the photolysis spot was placed inside a nucleolus, a fluorescence transient of similar amplitude was observed. However, the fluorescence spread less quickly than in the cytoplasm, which is presumably due to a reduced local diffusion coefficient. Although the spread of the fluorescence signal should be dominated by fluo-3 diffusion, the presence of a larger proportion of essentially immobile Ca 2+ buffers could also contribute by lowering the effective Ca 2+ diffusion coefficient.48 Regardless of the origin of the changes in mobility between cytoplasm and nucleolus, it should be noted that the experimental detection of such subcellular heterogeneities between cellular compartments only becomes possible with the high spatial localization provided by TPFP. Such studies have potential applications in characterizing processes that are dependent on subcellular compartmentalization such as biochemical pathway kinetics and intracellular signaling. 5.ConclusionsUsing TPFP we have conducted proof of principle initial experiments in a variety of cell systems that seek to clarify microscopic transport properties. We have shown that 3-D localized uncaging using TPFP provides a unique tool for studying significant biological problems. Using this method, we have shown spatial anisotropy in intercellular transport within the lens and tested a novel method for calculating Ca 2+ release fluxes. We also show that the microscopic transport properties within a small organelle (the nucleolus) can be different from those observed in the cytosol. Further developments of the methodology presented here should provide new insight into cellular processes at an unprecedented microscopic scale. AcknowledgmentsThis work was supported by the University of Auckland Research Committee, the Auckland Medical Research Foundation, the Health Research Council, the Marsden Fund of New Zealand, the Wellcome Trust (UK), and the National Institute of Health (U.S.) (grant GM 53395 to GED). REFERENCES
J. M. Nerbonne
,
“Caged compounds: tools for illuminating neuronal responses and connections,”
Curr. Opin. Neurobiol. , 6 379
–386
(1996). Google Scholar
S. R. Adams
and
R. Y. Tsien
,
“Controlling cell chemistry with caged compounds,”
Annu. Rev. Physiol. , 55 755
–784
(1993). Google Scholar
W. Denk
,
J. H. Strickler
, and
W. W. Webb
,
“Two-photon laser scanning fluorescence microscopy,”
Science (Washington, DC, U.S.) , 248 73
–76
(1990). Google Scholar
E. B. Brown
,
J. B. Shear
,
S. R. Adams
,
R. Y. Tsien
, and
W. W. Webb
,
“Photolysis of caged calcium in femtoliter volumes using two-photon excitation,”
Biophys. J. , 76 489
–499
(1999). Google Scholar
W. Denk
,
“Two-photon scanning photochemical microscopy: mapping ligand-gated ion channel distributions,”
Proc. Natl. Acad. Sci. U.S.A. , 91 6629
–6633
(1994). Google Scholar
M. Matsuzaki
,
G. C. R. Ellis-Davies
,
T. Nemoto
,
Y. Miyashita
,
M. Iino
, and
H. Kasai
,
“Dendritic spine geometry is critical for AMPA receptor expression in hippocampal CA1 pyramidal neurons,”
Nat. Neurosci. , 4 1086
–1092
(2001). Google Scholar
T. Furuta
,
S. S. Wang
,
J. L. Dantzker
,
T. M. Dore
,
W. J. Bybee
,
E. M. Callaway
,
W. Denk
, and
R. Y. Tsien
,
“Brominated 7-hydroxycoumarin-4-ylmethyls: photolabile protecting groups with biologically useful cross-sections for two-photon photolysis,”
Proc. Natl. Acad. Sci. U.S.A. , 96 1193
–2000
(1999). Google Scholar
C. Soeller
and
M. B. Cannell
,
“Two-photon microscopy: imaging in scattering samples and three-dimensionally resolved flash photolysis,”
Microsc. Res. Tech. , 47 182
–195
(1999). Google Scholar
P. Lipp
and
E. Niggli
,
“Fundamental calcium release events revealed by two-photon excitation photolysis of caged calcium in guinea-pig cardiac myocytes,”
J. Physiol. (London) , 508 801
–809
(1998). Google Scholar
F. DelPrincipe
,
M. Egger
, and
E. Niggli
,
“Calcium signalling in cardiac muscle: refractoriness revealed by coherent activation,”
Nat. Cell Biol. , 1 323
–329
(1999). Google Scholar
P. Xia
,
P. M. Bungay
,
C. C. Gibson
,
O. N. Kovbasnjuk
, and
K. R. Spring
,
“Diffusion coefficients in the lateral intercellular spaces of Madin-Darby canine kidney cell epithelium determined with caged compounds,”
Biophys. J. , 74 3302
–3312
(1998). Google Scholar
J. L. McGrath
,
Y. Tardy
,
C. F. Dewey Jr.
,
J. J. Meister
, and
J. H. Hartwig
,
“Simultaneous measurements of actin filament turnover, filament fraction, and monomer diffusion in endothelial cells,”
Biophys. J. , 75 2070
–2078
(1998). Google Scholar
J. C. Politz
,
“Use of caged fluorochromes to track macromolecular movement in living cells,”
Trends Cell Biol. , 9 284
–287
(1999). Google Scholar
V. Valiunas
,
E. C. Beyer
, and
P. R. Brink
,
“Cardiac gap junction channels show quantitative differences in selectivity,”
Circ. Res. , 91 104
–111
(2002). Google Scholar
J. L. Rae
,
C. Bartling
,
J. Rae
, and
R. T. Mathias
,
“Dye transfer between cells of the lens,”
J. Membr. Biol. , 150 89
–103
(1996). Google Scholar
V. Alvarez-Maubecin
,
F. Garcia-Hernandez
,
J. T. Williams
, and
E. J. Van Bockstaele
,
“Functional coupling between neurons and glia,”
J. Neurosci. , 20 4091
–4098
(2000). Google Scholar
R. Eckert
,
B. Adams
,
J. Kistler
, and
P. Donaldson
,
“Quantitative determination of gap junctional permeability in the lens cortex,”
J. Membr. Biol. , 169 91
–102
(1999). Google Scholar
H. Opsahl
and
E. Rivedal
,
“Quantitative determination of gap junction intercellular communication by scrape loading and image analysis,”
Cell Adhes Commun. , 7 367
–375
(2000). Google Scholar
C. Soeller
and
M. B. Cannell
,
“Construction of a two-photon microscope and optimisation of illumination pulse duration,”
Pfluegers Arch. , 432 555
–561
(1996). Google Scholar
M. D. Jacobs
,
C. Soeller
,
M. B. Cannell
, and
P. J. Donaldson
,
“Quantifying changes in gap junction structure as a function of lens fiber cell differentiation,”
Cell Adhes Commun. , 8 349
–353
(2001). Google Scholar
J. Bond
,
C. Green
,
P. Donaldson
, and
J. Kistler
,
“Liquefaction of cortical tissue in diabetic and galactosemic rate lenses defined by confocal laser scanning microscopy,”
Invest. Ophthalmol. , 37 1557
–1565
(1996). Google Scholar
H. Cheng
,
W. J. Lederer
, and
M. B. Cannell
,
“Calcium sparks: elementary events underlying excitation-contraction coupling in heart muscle,”
Science (Washington, DC, U.S.) , 262 740
–744
(1993). Google Scholar
J. H. Kaplan
and
G. C. Ellis-Davies
,
“Photolabile chelators for the rapid photorelease of divalent cations,”
Proc. Natl. Acad. Sci. U.S.A. , 85 6571
–6575
(1988). Google Scholar
C. Soeller
and
M. B. Cannell
,
“Estimation of the sarcoplasmic reticulum
Ca2+
release flux underlying
Ca2+
sparks,”
Biophys. J. , 82 2396
–2414
(2002). Google Scholar
S. Hollingworth
,
C. Soeller
,
S. M. Baylor
, and
M. B. Cannell
,
“Sarcomeric
Ca2+
gradients during activation of frog skeletal muscle fibres imaged with confocal and two-photon microscopy,”
J. Physiol. (London) , 526 551
–560
(2000). Google Scholar
A. L. Escobar
,
P. Velez
,
A. M. Kim
,
F. Cifuentes
,
M. Fill
, and
J. L. Vergara
,
“Kinetic properties of DM-nitrophen and calcium indicators: rapid transient response to flash photolysis,”
Pfluegers Arch. , 434 615
–631
(1997). Google Scholar
K. T. Jones
,
C. Soeller
, and
M. B. Cannell
,
“The passage of
Ca2+
and fluorescent markers between the sperm and egg after fusion in the mouse,”
Development , 125 4627
–4635
(1998). Google Scholar
G. C. R. Ellis-Davies
,
“Synthesis of photolabile EGTA derivatives,”
Tetrahedron Lett. , 39 953
–956
(1998). Google Scholar
E. A. Reits
and
J. J. Neefjes
,
“From fixed to FRAP: measuring protein mobility and activity in living cells,”
Nat. Cell Biol. , 3 E145
–147
(2001). Google Scholar
D. S. Ko
,
M. Sauer
,
S. Nord
,
R. Mu¨ller
, and
J. Wolfrum
,
“Determination of the diffusion coefficient of dye in solution at single molecule level,”
Chin. Phys. Lasers , 269 54
–58
(1997). Google Scholar
R. L. DeHaan
,
“Gap junction communication and cell adhesion in development,”
Zygote , 2 183
–188
(1994). Google Scholar
P. Donaldson
,
J. Kistler
, and
R. Mathias
,
“Molecular solutions to mamalian lens transparency,”
News Physiol. Sci. , 16 118
–123
(2001). Google Scholar
T. W. White
,
R. Bruzzone
,
D. A. Goodenough
, and
D. L. Paul
,
“Mouse Cx50, a functional member of the connexin family of gap junction proteins, is the lens fiber protein MP70,”
Mol. Biol. Cell , 3 711
–720
(1992). Google Scholar
D. L. Paul
,
L. Ebihara
,
L. J. Takemoto
,
K. I. Swenson
, and
D. A. Goodenough
,
“Connexin46, a novel lens gap junction protein, induces voltage-gated currents in nonjunctional plasma membrane of Xenopus oocytes,”
J. Cell Biol. , 115 1077
–1089
(1991). Google Scholar
M. G. Klein
,
H. Cheng
,
L. F. Santana
,
Y. H. Jiang
,
W. J. Lederer
, and
M. F. Schneider
,
“Two mechanisms of quantized calcium release in skeletal muscle,”
Nature (London) , 379 455
–458
(1996). Google Scholar
M. T. Nelson
,
H. Cheng
,
M. Rubart
,
L. F. Santana
,
A. D. Bonev
,
H. J. Knot
, and
W. J. Lederer
,
“Relaxation of arterial smooth muscle by calcium sparks,”
Science (Washington, DC, U.S.) , 270 633
–637
(1995). Google Scholar
B. Mellstrom
and
J. R. Naranjo
,
“Mechanisms of Ca(2+)-dependent transcription,”
Curr. Opin. Neurobiol. , 11 312
–319
(2001). Google Scholar
F. DelPrincipe
,
M. Egger
,
G. C. Ellis-Davies
, and
E. Niggli
,
“Two-photon and UV-laser flash photolysis of the
Ca2+
cage, dimethoxynitrophenyl-EGTA-4,”
Cell Calcium , 25 85
–91
(1999). Google Scholar
E. B. Brown
,
E. S. Wu
,
W. Zipfel
, and
W. W. Webb
,
“Measurement of molecular diffusion in solution by multiphoton fluorescence photobleaching recovery,”
Biophys. J. , 77 2837
–2849
(1999). Google Scholar
P. Schwille
,
U. Haupts
,
S. Maiti
, and
W. W. Webb
,
“Molecular dynamics in living cells observed by fluorescence correlation spectroscopy with one- and two-photon excitation,”
Biophys. J. , 77 2251
–2265
(1999). Google Scholar
M. H. el-Fouly
,
J. E. Trosko
, and
C. C. Chang
,
“Scrape-loading and dye transfer. A rapid and simple technique to study gap junctional intercellular communication,”
Exp. Cell Res. , 168 422
–430
(1987). Google Scholar
L. S. Stein
,
D. W. Stein
,
J. Echols
, and
R. C. Burghardt
,
“Concomitant alterations of desmosomes, adhesiveness, and diffusion through gap junction channels in a rat ovarian transformation model system,”
Exp. Cell Res. , 207 19
–32
(1993). Google Scholar
T. J. Mitchison
,
“Polewards microtubule flux in the mitotic spindle: evidence from photoactivation of fluorescence,”
J. Cell Biol. , 109 637
–652
(1989). Google Scholar
E. D. Salmon
,
R. J. Leslie
,
W. M. Saxton
,
M. L. Karow
, and
J. R. McIntosh
,
“Spindle microtubule dynamics in sea urchin embryos: analysis using a fluorescein-labeled tubulin and measurements of fluorescence redistribution after laser photobleaching,”
J. Cell Biol. , 99 2165
–2174
(1984). Google Scholar
E. Rios
,
M. D. Stern
,
A. Gonzalez
,
G. Pizarro
, and
N. Shirokova
,
“Calcium release flux underlying
Ca2+
sparks of frog skeletal muscle,”
J. Gen. Physiol. , 114 31
–48
(1999). Google Scholar
V. Lukyanenko
,
T. F. Wiesner
, and
S. Gyorke
,
“Termination of
Ca2+
release during
Ca2+
sparks in rat ventricular myocytes,”
J. Physiol. (London) , 507 667
–677
(1998). Google Scholar
J. Wagner
and
J. Keizer
,
“Effects of rapid buffers on
Ca2+
diffusion and
Ca2+
oscillations,”
Biophys. J. , 67 447
–456
(1994). Google Scholar
|


CITATIONS
Cited by 30 scholarly publications and 1 patent.
Calcium
Luminescence
Diffusion
Photolysis
Data modeling
Line scan image sensors
Spatial resolution


