1.IntroductionOptical diagnostic techniques based on detection of reflected light have the potential to improve noninvasive detection of changes associated with dysplasia. These techniques include confocal microscopy, optical coherence tomography (OCT), and other scattering-based spectroscopic approaches. It has been demonstrated that confocal microscopy and OCT can differentiate between normal and dysplastic epithelium in many different organ sites, including the skin,1 2 esophagus,3 intestine,4 and cervix.5 6 Light scattering spectroscopy (LSS) and polarized reflectance spectroscopy are sensitive to cellular and nuclear morphology and are emerging as promising tools for the detection of preinvasive cancer.7 8 9 10 11 Changes in the nuclei of the epithelial cells are the most important indicators of dysplasia. These changes include increased nuclear size, asymmetric nuclear shape, increased DNA content, and hyperchromasia with coarse and irregular chromatin clumping.12 13 To illustrate nuclear changes associated with dysplasia, Figure 1 shows two different cervical biopsy images, one classified as a normal epithelium [Fig. 1(a)] and the other as a highly dysplastic epithelium [Fig. 1(b)]. The figure shows that the density of nuclei is greater in the case of dysplasia, where large pleomorphic nuclei occupy the whole epithelium. The superficial, intermediate, and basal/parabasal layers describing different regions of the epithelium are also indicated in the figure. Note that for both the normal and the dysplastic epithelium, each epithelial depth displays different characteristics, with the superficial nuclei being smaller and more condensed and the basal nuclei larger and rounder. Figure 1(a) Normal and (b) highly dysplastic cervical biopsy images showing the basal/parabasal, intermediate, and superficial epithelial layers. The biopsies are stained with Feulgen-thionin, which is stoichiometric for DNA.  Pathologists have traditionally used atypical nuclear features in the epithelium as one of the major diagnostic criteria for dysplasia. DNA ploidy has also been suggested to be a significant prognostic factor for assessing disease status and predicting treatment outcomes.14 15 16 The optical diagnostic techniques described above have the potential to be used for determining the structure of epithelial cells without the need for a biopsy. They can noninvasively provide quantitative information about nuclear features that can be used for early clinical diagnosis of preinvasive cancerous changes. The extraction of quantitative morphological information from signals obtained in LSS or polarized reflectance spectroscopy has so far been achieved using models based on Mie theory for homogeneous spherical scatterers.7 8 9 10 Although these studies have yielded promising results using theoretical formalism based on Mie scattering, which approximates the cells and their nuclei as homogeneous spherical objects, there is currently no experimental evidence for the validity of using Mie theory to model light scattering from cells. Biological cells are complex inhomogeneous structures that cannot be adequately described as simple Mie scatterers. Their nuclear features and organelles are likely to contribute to scattering from cells. In fact, cellular scattering measurements demonstrate that the scatterer sizes in biological cells range from 0.4 to 2.0 μm.17 These sizes indicate that scattering arises not only from nuclei but also from structures within the nuclei and possibly from cytoplasmic organelles. Therefore, establishing a better understanding of light scattering at the cellular level requires more detailed modeling that can incorporate complicated morphology and the internal structure characteristic of cells. The finite-difference time-domain (FDTD) method has recently provided a flexible approach to studying the scattering that arises from inhomogeneous cells of arbitrary shape.18 19 This method provides a full-vector, three-dimensional solution of Maxwell’s equations, and it allows complex objects of any dielectric structure to be modeled and the scattering phase functions to be computed. FDTD modeling has offered important insights into the relationship between cellular morphology and light scattering. The results show that for amelanotic epithelial cells, which have a low volume fraction of mitochondria, inhomogeneities in the nucleus play an important role in determining high-angle scattering characteristics, while the nuclear size is important in forward scattering.20 The FDTD method has also been used to investigate how the light-scattering properties of cervical cells are affected by the changes in nuclear morphology, DNA content, and chromatin texture that occur during neoplastic progression.21 The results indicate that cellular scattering properties are sensitive to the DNA content of nuclei and chromatin texture in addition to nuclear size. A significant drawback of the FDTD implementation employed in previous work is the presence of artificial reflections caused by the boundary conditions used to truncate the computational domain around the scattering structure. These artificial reflections resulting from the instability of the boundary conditions limit the accuracy of results, mainly for scattering angles close to 180 deg, where the scattered intensity is orders of magnitude smaller than the intensity of forward-scattered light and is thus more sensitive to numerical artifacts. Artificial reflections are evident in the results presented previously,18 19 22 23 and this generally leads to overprediction of high-angle scattering. This drawback is a crucial disadvantage since most of the optical diagnostic techniques under development mainly depend on the measurement of backscattered light. An understanding of the high-angle scattering properties of biological cells is essential in interpreting images obtained with confocal microscopy and OCT. Extraction of morphological information using the spectroscopic techniques described earlier also necessitates a quantitative understanding of high-angle scattering. Moreover, differences in the scattering properties of dysplastic cells relative to normal cells are expected to be enhanced for backscattering geometries since most of the changes associated with dysplasia potentially modulate high-angle scattering. For example, high-angle scattering has been shown to be sensitive to DNA content.16 A possible method for overcoming the problem of artificial reflections within the framework of FDTD modeling is to use the perfectly matched layer (PML) boundary condition to truncate the computational domain. The PML boundary condition creates a fictitious absorbing layer adjacent to the computational domain. Plane waves of arbitrary incidence, polarization, and frequency are matched at the PML boundary; thus artificial reflections are suppressed.24 25 This boundary condition can increase the dynamic range of FDTD modeling to greater than 80 dB,24 and it can be used to minimize artificial reflections sufficiently to enable the study of high-angle scattering. In this paper we present a new implementation of the FDTD algorithm that uses the perfectly matched layer boundary condition. The implemented code has been used to model scattering from normal and dysplastic cervical cells at three different epithelial depths, namely, basal/parabasal, intermediate, and superficial. The construction of realistic cell geometries is a crucial part of modeling. In this work, we use morphological features and chromatin texture information obtained from quantitative histopathology to create realistic cell models within the FDTD grid. 2.Methods2.1.Finite-Difference Time-Domain MethodThe FDTD method, initially developed by Yee, is one of the most popular numerical methods for the solution of problems in electromagnetics. For a detailed description of the theory and implementation of the FDTD method, the reader is referred to books by Taflove.24 25 Briefly, a scattering object is constructed in an FDTD grid by specifying the dielectric properties of each grid cell belonging to the object. The Yee algorithm24 25 26 is then used to calculate the scattered electric and magnetic fields around the scattering object. This algorithm takes Maxwell’s curl equations and discretizes them in space and time, resulting in a set of six explicit finite-difference equations, one for each electric or magnetic field component. The finite-difference equations produce the time-domain near-field scattered electric and magnetic field components. To compute the far-field values, the time-domain tangential field components on a surface S enclosing the scattering object are first converted to frequency-domain values using discrete Fourier transform (DFT). The next step is to define equivalent electric and magnetic surface current densities on S using Huygen’s equivalence principle. Once the spatial Fourier transforms of these current densities are obtained via surface integration over S, the electric and magnetic far-field components can be calculated.24 The scattering patterns and the scattering cross-section values can then be computed using the far-field values.27 28 To simulate propagation in an unbounded medium, special boundary conditions must be applied to prevent artificial reflections at the edges of the computational domain. Many absorbing boundary conditions (ABCs) have been developed since the introduction of the FDTD method. Differential-equation-based ABCs allow a solution that permits only outgoing waves and include those formulated by Engquist and Majda, Mur, and Liao.25 The boundary condition proposed by Berenger in 1994,29 called the perfectly matched layer boundary condition, suppresses artificial reflections by creating a fictitious absorbing layer around the computational domain. The PML boundary condition demonstrates better performance in minimizing artificial reflections and thus provides a greater dynamic range than other ABCs.24 25 30 It is currently considered to be one of the most efficient boundary conditions and it has been selected for the simulations described in this paper. An extensive description of the theoretical formulation and implementation of the PML boundary condition can be found in books by Taflove24 25 and papers by Berenger.29 31 32 33 The FDTD code used for the simulations presented hereafter has been implemented in C/C++. The details concerning the simulation parameters and the method by which the PML has been set up around the scattering structure can be found in a recent work.34 All simulations were performed on a 1.4-GHz personal computer with 2 Gb of RAM. The approximate time required for each simulation was 3 to 4 h. 2.2.Quantitative HistopathologyTo use FDTD modeling to study the scattering characteristics of normal and dysplastic cells, the nuclear changes associated with dysplasia must first be quantified. This can be achieved by analyzing quantitative images of Feulgen-thionin-stained cervical cell nuclei. The Feulgen-thionin stain is stoichiometric for DNA,13 35 therefore these images provide information about nuclear morphology, DNA content, and chromatin organization, and highlight the differences between normal and dysplastic cervical cell nuclei. The quantitative images used in this paper were provided by the British Columbia Cancer Agency (Vancouver, Canada). The clinical study was conducted at the University of Texas M. D. Anderson Cancer Center in Houston. Each patient involved in the study underwent colposcopy. Four adjacent tissue sections were sliced from each biopsy taken during the colposcopic examination. Three of the tissue sections were stained with hematoxylin and eosin (H&E) and used for clinical diagnosis. A group of pathologists classified the sections as either normal, human papilloma virus (HPV), or cervical intraepithelial neoplasia (CIN). The CIN sections were further subclassified as CIN 1 (mild dysplasia), CIN 2 (moderate dysplasia), or CIN 3 (severe dysplasia or squamous carcinoma in situ). The remaining fourth tissue section was stained with Feulgen-thionin and used for quantitative histopathologic analysis at the British Columbia Cancer Agency. A pathologist mapped the diagnostic area on the Feulgen-thionin-stained tissue section, indicating the region containing the cells with the worst diagnosis. An in-house semiautomatic image analysis system (Department of Cancer Imaging, British Columbia Cancer Agency) was then used to acquire an image of the section. A special image analysis software automatically carried out the process of nuclear segmentation and the calculation of nuclear feature statistics. All the nuclei imaged were also categorized into four different epithelial depths, namely, basal, parabasal, intermediate, and superficial. This classification was based on the location of a specific nucleus relative to the entire thickness of the epithelium and also on the cell examination. In this paper we only consider normal and CIN 3 nuclei. The quantitative histopathologic analysis included five normal biopsies taken from four different patients, and sixteen CIN 3 biopsies taken from sixteen different patients. The total number of normal nuclei imaged was 562, and the total number of CIN 3 nuclei imaged was 1069. For the calculation of nuclear feature statistics, we combined nuclei from basal and parabasal layers in a single category, since it was usually very difficult to distinguish between the two, especially in the case of severe dysplasia. Figure 2 shows a subset of the nuclear images provided. Each pixel corresponds to an area of 0.34 μm×0.34 μm. The figure shows the differences between nuclei in different layers and demonstrates most of the features characteristic of CIN 3. It is important to consider nuclei in different layers separately since there are differences in their size and chromatin structure. Normal basal/parabasal and intermediate cell nuclei are usually large, with distinct chromatin network, while superficial cell nuclei are small and pyknotic.36 This is also evident in Fig. 2, where the nucleus in Fig. 2(c) is smaller than the nuclei in Figs. 2(a) and 2(b), and the image appears darker, indicating a denser internal composition. Figure 2Quantitative images for (a) normal, basal/parabasal; (b) normal, intermediate; (c) normal, superficial; (d) CIN 3, basal/parabasal; (e) CIN 3, intermediate; and (f) CIN 3, superficial, nuclei. Each pixel shown is 0.34 μm×0.34 μm. 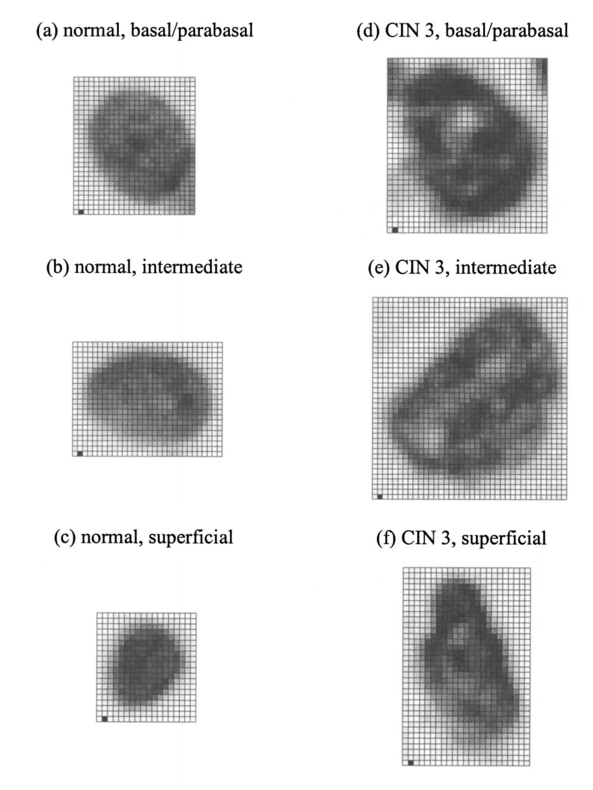 As Fig. 2 demonstrates, CIN 3 nuclei are significantly larger than normal nuclei. Normal nuclei appear rounder, whereas CIN 3 nuclei are asymmetric and appear darker. The relative changes in intensity are attributed to the differences in DNA content; regions with higher DNA content appear darker on images. The nuclei in Figs. 2(d) to 2(f) also show coarse chromatin clumping and condensation, while the nuclei in Figs. 2(a) to 2(c) have a more homogeneous chromatin distribution. The nuclear feature statistics that will be used in FDTD modeling can be divided into two different groups. The first group is related to nuclear morphology and includes information about nuclear size and shape. The second group provides statistics about DNA content, chromatin organization, and chromatin texture that collectively describe the dielectric properties of the nuclei. 2.2.1.Nuclear morphology statisticsThe features that are used to describe nuclear morphology include nuclear area, mean radius, maximum radius, and eccentricity. Nuclear morphology features for each nucleus have been calculated by the in-house image analysis system. 2.2.2.DNA content and chromatin texture statisticsFeulgen-thionin is stoichiometric for DNA. Therefore, the DNA content, and thus the average refractive index of a nucleus, can be assumed to be directly related to the average pixel intensity in an image. Chromatin texture can be described in terms of the magnitude of refractive index fluctuations that correspond to the variations in pixel intensity, and the spatial frequency of refractive index fluctuations that corresponds to the size of chromatin clumps present. The DNA content and chromatin texture statistics have been calculated by analyzing a subset of nuclear images provided. The total number of nuclei analyzed in each diagnostic category was sixty. To extrapolate the average pixel intensity in an image to the mean refractive index n, a conversion factor was required. As a starting point, it was first assumed that the mean refractive index of a normal nucleus was 1.39,37 38 39 and that of a CIN 3 nucleus was 1.42,8 10 20 21 23 independent of the layer. This assumption provided a scale factor to find a relation between a change in pixel intensity and the corresponding change in the absolute refractive index. The natural logarithm of the pixel intensity averaged over all the normal nuclei images was assumed to be proportional to 1.39, and the natural logarithm of the pixel intensity averaged over all the CIN 3 nuclei images was assumed to be proportional to 1.42. Then, by calculating the average pixel intensity for nuclei in different layers, a unique refractive index value was assigned to nuclei in each layer. The magnitude of refractive index fluctuations, Δn, was calculated by observing the intensity variations over images. To find the size of the largest chromatin clumps, and thus the minimum spatial frequency of refractive index fluctuations characterizing each nucleus, a two-dimensional fast Fourier transform (FFT) was performed on each image and the resulting spatial frequency components dominating the spectrum were analyzed. 2.3.Cell Construction in FDTD ModelingCervical epithelial cells have a low fraction of mitochondria, and the main contribution to cellular scattering comes from the nucleus.5 6 40 Therefore, the FDTD simulations described will model the cervical cells as heterogeneous nuclei embedded in homogeneous cytoplasm. This approach also has the advantage of isolating the effects of nuclear morphology and chromatin organization on light scattering. The results from quantitative histopathology provided all the parameters related to nuclear morphology and dielectric properties necessary to construct a heterogeneous nucleus in an FDTD grid. First, an ellipsoid nucleus was created and every point inside the ellipsoid was assigned a constant refractive index value. The dimensions were based on the mean radius, maximum radius, and the eccentricity. To create the refractive index variations inside the nucleus, small cubes with refractive indices in the range n±Δn were placed randomly throughout the ellipsoid. The purpose of using cubes as opposed to other three-dimensional structures was to simplify the algorithm for placing nonoverlapping heterogeneities within the FDTD grid. The size of the cubes was selected randomly from an interval. The lower size limit was 0.34 μm, which corresponded to the resolution of the nuclear images provided. The upper limit on the cube size was given by the size of the largest chromatin clump present. 2.4.FDTD Simulation ParametersThe FDTD simulations for cervical cell nuclei were performed at a wavelength of λ=1064 nm. This wavelength was chosen so that the results would be applicable to imaging techniques such as confocal microscopy and OCT. The refractive index of the cytoplasm was set to 1.36,21 23 37 38 39 and the FDTD grid spacing used was 1/20 of the wavelength inside the cytoplasm. A total of eighteen simulations were carried out. Nine of these simulations were for normal nuclei and the other nine were for CIN 3 nuclei. The nuclear parameters were chosen so that for each diagnostic category there were three basal/parabasal nuclei simulations, three intermediate nuclei simulations, and three superficial nuclei simulations. For each different simulation representing these six different categories, the simulation parameters were randomly selected from the acceptable ranges calculated through quantitative histopathologic analysis. 3.Results3.1.Verification of the FDTD CodeTo verify the implemented FDTD code, we computed the far-field scattering patterns of homogeneous spheres and compared the results with Mie theory. Figure 3 shows the scattering patterns of two homogeneous spheres for an incident plane wave with a wavelength of λ=1 μm. The spheres have a refractive index of 1.02 relative to the outside medium, and the diameters are 5 and 10 μm. These parameters were specifically chosen to create an approximate model for the biologically relevant case with a nucleus embedded in cytoplasm. The FDTD grid spacing used in these simulations was λ/20. Figure 3 also shows the scattering patterns obtained using a boundary condition based on the Liao extrapolation, for a grid spacing of λ/20. The scattering patterns shown were first averaged over the azimuthal angle so that they were functions of the scattering angle only. All results are normalized to the scattered intensity at 0 deg, and the angular resolution for the scattering angle is 1 deg. Figure 3Comparison of PML results with Mie theory and Liao extrapolation. (a) to (b) Spheres with 5 μm diameter. (c) to (d) Spheres with 10 μm diameter. The scattering patterns are normalized to the scattered intensity at 0 deg. The PML results in (b) and (d) demonstrate excellent agreement with Mie theory. 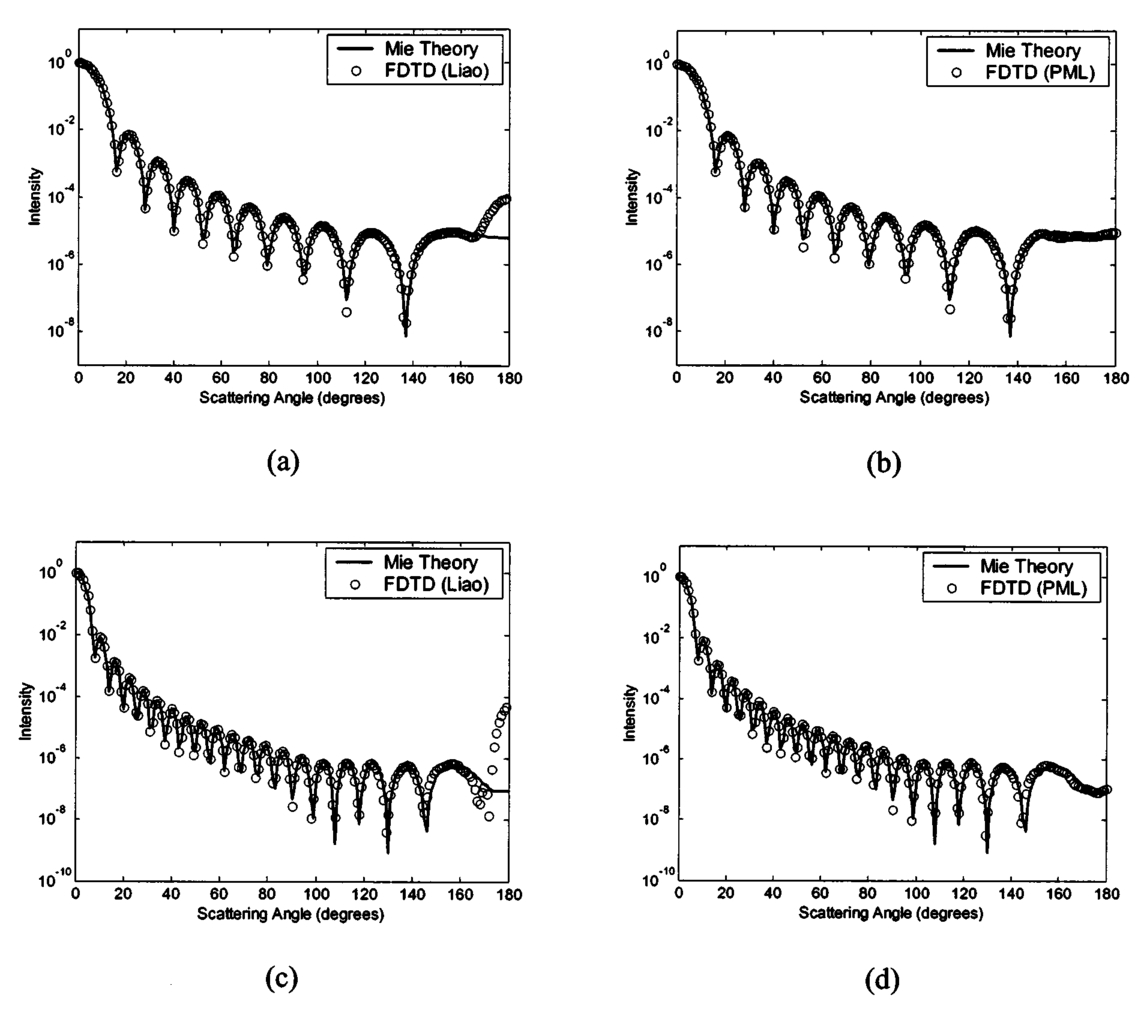 Figures 3(a) and 3(c) show that the results obtained with Liao extrapolation do not agree with Mie theory for angles greater than 160 deg. The FDTD results with Liao extrapolation overestimate scattering at high angles, and the discrepancy can be up to three orders of magnitude, as shown in Fig. 3(c). The scattering patterns obtained with PML, on the other hand, demonstrate excellent agreement with Mie theory at all angles for both of the spheres. The PML results are superior to results obtained with Liao extrapolation, showing that the PML boundary condition is more effective in reducing artificial reflections to negligible levels. The maximum deviation from Mie theory for angles greater than 160 deg occurs at 180 deg for the 10-μm sphere, and this deviation is about 25. 3.2.Quantitative Histopathology ResultsTable 1 shows the average and the standard deviation of parameters that describe nuclear morphology. As Table 1 shows, nuclear area, mean radius, maximum radius, and eccentricity all increase with dysplasia. In most cases, the relative standard deviation values of CIN 3 parameters are greater, indicating nuclear pleomorphism, a well-known characteristic of dysplasia. Table 1
Table 2 shows the computed averages for the mean refractive index n, the largest chromatin clump size, and the corresponding minimum spatial frequency. The range given for the magnitude of the refractive index fluctuations, Δn, corresponds to the extreme intensity variations in a specific layer. Table 2 demonstrates that n increases for CIN 3 nuclei, indicating elevated DNA content. The refractive index fluctuations Δn are also higher, corresponding to increased heterogeneity. Larger chromatin clumps associated with CIN 3 are also evidenced in Table 2. Table 2
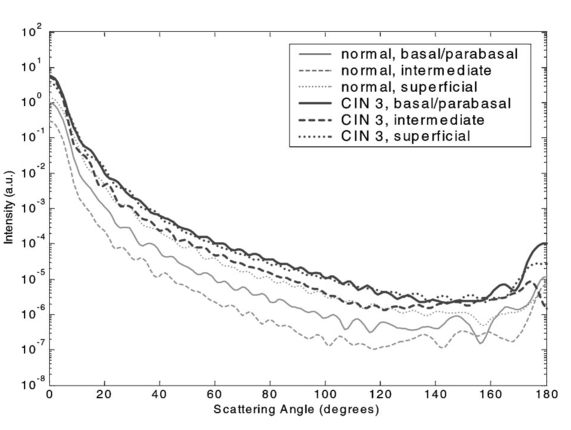
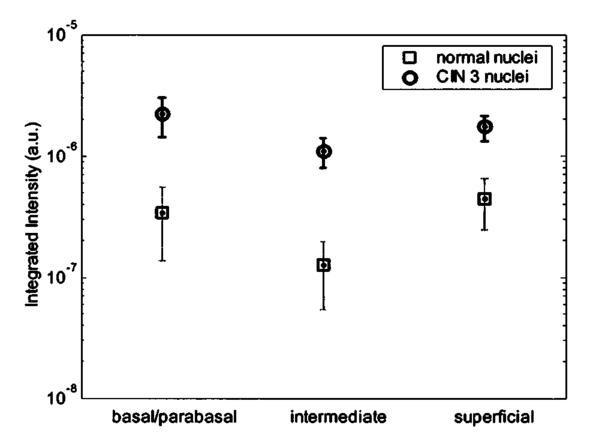
3.3.FDTD Simulation Results3.3.1.Scattering patternsFigure 4 shows the scattering patterns obtained from the basal/parabasal nuclei simulations [Fig. 4(a)], the intermediate nuclei simulations [Fig. 4(b)], and the superficial nuclei simulations [Fig. 4(c)]. All of the scattering patterns were averaged over the azimuthal angle so that they were functions of the scattering angle only. The light-colored curves in Fig. 4 represent the results for the normal nuclei, and the darker curves represent the results for the CIN 3 nuclei. The angular resolution for the scattering angle is 1 deg, and the scattered intensity is given in arbitrary units. Figure 4Scattering patterns of (a) basal/parabasal, (b) intermediate, and (c) superficial nuclei. Three simulation results are shown for each diagnostic category. 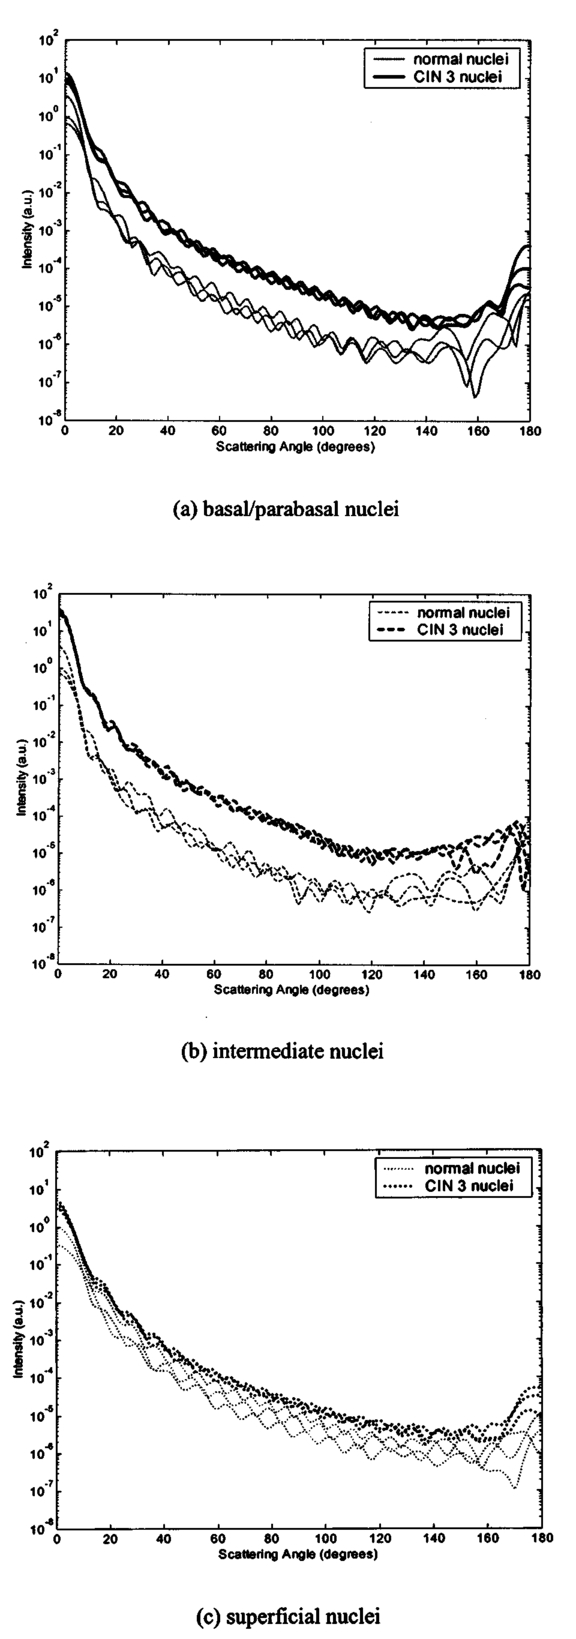 Figure 4 shows that for basal/parabasal and superficial cell nuclei, the intensity of scattered light is higher for CIN 3 nuclei for all scattering angles. For intermediate cell nuclei, however, the intensity is higher for CIN 3 nuclei for up to about 175 deg, but for angles very close to 180 deg, the intensity of light scattered from normal nuclei is usually higher. The figure also demonstrates that the variation in the scattering patterns of nuclei belonging to the same diagnostic category is generally greater for normal nuclei, although the standard deviations in the simulation parameters are greater for CIN 3 nuclei. This can be attributed to the fact that CIN 3 nuclei are larger in size, have higher refractive indices, and are more heterogeneous. Therefore, the intensity maxima and minima in their scattering patterns are not very pronounced, resulting in relatively less varied intensity distributions. Figure 5 shows the scattering patterns averaged over three different simulation results. The most significant differences between normal and CIN 3 nuclei are for the intermediate layer, whereas the superficial layer has the smallest differences in intensity. 3.3.2.Scattering phase functionsA scattering phase function is obtained by normalizing the scattering pattern so that its integral over the solid angle equals 1. Figure 6 shows the phase functions corresponding to the scattering patterns in Fig. 5. As Fig. 6 demonstrates, the overall shapes of the phase functions are very similar for small angles, but differences start to appear after about 120 deg. This is especially true for the intermediate and superficial cell nuclei. For angles greater than 120 deg, scattering from a normal intermediate nucleus is more probable than scattering from a CIN 3 intermediate nucleus. For angles greater than 150 deg, the scattering probability for a CIN 3 superficial nucleus exceeds the scattering probability for a normal CIN 3 nucleus. 3.3.3.Calculation of scattering cross-sectionsThe scattering cross-sections have been calculated for all the nuclei simulated. Figure 7 shows the computed averages of the scattering cross-section values for normal and CIN 3 nuclei in basal/parabasal, intermediate, and superficial layers. The scattering cross-sections are significantly greater for CIN 3 nuclei. For both diagnostic categories, intermediate nuclei have the smallest cross-section. 3.3.4.Integration of scattering patterns over high anglesTo assess the differences in scattered light collected in optical imaging techniques, such as in confocal microscopy, the scattering patterns can be integrated over high angles to estimate the overall changes in collected light intensity. Assuming a numerical aperture of about 0.8 for the collection optics, the region of interest in the scattering patterns of Fig. 4 is the angular range 140 to 180 deg. Figure 8 compares the scattering intensities integrated over this range. The elevation of integrated intensity for CIN 3 nuclei is evident in Fig. 8. This elevation is about an order of magnitude for the basal/parabasal and intermediate layers, whereas it is relatively smaller for the superficial layer. 4.DiscussionResults from FDTD simulations show that there are significant differences in the scattering properties of normal and CIN 3 cervical cell nuclei. The results also validate the importance of treating cell nuclei at different epithelial depths separately since scattering properties vary from layer to layer, especially in normal epithelium. In this work, quantitative histopathology proved to be a suitable way to define nuclear morphology and dielectric structure specific to each different epithelial layer, and also to quantify dysplastic changes in nuclei. This provided realistic input for FDTD modeling. It is important to note, however, that the calculation of refractive index values presented in Table 2 did not consider any possible effect of acetic acid applied to the cervical tissue before biopsy removal. Acetic acid can alter the refractive index profile of nuclei, and assessment of its effect is a current research topic. The scattering patterns in Fig. 5 indicate that changes associated with dysplasia generally lead to increased scattering. The increase in scattered intensity for CIN 3 nuclei at small scattering angles is due to an increase in nuclear size. High-angle scattering is sensitive to the nuclear refractive index profile. Since CIN 3 nuclei are more heterogeneous, an increase in scattered intensity at high angles is also expected. Figure 5 shows that basal/parabasal and superficial nuclei follow this trend. Intermediate nuclei also follow this trend up to about 175 deg, but the backscattered light intensity for CIN 3 nuclei drops to below that of normal nuclei. A possible reason for this behavior is that the mean refractive index for normal intermediate nuclei is very close to that of cytoplasm, as shown in Table 2. Therefore, any heterogeneities introduced into the nucleus can lead to a dramatic increase in backscattered light. This is also evident in Fig. 5, which shows that the averaged scattering pattern for normal intermediate nuclei has the most prominent peak at 180 deg. The phase functions in Fig. 6 indicate that the greatest differences in the scattering probabilities of normal and CIN 3 nuclei tend to occur for high angles. Since high-angle scattering from nuclei is expected to be more sensitive to internal structure rather than the overall size and the mean refractive index, the enhancement of differences for high-angle scattering probabilities is a significant result in terms of the possibility of probing the chromatin texture and organization of nuclei in different diagnostic categories. Figure 7 shows that the nuclei in the intermediate layer have the smallest scattering cross-section and that basal/parabasal layer cross-section is greater than that of the intermediate layer. This scattering trend has been observed in confocal images of cervical tissue. As an illustration, Fig. 9 shows confocal images of (a) basal/parabasal (300 μm below the surface), (b) intermediate (150 μm below the surface), and (c) superficial layers (50 μm below the surface) of ex vivo normal cervical epithelium. The measured lateral and axial resolution of the confocal system used is 0.8 and 2 to 3 μm, respectively.6 The nuclei observed in the images show that scattering decreases in going from the superficial layer to the intermediate layer, but then increases in the basal/parabasal layer. Note that the confocal system operates at a wavelength of 810 nm and that the images have been acquired after the application of acetic acid,6 but scattering from nuclei follows the general trend observed in Fig. 7. The confocal images can be interpreted more appropriately by considering the integrated intensity values of Fig. 8, since confocal microscopy basically provides a map of integrated high-angle scattering from nuclei. Figure 10 compares the gray-scale values obtained from confocal images with the integrated scattering intensities shown in Fig. 8. The gray-scale values given for each layer have been calculated by recording pixel intensities (0 to 255) from ten different locations representing nuclear areas on the images. The standard deviations of these pixel intensities are also shown. The figure demonstrates good correlation between a change in pixel intensities from one layer to another and the corresponding change in integrated scattering intensities. Figure 9Confocal images of (a) basal/parabasal, (b) intermediate, and (c) superficial layers of a normal cervical epithelium. The arrows point to nuclei. 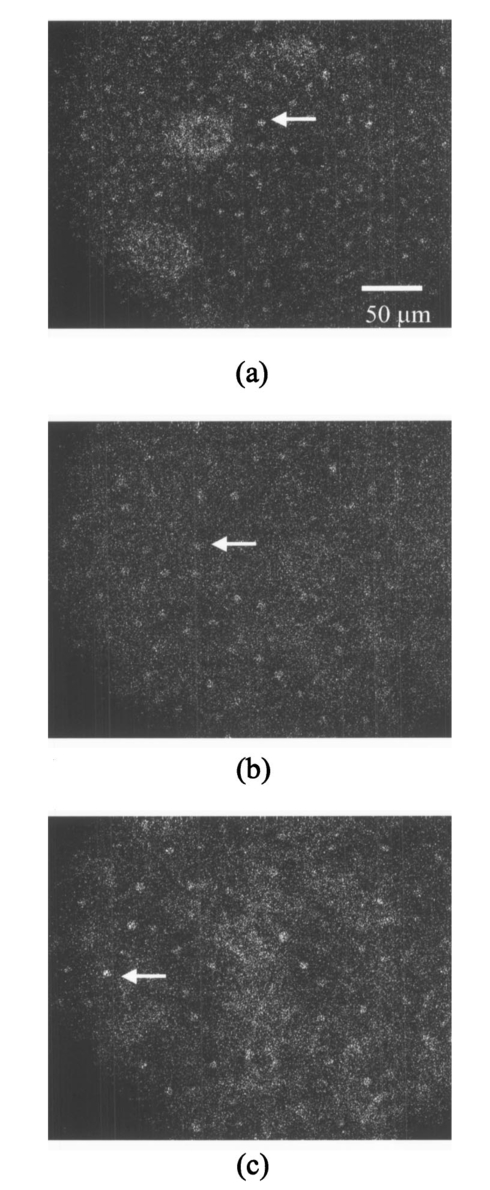 Figure 10Comparison of the gray-scale values from confocal images of normal cervical tissue and the integrated scattering intensities from Fig. 8.  An overall increase in scattering from dysplastic cell nuclei is seen in the calculated cross-section values, whereas Fig. 8 specifically shows the elevation of high-angle scattering. Increased high-angle scattering from tumorigenic cells has been previously reported by Mourant et al.;,16 41 who carried out angle-dependent light-scattering measurements on tumorigenic and nontumorigenic rat embryo fibroblasts. Also, an increase in backscattered light intensity has been noted in a study by Pan et al.;42 involving the use of OCT imaging for detection of tumorigenesis in rat bladders. Finally, confocal images of cervical biopsies presented in papers by Collier et al.;6 and Drezek et al.;40 also showed elevated scattering from dysplastic cell nuclei, which is consistent with the FDTD modeling results. 5.ConclusionsIn summary, the FDTD method provides a flexible approach to simulating light scattering from complex objects of any dielectric shape. Therefore, the method is a promising tool for further investigating and understanding the relationship between the morphological and biochemical structure of cells and light scattering. Such an understanding can provide a guide for the design of scattering-based optical instruments with better diagnostic capabilities. AcknowledgmentsThe authors thank Tom Collier for providing confocal images of normal cervical epithelium. Funding from the National Cancer Institute (grant PO1 CA-82710) is gratefully acknowledged. REFERENCES
K. J. Busam
,
K. Hester
,
C. Charles
,
D. L. Sachs
,
C. R. Antonescu
,
S. Gonzalez
, and
A. C. Halpern
,
“Detection of clinically amelonatic malignant melanoma and assessment of its margins by in vivo confocal scanning laser microscopy,”
Arch. Dermatol. , 137 923
–929
(2001). Google Scholar
M. Rajadhyaksha
,
G. Menaker
,
T. Flotte
,
P. J. Dwyer
, and
S. Gonzalez
,
“Confocal examination of nonmelanoma cancers in thick skin excisions to potentially guide mohs micrographic surgery without frozen histopathology,”
J. Invest. Dermatol. , 117 1137
–1143
(2001). Google Scholar
C. Pitris
,
C. Jesser
,
S. A. Boppart
,
D. Stamper
,
M. E. Brezinski
, and
J. G. Fujimoto
,
“Feasibility of optical coherence tomography for high-resolution imaging of human gastrointestinal tract malignancies,”
J. Gastroenterol. , 35 87
–92
(2000). Google Scholar
J. M. Poneros
,
S. Brand
,
B. E. Bouma
,
G. J. Tearney
,
C. C. Compton
, and
N. S. Nishioka
,
“Diagnosis of specialized intestinal metaplasia by optical coherence tomography,”
Gastroenterology , 120
(1), 7
–12
(2001). Google Scholar
T. Collier
,
P. Shen
,
B. de Pradier
,
K. Sung
,
A. Malpica
,
M. Follen
, and
R. Richards-Kortum
,
“Near real time confocal microscopy of amelanotic tissue: Dynamics of aceto-whitening enable nuclear segmentation,”
Opt. Express , 6
(2), 40
–48
(2000). Google Scholar
T. Collier
,
A. Lacy
,
R. Richards-Kortum
,
A. Malpica
, and
M. Follen
,
“Near real-time confocal microscopy of amelanotic tissue: Detection of dysplasia in ex vivo cervical tissue,”
Acad. Radiol. , 9 504
–512
(2002). Google Scholar
C. Yang
,
L. T. Perelman
,
A. Wax
,
R. R. Dasari
, and
M. S. Feld
,
“Feasibility of field-based light scattering spectroscopy,”
J. Biomed. Opt. , 5
(2), 138
–143
(2000). Google Scholar
V. Backman
,
R. Gurjar
,
K. Badizadegan
,
I. Itzkan
,
R. R. Dasari
,
L. T. Perelman
, and
M. S. Feld
,
“Polarized light scattering spectroscopy for quantitative measurement of epithelial cellular structures in situ,”
IEEE J. Sel. Top. Quantum Electron. , 5
(4), 1019
–1026
(1999). Google Scholar
R. S. Gurjar
,
V. Backman
,
L. T. Perelman
,
I. Georgakoudi
,
K. Badizadegan
,
I. Itzkan
,
R. R. Dasari
, and
M. S. Feld
,
“Imaging human epithelial properties with polarized light-scattering spectroscopy,”
Nat. Med. (N.Y.) , 7
(11), 1245
–1248
(2001). Google Scholar
K. Sokolov
,
R. A. Drezek
,
K. Gossage
, and
R. R. Richards-Kortum
,
“Reflectance spectroscopy with polarized light: Is it sensitive to cellular and nuclear morphology?,”
Opt. Express , 5
(13), 302
–317
(1999). Google Scholar
J. R. Mourant
,
T. M. Johnson
, and
J. P. Freyer
,
“Characterizing mammalian cells and cell phantoms by polarized backscattering fiber-optic measurements,”
Appl. Opt. , 40
(28), 5114
–5123
(2001). Google Scholar
J. Thiran
and
B. Macq
,
“Morphological feature extraction for the classification of digital images of cancerous tissues,”
IEEE Trans. Biomed. Eng. , 43
(10), 1011
–1020
(1996). Google Scholar
K. Erhardt
,
G. Auer
,
E. Bjorkholm
,
G. Forsslund
,
B. Moberger
,
C. Silfversward
,
G. Wicksell
, and
A. Zetterberg
,
“Prognostic significance of nuclear DNA content in serious ovarian tumors,”
Cancer Res. , 44 2198
–2202
(1984). Google Scholar
C. J. Rodenburg
,
C. J. Cornelisse
,
P. A. M. Heintz
,
J. Hermans
, and
G. J. Fleuren
,
“Tumor ploidy as a major prognostic factor in advanced ovarian cancer,”
Cancer (N.Y.) , 59 317
–323
(1987). Google Scholar
J. R. Mourant
,
M. Canpolat
,
C. Brocker
,
O. Esponda-Ramos
,
T. M. Johnson
,
A. Matanock
,
K. Stetter
, and
J. P. Freyer
,
“Light scattering from cells: the contribution of the nucleus and the effects of proliferative status,”
J. Biomed. Opt. , 5
(2), 131
–137
(2000). Google Scholar
J. R. Mourant
,
J. P. Freyer
,
A. H. Hielscher
,
A. A. Eick
,
D. Shen
, and
T. M. Johnson
,
“Mechanisms of light scattering from biological cells relevant to noninvasive optical-tissue diagnostics,”
Appl. Opt. , 37
(16), 3586
–3593
(1998). Google Scholar
A. Dunn
and
R. Richards-Kortum
,
“Three-dimensional computation of light scattering from cells,”
IEEE J. Sel. Top. Quantum Electron. , 2
(4), 898
–905
(1996). Google Scholar
R. Drezek
,
A. Dunn
, and
R. Richards-Kortum
,
“Light scattering from cells: finite-difference time-domain simulations and goniometric measurements,”
Appl. Opt. , 38
(16), 3651
–3661
(1999). Google Scholar
R. Drezek
,
A. Dunn
, and
R. Richards-Kortum
,
“A pulsed finite-difference time-domain (FDTD) method for calculating light scattering from biological cells over broad wavelength ranges,”
Opt. Express , 6
(7), 147
–157
(2000). Google Scholar
R. Drezek
,
M. Guillaud
,
T. Collier
,
I. Boiko
,
A. Malpica
,
C. MacAulay
,
M. Follen
, and
R. Richards-Kortum
,
“Light scattering from cervical cells throughout neoplastic progression: Influence of nuclear morphology, DNA content, and chromatin texture,”
J. Biomed. Opt. , 8
(1), 7
–16
(2003). Google Scholar
A. Taflove
and
M. E. Brodwin
,
“Numerical solution of steady-state electromagnetic scattering problems using the time-dependent Maxwell’s equations,”
IEEE Trans. Microwave Theory Tech. , 23
(8), 623
–630
(1975). Google Scholar
J. Berenger
,
“A perfectly matched layer for the absorption of electromagnetic waves,”
J. Comput. Phys. , 114 185
–200
(1994). Google Scholar
P. Yang
,
K. N. Liou
,
M. I. Mishchenko
, and
B. Gao
,
“Efficient finite-difference time-domain scheme for light scattering by dielectric particles: application to aerosols,”
Appl. Opt. , 39
(21), 3727
–3737
(2000). Google Scholar
J. Berenger
,
“Three-dimensional perfectly matched layer for the absorption of electromagnetic waves,”
J. Comput. Phys. , 127 363
–379
(1996). Google Scholar
J. Berenger
,
“Perfectly matched layer for the FDTD solution of wave-structure interaction problems,”
IEEE Trans. Antennas Propag. , 44
(1), 110
–117
(1996). Google Scholar
J. Berenger
,
“Improved PML for the FDTD solution of wave-structure interaction problems,”
IEEE Trans. Antennas Propag. , 45
(3), 466
–473
(1997). Google Scholar
M. Guillaud
,
A. Doudkine
,
D. Garner
,
C. MacAulay
, and
B. Palcic
,
“Malignancy associated changes in cervical smears: systematic changes in cytometric features with the grade of dysplasia,”
Anal. Cell. Pathol. , 9
(3), 191
–204
(1995). Google Scholar
R. Barer
,
“Refractometry and interferometry of living cells,”
J. Opt. Soc. Am. , 47
(6), 545
–556
(1957). Google Scholar
A. Brunsting
and
P. Mullaney
,
“Differential light scattering from spherical mammalian cells,”
Biophys. J. , 14 439
–453
(1974). Google Scholar
J. M. Schmitt
and
G. Kumar
,
“Turbulent-nature of refractive-index variations in biological tissue,”
Opt. Lett. , 21
(16), 1310
–1312
(1996). Google Scholar
R. A. Drezek
,
T. Collier
,
C. K. Brookner
,
A. Malpica
,
R. Lotan
,
R. R. Richards-Kortum
, and
M. Follen
,
“Laser scanning confocal microscopy of cervical tissue before and after application of acetic acid,”
Am. J. Obstet. Gynecol. , 182
(5), 1135
–1139
(2000). Google Scholar
J. R. Mourant
,
T. M. Johnson
,
V. Doddi
, and
J. P. Freyer
,
“Angular dependent light scattering from multicellular spheroids,”
J. Biomed. Opt. , 7
(1), 93
–99
(2002). Google Scholar
Y. Pan
,
J. P. Lavelle
,
S. I. Bastacky
,
S. Meyers
,
G. Pirtskhalaishvili
,
M. L. Zeidel
, and
D. L. Farkas
,
“Detection of tumorigenesis in rat bladders with optical coherence tomography,”
Med. Phys. , 28
(12), 2432
–2440
(2001). Google Scholar
|
||||||||||||||||||||||||||||||||||||||||||||||||||||||||||||||||||||||||||||||||||||||||||||||||||||||||||||||||||||||||


CITATIONS
Cited by 80 scholarly publications and 2 patents.
Scattering
Light scattering
Finite-difference time-domain method
Refractive index
Mie scattering
Confocal microscopy
Cancer


