1.IntroductionPulse oximeters are widely used for noninvasive monitoring of oxygen saturation (SO 2) in arterial blood hemoglobin.1 2 3 4 5 6 The classical pulse oximeters4 5 6 use light-emitting diodes (LEDs) as sources, with emissions in two regions of the optical spectrum—in the red (e.g., 660 nm) and in the infrared (880 to 940 nm). Although it is a well-established technique, some studies are still devoted to its improvement.7 8 9 10 11 12 13 14 15 The wavelengths used in pulse oximetry have not varied for decades. In the past five years alternative wavelengths11 12 13 14 15 have been proposed, mainly to apply reflectance pulse oximetry to fetal monitoring more effectively.13 14 Jo¨bsis16 first showed that near-infrared (NIR) radiation penetrates excellently through biological tissues. Since this work in the 1970s, several authors have applied NIR techniques to tissue oximetry.17 Another advantage of NIR wavelengths is the small optical absorption of the carboxyhemoglobin18 19 20 and, indeed, the minimal interference in pulse oximetry. With the aim of applying NIR-range wavelengths to pulse oximetry, we proposed an optical sensor based on two near-infrared laser diodes.21 22 We also developed a real-time processing algorithm23 24 that allowed us to analyze our sensor output and to derive a correct value of a parameter related to SO 2 with good dynamic characteristics from the noisy time-variant detected signals. In this paper we present the experimental results obtained during the development of the whole NIR transmittance pulse oximeter system with laser diodes, the modifications in the sensor configuration, signal-processing algorithm, and calibration procedure,25 26 and a comparison with a last-generation pulse oximeter. 2.Measurement PrinciplesOxygen saturation refers by definition to the part of hemoglobin concentration in the blood that can combine reversibly with oxygen27 and is usually expressed as a percentage. Consequently where C tHb , C dHb , C HbO 2 , and C RHb are the concentrations of total hemoglobin, dyshemoglobins, oxyhemoglobin, and deoxyhemoglobin, respectively.The pulse oximetry technique is based on the time-variable optical attenuation by a vascular bed that is due to the cardiac pumping action (photoplethysmography) and the differential optical absorption of the oxy- (HbO 2) and deoxyhemoglobin (RHb). This approach assumes that the time-dependent photoplethysmographic signal is caused solely by changes in the arterial blood volume associated with the cardiac cycle and that no other hemoglobin derivatives different from HbO 2 or RHb are present. This signal is decomposed into its variable or pulsating component (EAC) and the constant or nonpulsating component (EDC). The variable component of the photoplethysmograms (PPG) results from the expansion and relaxation of the arterial bed, while the constant component is related to the attenuation by nonpulsating arterial blood, venous blood, and tissues. Oxygen saturation is derived by analyzing the pulsating component peak-to-peak value (EAC) of the PPG related to the corresponding constant component (EDC) of the PPG at two specific wavelengths. Some theoretical equations assume the validity of Beer-Lambert-Bouguer’s law for deriving the relationship between oxygen saturation (SO 2) and the optical properties of a pulsating vascular bed as2 3 4 where ε RHb λ1 , ε HbO 2 λ1 , ε RHb λ2 , ε HbO 2 λ2 are the absorptivities or specific absorption coefficients of RHb and HbO 2 at wavelengths λ1 and λ2, respectively, and q is the ratio of the signals EAC and EDC for these wavelengths,2 3 which could be expressed as The attenuation of the radiation by a human body pulsatile bed is due to the blood RHb and HbO 2 absorption, but multiple scattering in the tissue structures and red blood cells also contributes to it.28 Thus, in a real situation, Eq. (2) is an approximation and many studies have attempted to obtain more realistic models for both transmittance29 30 31 and reflectance32 12 14 15 modes. From a practical point of view, a typical relationship used for calibrating pulse oximeters has the form33 where K1, K2, K3, and K4 are coefficients derived from the pulse oximeter calibration procedure that are related to the HbO 2 and RHb absorption coefficients.3.Optical SensorThe sensor developed consists of optical emitters, photodetectors, and a photodetector preamplifier. Two laser diodes with peak wavelengths close to 750 and 850 nm, respectively, are used as optical emitters. Figure 1 shows the emission spectra21 of the laser diodes (LD1 and LD2) overlaid on the HbO 2 and RHb absorptivities31 from 700 to 900 nm. At wavelengths below 800 nm, the RHb specific absorption coefficients are higher than the HbO 2 one, while in the region above 800 nm the HbO 2 absorption predominates. Taking into account Eq. (2), the difference in the HbO 2 and RHb specific absorption coefficients must be as large as possible at each measurement wavelength in order to increase the sensor’s sensitivity. This guarantees better oximeter accuracy since any change in actual saturation implies a larger change in q [Eq. (2)]. In the NIR spectral range, we choose the wavelength emission close to 760 nm because there is a clear maximum difference in the absorption between HbO 2 and RHb spectra. The full emission width at half LED intensity with a peak emission at 760 nm is no less than 20 nm.21 The emission of such an LED is wider than the LD1 emission. The latter better matches the optical absorption characteristics of the oxygenated and nonoxygenated hemoglobin in the narrow 750 to 760-nm band. Thus the LD1 has been used21 22 25 26 to substitute the red LED typically used in pulse oximetry. The LD2 emission corresponds to a wavelength above 800 nm at which the HbO 2 absorptivity is higher than the RHb one. Figure 1Absorption spectra of HbO 2 and RHb31 from 700 to 900 nm and, superimposed, the emission spectra of laser diodes LD1 and LD2. The LD1 emission matches a band of local maximal differential absorption between HbO 2 and RHb spectra. The LD2 emission corresponds to a higher HbO 2 absorption than RHb. 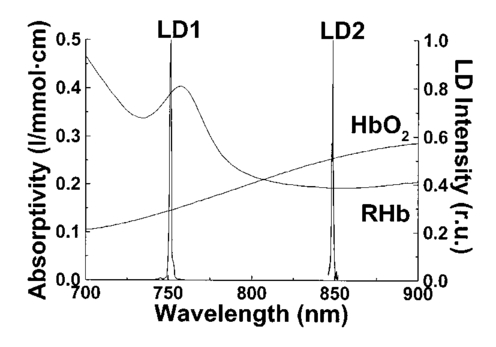 As a first characterization of the sensor, we started with a study of the emitters. The laser diode LD1 is based on an AlGaAs quantum well structure fabricated by metal organic chemical vapor deposition (ILPN, NPO, Russia). The second one (LD2) is a separated confinement heterostructure–gradient refractive index (SCH-GRIN) GaAs quantum well laser emitting around 850 nm and fabricated by molecular beam epitaxy (Instituto de Microelectro`nica de Madrid, CNM, Spain). The laser diodes were studied and characterized using established techniques.21 In Table 1 the results obtained for the laser diodes ILPN-750 (LD1) and IMM-850 (LD2) are summarized. Table 1
A second study21 was performed in order to characterize the signal sensor’s stability and linearity, and to select the work interval. The test measurement system consisted of emitters, detectors, the sensor electronics, an acquisition board (a 12-bit Lab PC+, National Instruments), and a personal computer, using neutral filters (stability and linearity studies) and a human finger (linearity and work interval selection). In the study using neutral filters, the emitters and the photodetectors were kept parallel with each other, on opposite sides, with a separation distance of 12 mm between both parts. To minimize optical interference, the neutral filters were placed close to the photodetector and the setup was covered with a black protector. Each LD was activated in pulsed mode for 1 μs at a repetition rate of 1 kHz. The detected signals were digitized and a ten-sample averaging was performed, giving 100 samples per second (Sa/s) for each LD. For the stability study, a neutral filter (FS-3 OD300, Newport) was placed between the emitters and the photodetectors and each LD was activated at a specific injection current level. The analysis of the recorded 10-s intervals, for both LDs, showed that the variations in the detected signals were no higher than the acquisition board’s resolution. The linear response of the detection block was tested by placing different neutral filters (FS-3, Newport) between the emitters and the photodetectors and activating each LD at a specific injection current level. The filters were placed either in single form or stacked to vary the optical densities (OD) from 2 to 4.5, taking into account that the detected signals must coincide with the dynamic range of the acquisition board. The output sensor signals were registered for 1 s and their average values (In) were obtained for each filter or filter combination (OD n). The maximal average value for each LD was taken as a reference value (Ir) and the optical density of that filter was also taken (OD r). The plot of log(Ir/In) versus (OD n−OD r) showed a lineal behavior, with correlation coefficients higher than 0.99 for both LDs. In order to study the emission linearity, a neutral filter (FS-3 OD300, Newport) was placed between the emitters and the photodetectors and each LD was activated at different levels of injection current. The output sensor signals for each LD at each injection current were registered for 1 s. The plot of the average values for each current level versus these currents reproduced the behavior of the corresponding power versus current characteristics previously measured in continuous mode. The laser diode-based optical sensor and the measurement system were also tested for different LD levels of injection currents, but placing between the emitters and the photodetectors a human pulsating vascular bed (the distal part of a finger) (Fig. 2). The output sensor signals for each LD at each injection current were registered for 10 s, as shown on the right of Fig. 2(b) for the 750-nm LD. Despite the normal and inevitable variations of these photoplethysmograms, the plot of the average values for each current level versus these currents [(+) in Fig. 2(a)] reproduced quite well the behavior of the corresponding power versus current characteristics previously measured in continuous mode [(+) in Fig. 2(a)]. Similar behavior was observed for the 850-nm LD. From these data we selected the working interval for each laser diode. Figure 2The sensor system at different emitter injection current levels in the measurement of a human pulsating vascular bed (distal part of a finger). (a) Continuous-mode power versus current characteristics (–) and the average values (+) of each PPG for the laser diode ILPN-750 in pulsed mode (1 μs, 1 kHz). (b) Ten seconds of PPG at different values of injection currents: PPG1 at I=50 mA, PPG2 at I=60 mA, PPG3 at I=65 mA, and PPG4 at I=70 mA. 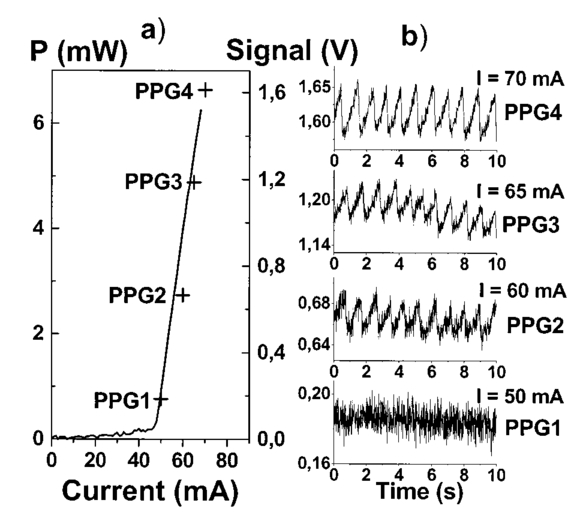 In the early version of the optical sensor, the LDs were mounted separated (7 mm) in their own original metal substrate.21 22 The preliminary results obtained with this prototype were reported,22 but it was concluded that further studies and improvements in the sensor configuration were necessary, mainly owing to this large separation. To reduce the mismatch in both the pulsating and nonpulsating volumes probed by each wavelength and to minimize movement artifacts, a different arrangement was implemented in the sensor emitters.25 26 In this case, the two LD chips were mounted on a single metal heat sink with a separation distance between their central parts of 0.7 mm [Fig. 3(a)]. Both chips were situated so that the larger diverging axes of their emission beam were parallel to the sensor’s central longitudinal axis. Taking this into account, three BPW34 (Siemens) p-i-n silicon photodiode (PD) photodetectors were connected in parallel [Fig. 3(b)]. On the back side of the PD we have the first amplifier stage, which converts the photocurrent into a proportional voltage. The configuration of the optical sensor corresponds to the transmission mode. Thus the emitters and the photodetectors are situated on opposite sides, in close contact with the peripheral vascular bed to be analyzed [the distal part of a finger in Fig. 3(c)]. Figure 3Scheme of the NIR laser diode-based transmittance optical sensor. (a) In the sensor emitter side, the laser diodes LD1 and LD2 are mounted on a single metal heat sink, with a distance between their central parts of 0.7 mm. (b) The detection side with three BPW34 p-i-n silicon photodiodes. (c) A pulsating vascular bed (fingertip) in close contact with both sensor sides during a measurement. The first amplifier stage, which converts the photocurrent to a proportional voltage, is located in the back side of the photodiodes. 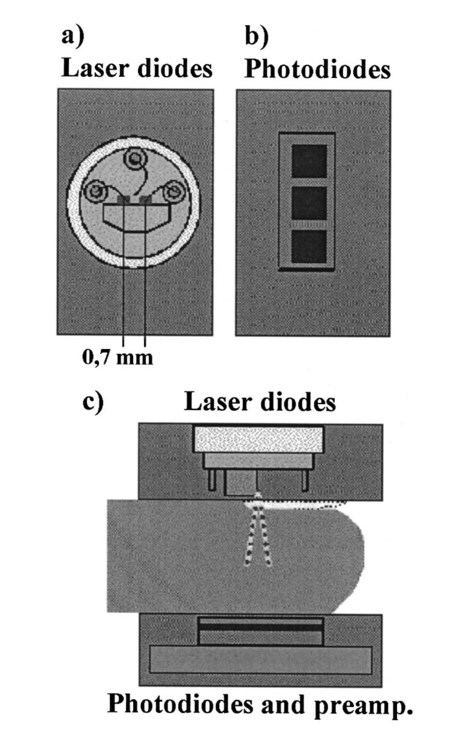 4.Measurement SystemThe pulse oximetry measurement system consists of an optical sensor, the sensor electronics, and the signal-processing unit. As shown in Fig. 4, the laser diode driver, amplification stages, and timing and sample-and-hold circuits (S&H) constitute the sensor electronics. The laser diode driver generates pulses that sequentially activate each LD for 5 μs at a repetition rate of 1 kHz. The output voltage from the PD preamplified stage is further amplified and decomposed into separated channels using sample-and-hold circuits synchronously triggered with respect to the pulse driving the corresponding LD. The outputs of the S&H are fed into the analog inputs of a data acquisition board (12-bit DAQ1200, National Instruments). The acquisition board (DAQ) and the processing programs installed on a hand-held personal computer (Satellite 4000, Toshiba) constitute the signal-processing unit. The timing board of the sensor electronics also generates the trigger and conversion signals for the DAQ. The S&H output signals are analogically prefiltered by the DAQ with a simple antialiasing resistive-capacitive (R-C) low-pass filter at 300 Hz and are digitized at 1 kSa/s for every channel. The further stages of the signal processing are carried out through an algorithm.21 22 23 24 Figure 4Scheme of the pulse oximetry system and the connection of different components. The timing board generates the control signals for the laser driver, the sample-and-hold (S&H) circuit, and the acquisition board (DAQ) installed in the computer. The laser diode driver sequentially activates each sensor LD for 5 μs at 1 kHz. The sensor PD preamplified stage output is amplified and decomposed in the S&H. Then the signals are analogically prefiltered by the DAQ with a simple antialiasing R-C low-pass filter at 300 Hz and are digitized at 1 kSa/s for further processing using an algorithm. 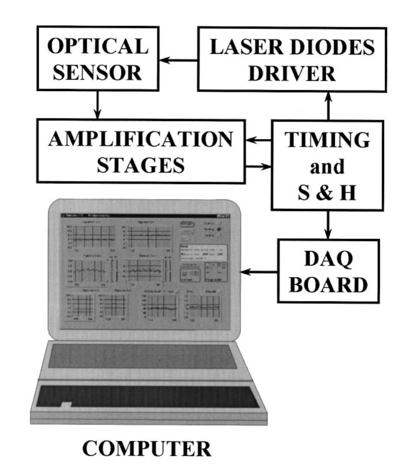 5.Signal-Processing AlgorithmThe main difficulties in the extraction of the information from the PPG signals for each wavelength stem from the small signal variation value, which is related to their constant values and the presence in the signals of artifacts caused by movements of the part under analysis or spike noise. The proposed signal-processing algorithm23 24 for calculating q relies on a numeric separation of EAC and EDC signals for both wavelengths and nonlinear filtering. The first operation performed on the raw measured data is a low-pass filtering implemented with a ten-sample average algorithm. This pass reduces the amount of data tenfold and ensures, in conjunction with the above-mentioned hardware R-C filtering, a correct antialiasing processing of the original signal. A flow of 100 Sa/s of data is then fed to the following elaboration stages. Both channel streams of data, E1(t) and E2(t) (Fig. 5), are then digitally filtered to obtain the required EAC and EDC values. The EDC is obtained by a low-pass filtering, and EAC by a bandpass one, followed by a peak-to-peak detector designed to reject spike noise and movement artifacts. The two linear filters, low pass and bandpass, are obtained by a combination of two Bessel-type low-pass filters discretized by a simple zero-order sample-and-hold algorithm. We selected the Bessel filter over more sharp-edged filters such as the Chebychev or Butterworth31 because of the higher linearity in phase response offered by the Bessel low-pass filters, which is reflected in a minor distortion in the shape of the PPG signals. Figure 5Flow diagram of the signal processing algorithm showing the operations performed on both channel signals E1(t) and E2(t), Bessel-type low-pass filters [Bessel(E(t),f,n)], histogram reduction filtering (HIST), and the variable EAC and constant EDC values for each wavelength required for the determination of q and SO 2. 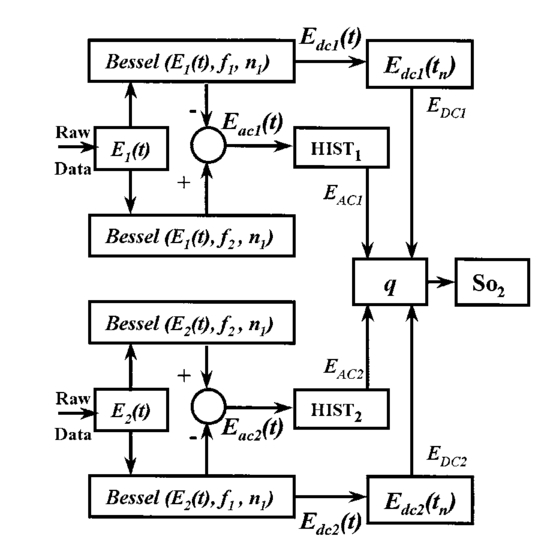 As shown in Fig. 5, the signal is filtered by a low-pass filter of order n1 and a low cutoff frequency f1, in order to obtain the constant value Edc(t) of the input signal E(t). After this stage, the signal Edc(t) is almost constant or nonvariable over the period of the variable component of the PPG. In consequence, this value is directly suitable to be used as the EDC parameter of expression (3). A similar filter, with an order n1 and a cutoff frequency f2 is used to suppress high-frequency noise and ripple. The bandpass-filtered signal Eac(t) is then obtained from the difference between the outputs of the two filters, optionally corrected by a delay line that takes care of the different group delays of the two Bessel filters. Since the signal pulsation is generated by the beating heart, one can reasonably assume that it will be more than 0.5 Hz (i.e., 30 beats/min) and not exceed 5 Hz (i.e., 300 beats/min).4 Because of that, the frequency values of the filters are on the order of some tenths of a hertz for f1 and in the range of 10 to 30 Hz for f2, being n1=6 in our case. To obtain the peak-to-peak value of the pulsatile component EAC, a more complex approach has to be applied because the measure is affected by sporadic spike noises. A simple median filter (ordering the sampled data over a mobile window and choosing the median value) was tried, but the rejection of the spikes was unsatisfactory.20 To obtain the peak-to-peak value, a histogram reduction algorithm20 22 23 was developed (HIST in Fig. 5). As shown in Fig. 6, a frequency distribution of the data obtained after the bandpass filtering [Eac(t) in Fig. 5] for a defined time interval is computed. A fixed percentage of samples from both ends of such a distribution or histogram is discarded as artifacts (cutoff regions in Fig. 6). The number or percentage of rejected points is closely related to the signal noise, and it must be obtained after a study of the signals acquired (see Sec. 6). As the spikes appear in maxima and minima of the variable signal [Eac(t) in Fig. 5], the number of rejected points is similar in both extremes. The peak-to-peak value of the variable component EAC is calculated from the difference between the maximum or higher value E top and the minimum or lower value E bot of the reduced frequency distribution diagram. From the EDC and EAC components for each wavelength, we first calculate the q parameter, and then the corresponding SO 2 value using the expression obtained after the calibration procedure (see Sec. 6). Figure 6Illustration of the histogram reduction procedure. A frequency distribution of the PPG signal values is computed and a fixed sample percentage is rejected from both ends of the distribution (cutoff regions). The peak-to-peak value of the variable component EAC is calculated from the difference between the maximum or higher value E top and the minimum or lower value E bot of the reduced-frequency distribution diagram. 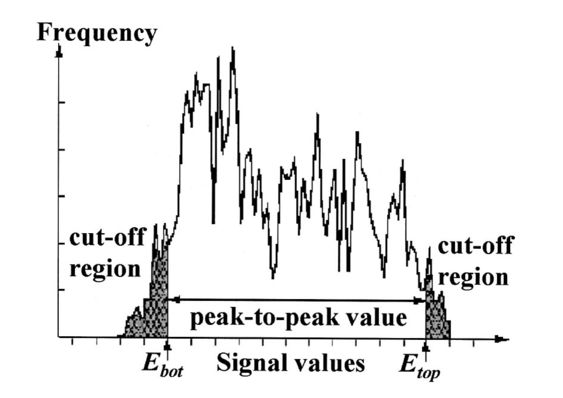 The algorithm24 was implemented using Lab Windows/CVI (National Instruments) facilities so that processing could be carried out both in real time and offline (postprocessing). It is possible to set up the Bessel filter cutoff frequencies, the histogram reduction parameters, and the time processing interval in a user-friendly manner. In addition one can select the generation of files containing the 100 Sa/s PPG signals for both wavelengths, as well as the heart rate, q, and saturation values obtained after all the processing. These options permit us to analyze the signals under different parameters, study the performance of the relation between q and SO 2, and adjust and optimize the processing conditions. The computer monitor displays all the fixed and derived parameters, as well as the constant and variable components obtained for both wavelengths. Figure 7 shows an example of the performance of the pulse oximetry system26 at different processing stages. In the upper part are shown the photoplethysmographic signals (E1 and E2, left axis) corresponding to each laser diode (LD1 and LD2). The values of q obtained after the processing of the fixed 2-s interval are shown in the middle section-(right axis). In the lower graphic the corresponding oxygen saturation values (SpO 2) obtained after pulse oximetry calibration (see Sec. 6) are displayed. Figure 7Performance of the whole NIR laser diode-based transmittance pulse oximetry system at different processing stages.26 In the upper part, the PPG signals corresponding to LD1 and LD2 (E 1 and E 2, respectively) are represented. The middle and lower parts show the q and oxygen saturation (SpO 2) values obtained. The dotted lines indicate the lower and higher values of q in the time interval represented. 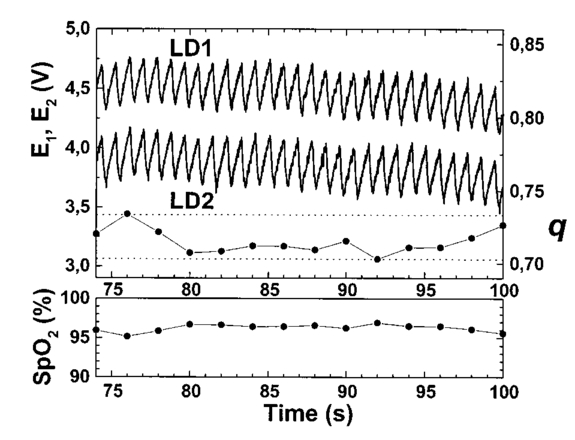 6.CalibrationThe relationship between the parameter q obtained after the processing of the measured signals and the oxygen saturation values is given by the calibration curve. This curve is specific for each sensor configuration and emitter wavelength used. To calibrate the proposed system as a pulse oximeter, a medically supervised study was conducted in the pneumology department of a Madrid university hospital (Hospital Universitario San Carlos).25 After approval by the ethics committee of the hospital, patients with respiratory failure who required specific arterial blood determinations as a part of their conventional medical attention were studied. The selected group of 41 patients with respiratory failure, ranging from 50 to 86 years of age, allowed us to cover low oxygen saturation levels (from 60 to 95) and to avoid carrying out potentially risky tests on healthy subjects during the breathing of an oxygen to air mix with low oxygen content. The in vitro arterial oxygen saturation values (SaO 2) values were obtained using an AVL-912 co-oximeter coupled to an AVL-995 blood gas analyzer (AVL). Thus we could also obtain for each patient the carboxyhemoglobin, methemoglobin, and sulfahemoglobin fractions and the total hemoglobin concentration from the AVL-912, as well as the oxygen partial pressure (pO 2), hydrogen ion concentration (reported as pH), and the carbon dioxide partial pressure (pCO 2) from the AVL-995.9 34 Prior to and after drawing of arterial blood, the patients remained seated for 10 min in order to obtain both arterial and noninvasive measurements in basal conditions. After that, the transmittance sensor of our system was attached to a right-hand finger of each patient (in most cases the index finger) and the photoplethysmographic signals for both wavelengths were recorded over at least 5 min. At the same time, a pulse oximeter (Pulsox-3i, AVL-Minolta) sensor was attached to a left-hand finger to record the oxygen saturation and heart rate values. This last-generation commercial pulse oximeter is based on the classical red-infrared LED emitters, and it was used for comparison of the oxygen saturation and heart rate values obtained with both pulse oximeters. The coincidence in the heart rate displayed by both instruments was considered an indicator of a proper fixation of the sensors. The PPG signals were processed using the above-described algorithm (Sec. 5). In the calibration study24 25 the cutoff frequencies for the processing were f1=0.25 Hz and f2=10 Hz. The q values were obtained every 2 s, and after a study of the spike noise of the PPG signals, we determined to reduce the histogram by 5 (10 points every 200). The average values of q for each subject were obtained for the timing intervals, which correspond to the stabilized condition. In Fig. 8 the average values of q for each subject (q av ) as a function of the arterial oxygen saturation values (SaO 2) are shown. Note that each SaO 2 value corresponds to a single determination from a single arterial blood sample, while q av is the average of several values obtained every 2 s over a time interval of 300 s. From q av and SaO 2 was derived an expression that allowed us to convert the q values obtained after the processing of the signals measured at both NIR wavelengths in the corresponding level of oxygen saturation. The relation between q and the level of oxygen saturation by pulse oximetry (SpO 2) was obtained through a nonlinear curve fit to a rational function using Microcal Origin facilities. This function is similar to expression (4) and has the form: In Fig. 8 this curve is shown as a dotted line. The q av values were converted to saturation values using expression (5) with the calibration coefficients a, b, and c. This enables us to compare the oxygen saturation values from the proposed NIR pulse oximetry system (SpO 2) with respect to the reference arterial blood oxygen saturation values (SaO 2). Figure 9(a) contains the SpO 2 values plotted as a function of SaO 2. Figure 9(b) contains the corresponding Bland and Altman plot35 36 and shows the differences in the NIR pulse oximetry average readings and the arterial oxygen saturation values (SaO 2), with the mean value (mean, dashed line) and two standard deviations (mean+2 SD and mean−2 SD, dotted lines) between the two data. For comparison, the results of the commercial pulse oximeter (Pulsox 3i) are presented in Fig. 10(a). The lower graphic shows a Bland and Altman plot35 36 of the differences in Pulsox 3i mean readings and the co-oximeter oxygen saturation values [Fig. 10(b)], with the mean value (mean, dashed line) and two standard deviations (mean+2 SD and mean−2 SD, dotted lines) of the differences between the two sources. This analysis gave a standard deviation of 3.1 for our system [Fig. 9(b)], a value that is very close to the 2.9 obtained for the commercial pulse oximeter [Fig. 10(b)].Figure 8The average values of q for each subject (q av ) as a function of the arterial oxygen saturation values (SaO 2) obtained from the co-oximeter. The dashed line results from the nonlinear fitting of q av versus SaO 2 to the rational function [Eq. (5)]. Note that each SaO 2 value corresponds to a single determination from a single arterial blood sample, while q av is the average of several values obtained over a time interval. 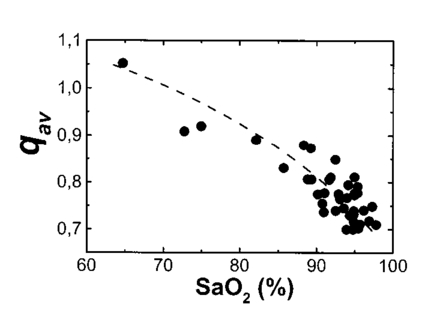 Figure 9(a) Oxygen saturation SpO 2 values from the NIR pulse oximetry system versus the arterial oxygen saturation obtained from the co-oximeter. (b) The corresponding Bland and Altman plot of the differences with the mean value (mean, dashed line) and two standard deviation values (mean+2 SD and mean−2 SD, dotted lines) between the two sources.  Figure 10(a) Mean values of SpO 2 obtained from the commercial pulse oximeter Pulsox versus the arterial oxygen saturation obtained from the co-oximeter (SaO 2). (b) The corresponding Bland and Altman plot of the differences with the mean value (mean, dashed line) and two standard deviation values (mean+2 SD and mean−2 SD, dotted lines) between the two sources. 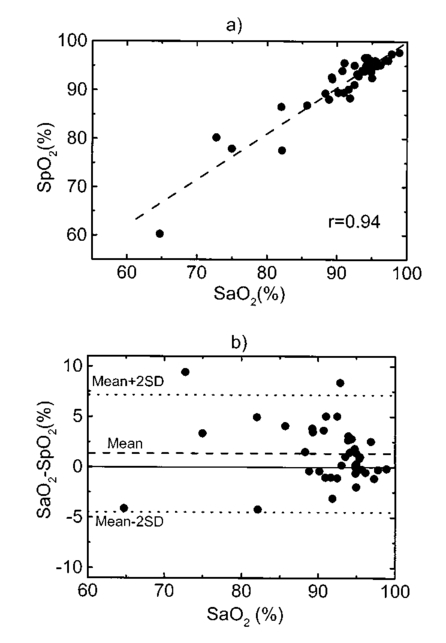 7.DiscussionClassical pulse oximetry relies on the assumption that no other hemoglobin derivatives which differ from HbO 2 and RHb are present in the blood, but in some cases other hemoglobin derivatives that have lost (temporarily or permanently) their oxygen-binding ability are also present. Carboxyhemoglobin (HbCO) is the most dangerous among dyshemoglobins, and is fairly common. Fifty percent of cigarette smokers have carboxyhemoglobin concentrations higher than 6, and those involved in accidental inhalation may have a much higher concentration.37 When carboxyhemoglobin is present in the blood, the pulse oximeter overreads the value of oxyhemoglobin.37 38 39 40 41 This failure has been attributed38 39 to the fact that at 660 nm the HbCO absorptivity (0.06 l⋅mmol−1⋅cm−1; Table 2) is as high as that of HbO 2 (0.08 l⋅mmol−1⋅cm−1; Table 2), while at 880 to 940 nm the HbCO absorptivity (0.01 to 0.00 l⋅mmol−1⋅cm−1; Table 2) is less than that of HbO 2 (0.28 to 0.29 l⋅mmol−1⋅cm−1; Table 2). One expected advantage of the 750 to 760-nm wavelength interval with respect to the classical “red” range (630 to 660 nm) is the small absorptivity of the carboxyhemoglobin (0.01 l⋅mmol−1⋅cm−1; Table 2) versus both HbO 2 (0.14 l⋅mmol−1⋅cm−1; Table 2) and RHb (0.39 l⋅mmol−1⋅cm−1; Table 2). Consequently, the error of the measured oxygen saturation value in the presence of such a hemoglobin derivative could be negligible if the “red” wavelength is substituted by one of 750 to 760 nm. On the other hand, theoretical and in vitro experimental studies42 indicated the feasibility of measuring the percent of SO 2 and carboxyhemoglobin with good precision and accuracy using three wavelength combinations, which included 630, 750, and 950 nm. Indeed, it is expected that the combination of measurements in three bands, such as 630 to 660 nm, 750 to 760 nm, and 850 to 940 nm could facilitate the detection of HbCO, if not its quantification. Table 2
The assumption in pulse oximetry about the equality of the optical path lengths for the red wavelengths (630 to 660 nm) and the classical infrared (800 to 940 nm) does not hold at low saturation values. It has been demonstrated for the case of reflectance that choosing two wavelengths closer to each other equalizes the penetration depth into a tissue and thus the sampling area.12 14 15 The results obtained from numerical simulation studies predicted that reflectance sensors fabricated with 735 to 760-nm and 890-nm emitters12 14 or with 730 to 770-nm and 880 to 910-nm combinations15 should be more accurate at low saturation, as in the case of fetal monitoring,13 than sensors made with conventional 660 and 900-nm band emitters. These results were confirmed by animal testing with a reflectance sensor based on 735 and 890-nm LEDs.43 The improved linearity of a 730 and 880-nm LED-based reflectance sensor in comparison with the 665 and 910-nm pair was evaluated in dogs and in healthy adult humans.14 This improvement of the pulse oximetry technique for low saturation values in the case of reflectance could be also valid, in some way, for the case of transmittance pulse oximetry. Nevertheless, the good performance of pulse oximeters at low saturation values also depends upon an appropriate calibration procedure because numerical modeling cannot replace the empirical calibration. During our experiments, the low number of measurements in low oxygen saturation conditions could not clarify this point. The wavelength pair of 750 and 850 nm, however, has lower sensitivity to SO 2 when it is compared with the 630 to 660 and 880 to 940-nm combinations because of the smaller differences between the HbO 2 and RHb absorptivity spectra in the range from 750 to 850 nm (see Table 2). Nevertheless, the larger difference in the RHb spectra with respect to the HbO 2 is observed in the 750 to 760-nm band, which justifies the use of the 750-nm emitter for the NIR region below the isobestic point at 800 nm (see Fig. 1). Above 800 nm, we used the 850 emitter, although the sensitivity to SO 2 could be improved by using a device with emissions in the range from 880 to 940 nm, where the differences between the HbO 2 and RHb absorptivities are larger (see Table 2), but also water interference increases.32 44 The use of a laser diode for the 750 to 760-nm wavelength band is justified by the need for a narrow emission and precise wavelength, owing to the pronounced changes and steep slope in the nonoxygenated hemoglobin extinction curve in this vicinity compared with that for oxyhemoglobin (Fig. 1). The precise wavelength and emission bandwidth used in the 850-nm range is of less concern because the extinction curves in this area are flatter, and any shift in the center wavelength causes a smaller error than would be generated by the same shift in the 750 to 760-nm band. The laser diodes have a narrow emission wavelength only a few nanometers in width, but the shape of the emission spectra as well as the peak wavelength is slightly temperature dependent. Avoidance of wavelength errors involves either temperature control of the laser diodes or measurement of the temperature with software compensation for the wavelength shift. It should be evaluated for a particular laser diode structure in regions like the 750 to 760-nm the magnitude of the error in pulse oximeter saturation readings as result of a laser diode wavelength shift associated with temperature variations. Taking into account the extinction characteristics of the hemoglobin derivatives18 19 20 to determine or quantify them by optical methods, it is necessary to carry out measurements at several wavelengths. The development of multiwavelength-specific systems for noninvasive measurement needs the use of narrow-emission bandwidths. Laser diodes exhibit narrow emissions and also have other advantages, such as their high external efficiency, and high-frequency modulation. High external efficiency and wavelength specificity imply less thermal effect on the tissues under analysis. It is also possible to minimize the thermal effects by activating the laser diodes with narrow-width pulses. In consequence, laser diodes constitute an interesting alternative for multiwavelength systems,45 despite their working conditions. Their use would be more justified if they were combined with other techniques based on such exclusive laser characteristics as coherence or high monochromaticity. Another advantage of NIR oximetry is the deeper penetration of near-infrared radiation, which makes it a candidate for an improved transmittance pulse oximeter sensor for measurements in pulsating beds thicker than normal fingertips or in the infant foot. From the point of view of the silicon photodiode’s detection capabilities, the 750 to 760-nm band corresponds to higher values compared with 630 to 660-nm wavelengths, and on the order of 850 nm. It permits us to optimize the amplification process because the detected photocurrents are of the same order. An extensive test and comparison of the histogram reduction method with the more classical peak-to-peak detection algorithm has not yet been completed. Nevertheless, the results in the oximeter application are quite positive, leading to a much more stable value for the q parameters and a good rejection of spike noise. The movement artifacts are still difficult to eliminate from the data. The fact that a part of the processing is carried out via software instead of hardware brings a higher degree of flexibility to the system. A new possibility is to use the same sensor and sensor electronics for different kinds of measurements in different places; for example, to measure the absolute saturation value in a pulsating bed or to record the relative variations in HbO 2 and RHb in a nonpulsating bed. Once the raw signals are acquired, the processing by software would correspond to the type of measurement. In conclusion, we have demonstrated that is possible to apply the proposed measurement system26 to pulse oximetry. Patients with respiratory failure were monitored as a part of the calibration procedure in order to cover a wide range of SO 2 values. A calibration curve has been derived through in vitro arterial SO 2 determination with a significant quantity of experimental points ranging from 60 to 95. The results obtained demonstrate the feasibility of using a sensor with laser diodes emitting at specific near-infrared wavelengths for transmittance pulse oximetry and that it is possible to use the proposed system to monitor a wide range of oxygen saturation levels, with other expected benefits, such as the lower carboxyhemoglobin interference. AcknowledgmentsThe authors would like to express their gratitude to Jose´ R. Sendra, Romano Giannetti, Dolores Golmayo, Fernando Briones, Pilar Martı´n, and J. L. Alvarez-Sala and to the personnel of the Pneumology Department of the Hospital Universitario San Carlos of Madrid. This work has been partially supported by the Spanish Comisio´n Interministerial de Ciencia Y Technologı´a project TIC98-1025. The author (SMLS) gratefully thanks Dr. Leonid Shvartsman (GA&P Technologies Ltd.) for fruitful discussions about pulse oximetry, and Prof. P. Ake O¨berg (Dept. of Biomedical Engineering of Linko¨ping University), Dr. Ilya Fine (OrSense), and Dr. Michael O’Neil (Nellcor/Tyco Healthcare International) for their interest in this study during the Photonic West 2001—BiOS 2001. SMLS is supported by Programa Ramo´n y Cajal from the Spanish Ministry of Science and Technology. The authors also acknowledge the editorial assistance of Dr. David Shea, translation lecturer at the University of Las Palmas de Gran Canaria, in preparation of the final manuscript. REFERENCES
I. Yoshiya
,
Y. Shimada
, and
K. Tanaka
,
“Spectrophotometric monitoring of arterial oxygen saturation in the fingertip,”
Med. Biol. Eng. Comput. , 18 27
–32
(1980). Google Scholar
J. A. Pologe
,
“Pulse oximetry: technical aspects of machine design,”
Int. Anesthesiol. Clin. , 25 137
–153
(1987). Google Scholar
Y. Mendelson
,
“Pulse oximetry: theory and applications for noninvasive monitoring,”
Clin. Chem. , 38 1601
–1607
(1992). Google Scholar
L. G. Lindberg
,
C. Lennmarken
, and
M. Vegfors
,
“Pulse oximetry—clinical implications and recent technical developments,”
Acta Anesthesiol. Scand. , 39 279
–287
(1995). Google Scholar
J. Pickett
,
P. Amoroso
,
D. V. Nield
, and
D. P. Jones
,
“Pulse oximetry and PPG measurements in plastic surgery,”
Proc. 19th Ann. Int. Conf. IEEE/EMBS , 5 2330
–2332
(1997). Google Scholar
S. Rhee
,
B. H. Yang
,
K. Chang
, and
H. H. Asada
,
“The ring sensor: a new ambulatory wearable sensor for twenty-four hour patient monitoring,”
Proc. 20th Ann. Int. Conf. IEEE/EMBS , 4 1906
–1909
(1998). Google Scholar
M. N. Vincenzi
,
H. Gombotz
,
H. Krenn
,
C. Dorn
, and
P. Rehark
,
“Transophageal versus surface pulse oximetry in intensive care unit patients,”
Crit. Care Med. , 28 2268
–2270
(2000). Google Scholar
M. J. Hayes
and
P. R. Smith
,
“A new method for pulse oximetry possessing inherent insensitivity to artifact,”
IEEE Trans. Biomed. Eng. , 48 452
–461
(2001). Google Scholar
P. D. Mannheimer
,
J. R. Casciani
,
M. E. Fein
, and
S. L. Nierlich
,
“Wavelength selection for low saturation pulse oximetry,”
IEEE Trans. Biomed. Eng. , 44 148
–158
(1997). Google Scholar
R. M. Lewinsky
and
I. Fine
,
“Antepartum fetal pulse oximetry,”
Eur. J. Obstet. Gynecol. Reprod. Biol. , 72 S81
–S85
(1997). Google Scholar
P. D. Mannheimer
,
M. E. Fein
, and
J. R. Casciani
,
“Physio-optical considerations in the design of fetal pulse oximetry,”
Eur. J. Obstet. Gynecol. Reprod. Biol. , 72 S9
–S19
(1997). Google Scholar
M. Nogawa
,
T. Kaiwa
, and
S. Takatani
,
“A novel hybrid reflectance pulse oximeter sensor with improved linearity and general applicability to various portions of the body,”
Proc. 20th Ann. Int. Conf. IEEE/EMBS , 4 1858
–1861
(1998). Google Scholar
F. F. Jo¨bsis
,
“Noninvasive, infrared monitoring of cerebral and myocardial oxygen sufficiency and circulatory parameters,”
Science (Washington, DC, U.S.) , 198 1264
–1267
(1977). Google Scholar
M. Ferrari
,
D. T. Delpy
, and
D. A. Benaron
,
“Special section editorial: near infrared spectroscopy and imaging of tissues,”
J. Biomed. Opt. , 1 361
(1996). Google Scholar
E. J. Van Kampen
and
W. G. Zijlstra
,
“Spectrophotometry of hemoglobin and hemoglobin derivatives,”
Adv. Clin. Chem. , 23 199
–257
(1983). Google Scholar
A. Zwart
,
E. J. Van Kampen
, and
W. G. Zijlstra
,
“Results of routine determination of clinically significant hemoglobin derivatives by multicomponent analysis,”
Clin. Chem. , 32 972
–978
(1986). Google Scholar
W. G. Zijlstra
,
A. Buursma
, and
W. P. Meeuwsen van der Roest
,
“Absorption spectra of human fetal and adult oxyhemoglobin, deoxyhemoglobin, carboxyhemoglobin and methemoglobin,”
Clin. Chem. , 37 1633
–1638
(1991). Google Scholar
S. M. Lo´pez Silva
,
R. Giannetti
,
M. L. Dotor
,
J. R. Sendra
,
J. P. Silveira
, and
F. Briones
,
“Application of NIR laser diodes to pulse oximetry,” in Biomedical Sensors, Fibers, and Optical Delivery Systems, Francesco Baldini, Nathan I. Croitoru, Ingemar Lundstro¨m, Mitsunobu Miyagi, Ricardo Pratesi, and Otto S. Wolfbeis, Eds.,”
Proc. SPIE , 3570 294
–302
(1998). Google Scholar
S. M. Lo´pez Silva
,
J. P. Silveira
,
J. R. Sendra
,
R. Giannetti
,
M. L. Dotor
, and
D. Golmayo
,
“NIR transmittance pulse oximetry system with laser diodes,”
80
–87
(2001). Google Scholar
W. G. Zijlstra
and
B. Oeseburg
,
“Definition and notation of hemoglobin saturation,”
IEEE Trans. Biomed. Eng. , 36 872
(1989). Google Scholar
J. M. Schmitt
,
“Simple photon diffusion analysis of the effects of multiple scattering on pulse oximetry,”
IEEE Trans. Biomed. Eng. , 38 1194
–1203
(1991). Google Scholar
D. R. Marble
,
D. H. Burns
, and
P. W. Cheung
,
“Diffusion-based model of pulse oximetry: In vitro and vivo comparisons,”
Appl. Opt. , 33 1279
–1285
(1994). Google Scholar
Y. Shimada
,
I. Yoshiya
,
N. Oka
, and
K. Hamaguri
,
“Effects of multiple scattering and peripheral circulation on arterial oxygen saturation measured with a pulse-type oximeter on the fingertip,”
Med. Biol. Eng. Comput. , 22 475
–478
(1984). Google Scholar
J. P. De Kock,
“Pulse oximetry: theoretical and experimental models,,”
UK
(1991). Google Scholar
Y. Mendelson
and
J. C. Kent
,
“Variations in optical absorption spectra of adult and fetal hemoglobin and its effects on pulse oximetry,”
IEEE Trans. Biomed. Eng. , 36 844
–848
(1989). Google Scholar
D. G. Altman
and
J. M. Bland
,
“Measurements in medicine: the analysis of method comparison studies,”
Statistician , 32 307
–317
(1983). Google Scholar
J. M. Bland
and
D. G. Altman
,
“Statistical methods for assessing agreement between two methods of clinical measures,”
Lancet , 1 307
–311
(1986). Google Scholar
J. T. B. Moyle
,
“Uses and abuses of pulse oximetry,”
Arch. Dis. Child. , 74 77
–80
(1996). Google Scholar
K. K. Tremper
and
S. J. Barker
,
“Pulse oximetry,”
Anesthesiology , 70 98
–108
(1989). Google Scholar
Y. Mendelson
and
J. C. Kent
,
“An in vitro tissue model for evaluating the effect of carboxyhemoglobin concentration on pulse,”
IEEE Trans. Biomed. Eng. , 36 625
–627
(1989). Google Scholar
N. B. Hampson
,
“Pulse oximetry in severe carbon monoxide poisoning,”
Chest , 114 1036
–1041
(1998). Google Scholar
W. W. Lee
,
K. Mayberry
,
R. Crapo
, and
R. L. Jensen
,
“The accuracy of pulse oximetry in the emergency department,”
Am. J. Emerg. Med. , 18 427
–431
(2000). Google Scholar
J. C. S. Lee
,
P. W. Cheung
,
D. R. Marble
,
M. A. Kenny
, and
D. Landicho
,
“Simultaneous measurement of percent carboxyhemoglobin and functional oxygen saturation,”
Proc. Ann. Int. Conf. IEEE/EMBS , 4 1092
–1093
(1989). Google Scholar
R. Nijland
,
H. W. Jongsma
, and
J. G. Nijhuis
,
“Reflectance pulse oximetry (RPOX): Two sensors compared in piglets,”
Am. J. Obstet Gynecol. , 172 365
(1997). Google Scholar
G. M. Hale
and
M. R. Querry
,
“Optical constants of water in the 200 nm to 200 μm wavelength region,”
Appl. Opt. , 12 555
–563
(1973). Google Scholar
B. Manzke
,
J. Schwider
,
N. Lutter
,
K. Ehgelhardt
, and
W. Stork
,
“Multiwavelength pulse oximetry in the measurement of hemoglobin fractions,” in Biomedical Sensing and Tracking Technologies I, Robert A. Lieberman, Halina Pobdielska, and Tuan Vo-Dinh, Eds.,”
Proc. SPIE , 2676 332
–340
(1996). Google Scholar
|
||||||||||||||||||||||||||||||||||||||||||||||||||||||||||||||||||||||||||||||||||||||||||||||


CITATIONS
Cited by 32 scholarly publications and 88 patents.
Oximetry
Sensors
Semiconductor lasers
Oxygen
Rhodamine B
Oximeters
Linear filtering


