1.IntroductionOptical coherence tomography (OCT) is a noninvasive imaging technique that generates high-resolution cross-sectional images of biological tissue.1 2 3 Based on low-coherence interferometry, the technique measures spatially resolved backscattered intensity in transparent and scattering samples. The development of polarization-sensitive (PS) OCT takes advantage of the additional polarization information carried by the reflected light.4 PS-OCT can reveal important information about biological tissue, such as the quantitative distribution of birefringence, which is unavailable in conventional OCT. Birefringence occurs in various biological components, especially in fibrous tissues (muscle, tendon, corneal stroma, retinal nerve fiber layer) and in dental enamel. Several reports on PS-OCT have demonstrated its ability to measure and image birefringence distribution in different tissues.5 6 7 8 While early work on PS-OCT measured only reflectivity and retardation of a sample, in recent years many proposals have been made to extract more information on the polarization properties of a sample. These improved techniques were used to measure and image Stokes vectors of the backscattered light9 10 and distribution of Mu¨ller11 and Jones matrices12 in biological samples. Among the suggested medical applications of PS-OCT are estimation of burn depth,13 diagnosis of caries,7 and measurement of the thickness of the retinal nerve fiber layer for early detection of glaucoma.14 15 While Mu¨ller and Jones matrices contain the maximum possible information on the polarizing properties of a sample, the images of Mu¨ller matrix and Jones matrix elements are difficult to interpret. Furthermore, the measurement of these matrices requires either several measurements with different input and analyzer polarization states11 or the use of two light sources illuminating the sample with different input polarization states simultaneously,12 which makes the measurement more time-consuming or the instrument more complex. An important parameter of birefringence with straightforward physical interpretation is the slow birefringent axis of a sample. In fibrous tissues where birefringence is caused by form birefringence, this parameter is a measure of the fiber orientation. If the traditional PS-OCT setup first devised by Hee et al.;4 is used, a careful analysis of the polarization states by the Jones calculus reveals that the slow axis orientation is entirely encoded in the phase difference between the interferometric signals recorded in two orthogonal polarization channels.5 6 16 Extraction of the slow axis orientation, therefore, requires a two-channel, polarization-sensitive PS-OCT system that is phase sensitive, i.e., that records the full interferometric signal and not only its envelope. This method allows the determination of three parameters simultaneously; reflectivity, retardation, and slow axis orientation can be determined with only one A-scan per measurement location. Recently, a first application of this method to map the transversal distribution of axis orientation in muscle tissue was reported.16 (It should be mentioned that similar information can be extracted from the Stokes vectors of backscattered light).9 A biological tissue of great interest for PS-OCT imaging is the human cornea. It has long been known that the cornea is optically birefringent, and several papers on corneal birefringence have been published; for an overview, see Ref. 17. Different models on the nature of corneal birefringence have been reported that are partly contradictory; e.g., the cornea was modeled as a uniaxial18 and a biaxial crystal.19 The present state of knowledge on corneal structure and its relation to birefringence can be summarized as follows: The corneal tissue is arranged in several layers. More than 90 of its thickness is made up by the stroma, which consists of approximately 200 lamellae with a thickness of 1.5 to 2.5 μm. Each of these lamellae is composed of parallel collagen fibrils embedded in an optically homogeneous ground substance.20 21 For modeling the cornea’s birefringence, each lamella is regarded as a birefringent plate, with its slow axis lying along the direction of the collagen fibrils.22 The fibrils in successive lamellae are usually oriented at large, approximately orthogonal angles to each other, so that the birefringence properties of successive lamellae largely cancel each other. X-ray studies have revealed two preferred directions of orientation in the cornea. Sixty percent of the fibrils are oriented within the 45-deg sectors around the inferior-superior and nasal-temporal preferred directions, while 40 are oriented in the oblique sectors in between.23 24 A slight prevalence of one lamella orientation causes a net retardation and a net optic axis orientation. Several techniques of ophthalmic imaging use polarized light in one or another way. Scanning laser polarimetry25 should be especially mentioned in this context. This technique, which is used for diagnosing glaucoma, measures and images the distribution of birefringence of the retinal nerve fiber layer through the cornea. Reliable results therefore require a precise knowledge of corneal retardation and slow axis orientation.26 While initially a fixed retardation and axis orientation was assumed for the entire population, a comprehensive study has shown that these parameters vary considerably in individual subjects.27 The majority of studies on corneal birefringence performed measurements only in the central cornea. However, some studies also reported on the distribution of birefringence in the cornea.19 28 29 30 The results of these studies are somewhat contradictory. While Van Blokland and Verhelst19 report a saddleback distribution of corneal birefringence, Bour and Lopez Cardozo28 and Bueno and Vargas-Martin29 observed an increase in retardation with distance from the corneal apex in all radial directions. The results on slow axis distribution were also contradictory.29 30 This study is investigating human corneal birefringence in vitro by PS-OCT, a method not yet used for this purpose (except for a preliminary study on retardation in rabbit corneas22). This independent method will be used to shed more light on the somewhat contradictory results of previous studies. We present the method and subsequently use it to obtain 3-D datasets of the distribution of retardation and (cumulative) slow axis orientating. From these datasets we derive cross-sectional PS-OCT images and, for the first time, en face OCT images demonstrating the distribution of retardation and slow axis orientation at the posterior corneal surface. Finally, we discuss the results and explain them by a birefringence model based on stromal lamella stacks. 2.Materials and MethodsOur phase-sensitive PS-OCT technique to image reflectivity, retardation, and axis distribution simultaneously is described in detail elsewhere.16 Here we provide a brief summary, together with a description of the changes made to the previous setup. Figure 1 shows a sketch of the instrument. The optical setup is based on the original PS low-coherence interferometer first described by Hee et al.;4 Light from a superluminescent diode (SLD) with a center wavelength of 828 nm and a bandwidth of 22.4 nm, corresponding to a roundtrip coherence length lc=13.5 μm, is vertically polarized and illuminates a Michelson interferometer, where it is split by a nonpolarizing beamsplitter (NPBS) in a sample beam and a reference beam. The reference beam transmits a quarter-wave plate, oriented with its fast axis at 22.5 deg to the horizontal, and is reflected by a retroreflector and the reference mirror. After backpropagating through the quarter-wave plate, the orientation of the beam polarization plane is at 45 deg to the horizontal, providing equal reference power in two orthogonal polarization states. The quarter-wave plate in the sample arm is oriented at 45 deg to provide circularly polarized light to the sample. After reflection at the sample and propagating back through the quarter-wave plate, the light in the sample arm is in an elliptical polarization state, containing information on retardation and axis orientation of the sample. After recombination with the reference beam at the interferometer beamsplitter, both beam components are directed toward a polarization-sensitive two-channel detection unit. Figure 1Sketch of PS-OCT setup. Ch.1,2; detection channels 1 and 2; NPBS, nonpolarizing beamsplitter; PBS, polarizing beamsplitter; Pol, polarizer; PS detection, polarization-sensitive detection; Retro, retroreflector; RM, reference mirror; SLD, superluminescent diode; λ/4; quarter-wave plate. 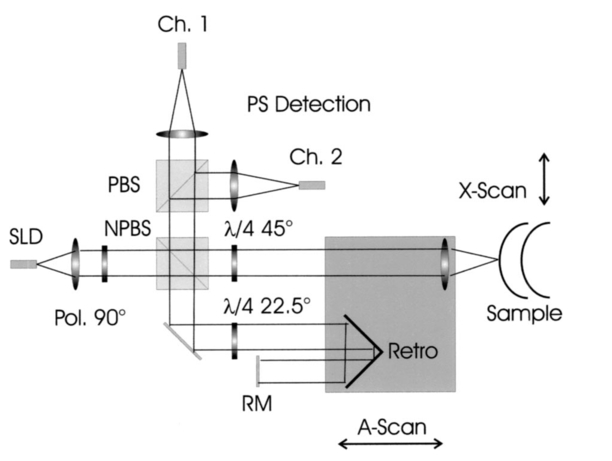 Three-dimensional datasets are obtained by recording A-scans (z) on a two-dimensional (x-y) lateral matrix on the sample. A-scans are recorded by shifting the retroreflector; a focusing lens mounted on the same translation table ensures dynamic focusing (matching of coherence gate and focal point in the sample).31 Contrary to standard OCT and earlier versions of PS-OCT, not just the envelopes of the interferometric signals are recorded. Instead, for each detection channel, an independent detector–amplifier–AD-converter combination records the whole interference signal IH,V(z) (H, V; horizontal and vertical polarization channel, respectively). The axial resolution is equal to the roundtrip coherence length lc. In our case, the transversal resolution is determined by the step increments in the transverse direction (100 μm). A 3-D dataset consists of 80×80 A-scans, each of 2.5-mm length. Sample reflectivity and birefringence information are derived from the interferometric signals IH,V recorded in the horizontal and vertical polarization channels, as previously reported.16 At first, complex functions A˜H,V(z) are obtained by analytical continuation of the measured signals using an algorithm based on a Hilbert transform H 32 33: where AH,V(z) are the interferometric signal envelopes in the horizontal and vertical channels, as a function of sample depth z, and ϕH,V(z) are the corresponding phase values. From these values, sample reflectivity R, retardation δ, and slow axis orientation Θ are calculated by and with Δϕ(z)=ϕH(z)−ϕV(z). On OCT tomograms, the backscattered signal intensity is displayed on a logarithmic false color scale and δ and Θ are displayed on linear false color scales. The unambiguous ranges of δ and Θ determination are 0 to 90 deg and 0 to 180 deg, respectively. It should be pointed out that the interpretation of the slow axis data requires some care: (1) The algorithm used to calculate Θ causes a 90 deg change in Θ at depth positions z where δ crosses 90 deg (or multiples of 90-deg). (2) If several layers with different slow axes are stacked on top of each other, the measured value Θ(z), at a given depth position z, is a cumulative, or effective, axis. It is the slow axis of a single layered birefringent plate that would give rise to the same change of polarization state as the multilayered sample does up to a depth z. Differentiating the axis orientations of individual layers would require (1) that these individual layers be resolved, i.e., be thicker than the coherence length, and (2) the using of an algorithm based on the information obtained on the overlying layers and propagating the polarization state from layer to layer.We have previously shown that imperfect polarizing properties of the optical elements used in a PS-OCT system cause a systematic (approximately constant) error of the measured axis.16 To calibrate our instrument, we measured the axis offset in the case of a retardation plate of known retardation and axis orientation. The measured axis orientation was corrected by subtracting that offset value. Human donor corneas were received from the eye bank (Department of Ophthalmology, General Hospital, University of Vienna). Only hepatitis B-positive corneas, which could not be used for transplantation and would have otherwise been discarded, were used in this study. Full-thickness corneal transplants were stored in Optisol (Chiron, California) and imaged by PS-OCT within 2 weeks after enucleation. The corneas had been extracted with a small scleral ring still attached, which ensured sufficient stability during handling and measurement. For PS-OCT imaging, the corneas were mounted in a specimen holder consisting of a metal case sealed with a glass window through which imaging was performed. The metal case was filled with Optisol to prevent dehydration during the imaging. 3.ResultsWe measured three-dimensional datasets of in vitro human corneas; 80×80 A-scans in x and y directions, with a depth of 2.5 mm, were recorded. The step width in both directions was 100 μm (i.e., a transversal area of 8×8 mm was covered). The depth resolution was 13.5 μm. Figures 2 and 3 show cross-sectional images of x-z - and y-z -planes derived from the three-dimensional dataset through the center (apex) of the cornea (horizontal section, Fig. 2) and about 1.5 mm off the apex (vertical section, Fig. 3), respectively. Figure 2(a) and Fig. 3(a) show intensity images (logarithmic color scale). Figure 2(b) and Fig. 3(b) show retardation images (linear color scale). The parts of the image shown in gray correspond to regions where the signal intensity is not significantly above the noise level (in this case, a reliable calculation of retardation and axis values is not possible6). The retardation increases in the radial direction. Toward the periphery, the retardation increases with depth. At the margin of the images, about 4 mm from the corneal apex, the color indicating retardation makes about one full oscillation from blue at the anterior corneal surface over red to blue again at the posterior surface, indicating a retardation of about 180 deg over the full corneal thickness at the periphery. Figure 2(c) and Fig. 3(c) show the slow axis distribution across the cornea (linear color scale). The cumulative slow axis varies in the radial direction, but is roughly constant over the corneal thickness at a given transversal position (except for the 90 deg color change caused by the algorithm at positions where δ>90 deg). Figure 2Horizontal cross-sectional OCT images of human cornea in vitro. Axis labels: (optical) distances in millimeter. (a) Reflectivity image (logarithmic color scale). (b) Retardation image (linear color scale, degrees). (c) Slow axis orientation image (linear color scale, degrees).  Figure 3Vertical cross-sectional OCT images of human cornea in vitro. Axis labels: (optical) distances in millimeter. (a) Reflectivity image (logarithmic color scale). (b) Retardation image (linear color scale, degrees). (c) Slow axis orientation image (linear color scale, degrees).  Figure 4 shows en face PS-OCT images derived from the same 3-D dataset of the same cornea. The distribution of retardation [Fig. 4(a)] and of the slow axis orientation [Fig. 4(b)] corresponding to the back surface of the cornea are shown (the posterior surface was approximated by a polynomial fit to the interface as measured from the OCT reflectivity dataset). The red lines in Fig. 4 indicate the positions corresponding to the two sectional tomograms of Fig. 2 and Fig. 3. Figure 4(a) shows that the retardation is lowest in the center and increases in the radial direction. Figure 4(b) indicates that the slow axis orientation varies approximately linearly with azimuth angle. Along the positive y-axis, Θ≅0 deg; Θ increases in a clockwise direction, to about 90 deg along the positive x-axis, and further to about +180 deg near the negative y-axis. Owing to the π ambiguity of the algorithm used, the axis orientation can only be mapped from 0 to 180 deg. Because of the earlier mentioned 90-deg color jumps in Θ at positions where δ>90 deg, the overall image pattern of approximately constant Θ at a given azimuth angle is disturbed at the periphery. For a better, undisturbed view of the slow axis orientation pattern, we derived an additional en face image of slow axis orientation that corresponds to a position in the middle of the cornea, about halfway between the anterior and posterior corneal surface. This image is shown in Fig. 4(c). Since δ<90 deg in this depth throughout the cornea, the axis distribution pattern is undisturbed. A comparison of Figs. 4(b) and 4(c) further indicates that the axis orientation is roughly constant in depth. Figure 4En face OCT images of human cornea in vitro. Axis labels: distances in millimeter. (a) Retardation distribution at posterior corneal surface (linear color scale, degrees); horizontal and vertical red lines indicate positions of cross-sectional images in Fig. 2 and Fig. 3, respectively. (b) Cumulative slow axis distribution at posterior corneal surface (linear color scale, degrees). (c) Cumulative slow axis distribution approximately halfway between anterior and posterior corneal surfaces (linear color scale, degrees).  We recorded PS-OCT datasets in a similar way in five donor corneas. The results were essentially similar to those observed in Figs. 2 to 4. Central corneal retardation (at the posterior surface) ranged from 13 to 30 deg. Although slow axis orientations within the total interval 0 to 180 deg are observed, they are not evenly distributed. Figure 5 shows a histogram of the distribution of slow axis orientation of one of the five corneas which clearly illustrates this feature. There is a frequency maximum for axis values near 0 and 180 deg, and a minimum for values near 90 deg. It should be mentioned that Fig. 5 indicates that there is an overall preferential orientation of the slow axis within the cornea; since the excised corneas were not marked, the absolute orientation of the axis with respect to the horizontal meridian of the intact eye is not available. Figure 5Histogram of slow axis distribution in human cornea in vitro. Plot of frequency of observed slow axis (ordinate) versus slow axis orientation (abscissa, degrees).  To check whether our findings (lowest retardation at the apex; slow axis orientation increasing with azimuth angle, with the rotation center at the apex) can be interpreted to show that the corneal apex is a center of symmetry (as far as birefringence is regarded), or whether the results simply depend on the angle of incidence of the sample beam, we repeated the measurements with a cornea tilted by about 30 deg about the y-axis. Figure 6 shows the results. Figure 6(a) shows elevation data; the position of the anterior corneal surface is indicated on a linear false color scale. The areas nearest to the instrument are shown in red. The center of this area, at which the plane tangential to the cornea is perpendicular to the incident sample beam, is shifted to the right. [Owing to the limited depth range of our setup (∼2.5 mm), this topmost part of the cornea is truncated, i.e., it is not within the range of the depth scan; this caused the somewhat grainy shape of the corresponding image area; the orange color at the leftmost image area is an artifact of the dataset]. Figure 6En face OCT images of human cornea in vitro. Cornea tilted about 30 deg about the y-axis. Axis labels: distances in millimeter. (a) Elevation map of anterior corneal surface; red colors indicate positions closest to instrument (linear color scale, elevation in millimeter). (b) Retardation distribution at posterior corneal surface (linear color scale, degrees). (c) Cumulative slow axis distribution at posterior corneal surface (linear color scale degrees). 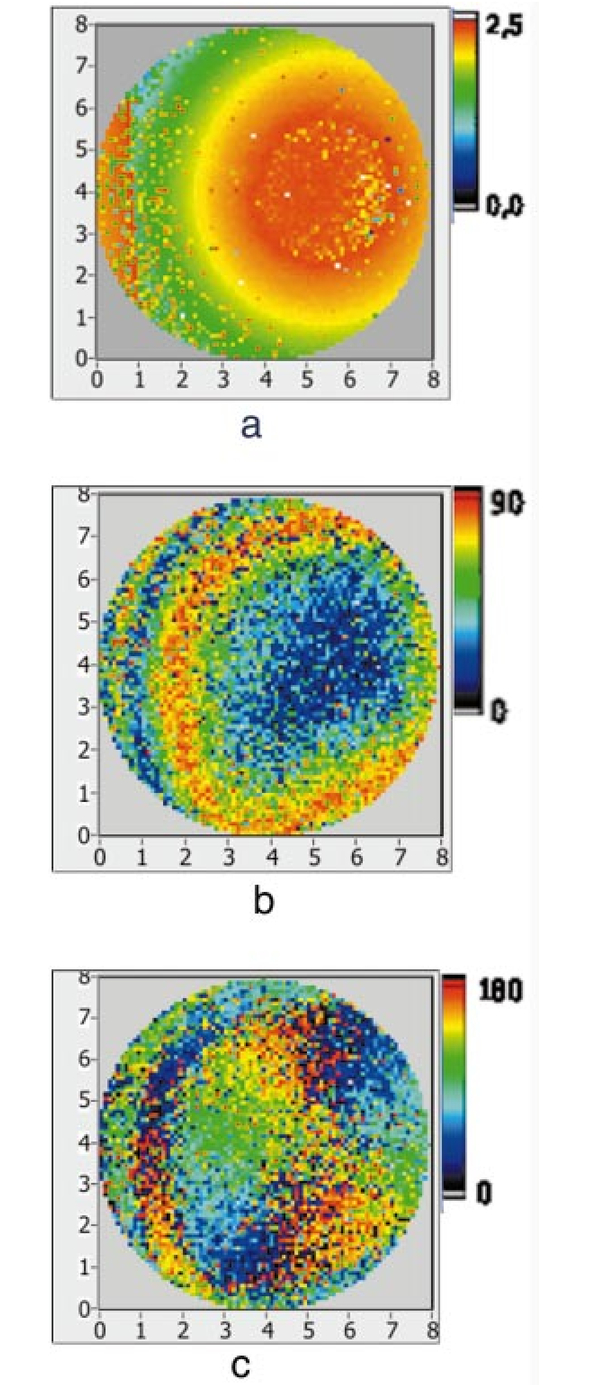 Figure 6(b) shows the corresponding en face retardation map derived at the posterior corneal surface. The area of lowest retardation is clearly shifted to the point of highest elevation, indicating that retardation is lowest at a perpendicular sample beam incidence, not at the apex in the case of the tilted cornea. Toward the left side of the image, where the apex is located, strong birefringence is observed (at the left rim of the image, the retardation corresponds to nearly two full oscillations, or almost 360 deg). Figure 6(c) shows an en face image of (cumulative) slow axis orientation at the posterior corneal surface. The point of rotation, about which the slow axis increases with azimuth angle, is also shifted to the point of highest elevation. (It should be mentioned that cross-sectional tomograms of the inclined cornea are somewhat inconsistent. For most parts of the cornea, there is an increase in retardation with depth, as expected. However, directly beneath the truncated area, the cornea seems to show increased retardation, which, however, vanishes as the posterior surface is approached. Further experiments will have to clarify whether this effect really exists or if this is just an artifact.) Our results on optic axis distribution in the cornea are in contradiction to previously reported results obtained in vivo with a liquid-crystal imaging polarimeter29 (see Sec. 5). To clarify this discrepancy, we decided to repeat the experiments reported in Ref. 29 in a simplified form. We used the same SLD as in our PS-OCT experiments as a light source. The beam was expanded to about an 8-mm diameter and passed through a polarizer that rendered the beam in a vertical linear polarization state. This beam transmitted the cornea (placed in a specimen holder similar to that used for PS-OCT, but with an additional glass window at the posterior side to enable transillumination), and subsequently a liquid-crystal retarder (fast axis oriented at 45 deg) and a second polarizer (vertical). Finally, a lens was used to image the cornea onto a CCD camera (256×256 pixels). The main difference from the experiment in Ref. 29 is that we measured the cornea in a directly transmitted beam (i.e., in single pass), and avoided using the iris reflection. Three images of the intensity distribution at the CCD camera were recorded with different retardation values set at the liquid-crystal retarder. Equations (7) to (9) of Ref. 29 were used to calculate the distribution of the (fast) axis orientation at the posterior surface of the cornea. Figure 7(a) shows the result. Owing to speckle noise and an algorithm sensitive to divisions by zero, only a qualitative impression of the axis distribution can be obtained. However, it is evident that the optic axis is not constant across the cornea. The axis orientation changes with azimuth angle (the angle is oriented in relation to that of the liquid-crystal retarder, i.e., there is a 45-deg offset). The algorithm has a π/2 ambiguity, so the angle can only be mapped within 90 deg. Figure 7(b) shows a simulation of the expected axis distribution image under the assumption that the corneal retardation increases proportionally to the square of the distance from the apex to the measurement position and that the axis orientation increases linearly with azimuth angle. The agreement between measured and simulated image is good over most parts of the cornea (at the periphery of the image the light intensity was too low to obtain reliable data). This result is in good agreement with our PS-OCT data and in contradiction to Ref. 29. 5.DiscussionThe results of our measurements on corneal birefringence by PS-OCT can be summarized as follows: Corneal retardation is low for beams incident approximately perpendicular to the corneal surface. At oblique angles, the measured birefringence increases with deviation from the perpendicular incidence. In the case of illumination of the cornea with beams parallel to the vision axis, as used in the experiments corresponding to Figs. 2 to 5, this yields a circularly symmetric retardation pattern in which retardation is lowest near the apex and increases toward the periphery. The cumulative slow axis orientation at a given lateral position is roughly constant with depth. With the illumination scheme parallel to the vision axis, the slow optic axis is not constant across the cornea, but is oriented approximately tangentially along circles that are centered at the apex. In terms of inclination of the corneal surface, the slow axis is perpendicular to a plane made by the incident beam and a vector perpendicular to the corneal surface. A slight preferential slow axis orientation is laid over this general pattern. These results can be explained by a birefringence model based on a stack of thin birefringent lamellae with two preferential, nearly orthogonal, fibril orientations, superimposed on a background of lamellae with random orientation.23 24 To explain our results, we use the sketch in Fig. 8, which shows a section along the horizontal meridian through a thin stromal layer composed of two lamellae with orthogonal fibril orientation, stacked on top of each other (the full-thickness stroma consists of about 200 such lamellae). Two incident beam positions are indicated. If the beam illuminates the cornea at the apex (A), it transmits both lamellae perpendicular to their fibrils. The first lamella has its slow axis orthogonal to the drawing plane, the second one parallel to that plane. The opposite birefringence effects cancel each other, and net retardation is zero. Beam B illuminates the cornea at the periphery. The beam is still perpendicular to the fibrils of the first lamella, but not to those of the second one, which have, owing to the corneal curvature, a component parallel to the incident beam. Since only those fibril components that are oriented perpendicular to the incident beam contribute to the birefringence encountered by the beam, the cancellation of the birefringence effects of the two layers will be incomplete at the periphery and a net birefringence will be observed. At increasing distance from the center, the fibrils in the second layer bend more toward the direction of the incident beam; therefore their vectorial component perpendicular to the beam decreases and the net birefringence observed increases with distance from the center. The observed net slow axis orientation will be parallel to the fibrils of the first layer (its birefringence dominates off the center, as mentioned earlier), i.e., orthogonal to the plane made by the incident beam and the corneal surface vector, which is in agreement with our observations. Figure 8Sketch of two stromal lamellae with fibril orientation perpendicular (upper layer) and parallel (lower layer) to the drawing plane. See text. 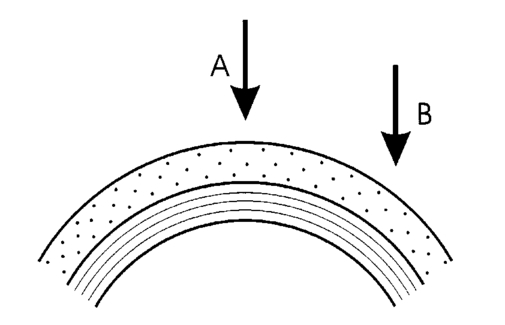 The corneal stroma consists of about 200 lamellae, about two-thirds of which are oriented similarly to those shown in Fig. 8. The remaining third is roughly randomly oriented, so the whole corneal stroma should have a birefringence behavior essentially similar to that discussed earlier. A slight prevalence of one lamella orientation gives rise to a net retardation and axis orientation, even in the center of the cornea.26 27 Since the stromal lamellae have a thickness of about 2 μm, and the coherence length of our SLD is about 10 μm (in the tissue), the individual lamellae cannot be resolved, and only a cumulative net birefringence is observed. The birefringence model so far was explained for a horizontal section across the center of the cornea, where we took advantage of the fact that the fibrils in the corneal lamellae have preferential orientations in horizontal and vertical directions. However, the model should be generally valid, which can be seen by considering that a fibril of any orientation can be vectorially decomposed in tangential and radial components. While the tangential components will always be perpendicular to the incident beam, the radial components will bend more and more toward the direction of the incident beam as the corneal periphery is approached. If we compare our results with the published data on human corneal birefringence, we find similarities but also deviations. The majority of studies performed so far measured retardation and axis orientation only at single points, typically near the center of the cornea. A recent comprehensive study performed in both eyes of 73 normal subjects reported a wide variation in retardance, ranging from 0 to 95 nm (single pass) at a wavelength of 585 nm; the mean value was approximately 50 nm.27 Our central retardance values range from 13 to 30 deg or 30 to 69 nm (at a wavelength of 828 nm) and are therefore well within the reported range. The slow optic axis is reported to have a preferential orientation of typically 20 deg nasally downward, but also with large interindividual variability.27 Our results indicate that the slow axis orientation varies across the corneal surface. A comparison with a measurement at a single point is difficult. However, if averaged over a larger area, we find that there is a prevalence of one slow axis orientation, which might be called a net slow axis of the cornea. Since the excised corneas were not marked, we do not know the absolute orientation of the net slow axis. Some of the previously reported studies also measured retardation as a function of lateral position across the cornea.19 28 29 Van Blokland and Verhelst19 reported a retardation distribution of a saddleback shape, i.e., an increase in retardation from the center toward the periphery along a vertically oriented meridian, while retardation decreased toward the periphery along the horizontal meridian. This is in contradiction to our results and those reported by Bour and Lopez Cardozo28 and Bueno and Vargas-Martin,29 who also found an increase in retardation toward the periphery, independent of the meridian orientation. The discrepancy might be explained by the fact that Van Blokland and Verhelst used light reflected at the retina for their measurements, which might have changed the polarization state. Two previous studies measured the distribution of the optic axis across the cornea.29 30 Bueno and Vargas-Martin29 used a liquid-crystal imaging polariscope to measure birefringence in human corneas in vivo. They illuminated the eye with a collimated light beam and used light reflected at the iris to measure the distribution of retardation and axis orientation in the cornea. Because the iris reflection was used, the central part of the cornea could not be measured. They found that the axis was approximately constant across the cornea. The latter result is in contradiction to our findings. Jaronski and Kasprzak30 used a phase-stepping imaging polarimeter to measure birefringence in a human cornea in vitro. In Fig. 5(a) of their paper, a nonuniform axis distribution with an axis orientation increasing with azimuth angle in large parts of the cornea can be observed. Although the situation is not so clear in the center of the cornea, and the authors do not further comment or interpret this image, we think there is a general agreement with our results. To clarify the contradictory results of Ref. 29 on the one hand, and our results and that of Ref. 30 on the other, we repeated the experiment of Ref. 29 with a simplified setup in an in vitro cornea (cf. Fig. 7). The result is in good qualitative agreement with a varying optic axis oriented in a tangential pattern around the apex [cf. the simulated image in Fig. 7(b)]. This is in agreement with our PS-OCT results and that of Ref. 30. The deviation from the results reported in Ref. 29 is not easy to explain. On the one hand, the results of the experiments leading to Fig. 7(a) suffered from speckle noise, in spite of using only a single transmission and no reflection at the iris. The speckle noise disturbs the overall pattern and allows only a qualitative comparison with the simulated image [Fig. 7(b)]. We expect that this speckle noise is much more pronounced if a beam reflected at the rough iris surface is used. This might severely degrade the resulting intensity images from which retardation and axis orientation are to be derived by a complicated equation sensitive to divisions by zero. On the other hand, the iris itself has an ordered structure that has some circular symmetry. This structure might change the polarization state of the backscattered beam in a way that makes it unreliable for subsequently determining corneal birefringence. The results of our study might have some implications for the use of ophthalmic diagnostic instruments operating with polarized light. In particular, scanning laser polarimetry (SLP) of the retinal nerve fiber layer requires that the corneal birefringence be compensated for. The first generation of these instruments assumed a fixed corneal retardation for the entire population. Since this assumption is not true,27 the newest generation of SLP instruments has a variable corneal compensator capable of compensating each cornea individually. This can considerably improve the reliability of the SLP as a glaucoma detection device.26 Our results indicate that even within a single cornea, the optic axis orientation varies. However, the geometry of the light path of the SLP is different from that used in our study. An SLP illuminates the eye, not parallel to the vision axis, but with a tilting beam that has its pivot point near the nodal point of the eye. In this case the incident beam remains close to a perpendicular orientation to the corneal surface over the transversal scanning range. Therefore we assume that the sampling beam of the SLP encounters essentially the net retardance and optic axis orientation that we measured near the center of the cornea. However, the beam diameter should not be too large, otherwise different parts of the scanning beam (across the diameter) would encounter different corneal birefringence, and the compensation might be incomplete. In the case of corneal pathologies, such as keratoconus, the situation might be completely different. X-ray diffraction studies have shown that fibril orientation patterns change considerably in this disease.24 Preliminary PS-OCT experiments carried out in keratoconus and corneal scar tissues indicate that the birefringence patterns observed in Figs. 2 to 5 are dramatically changed. A future study will investigate the potential of PS-OCT to diagnose corneal pathologies based on degeneration of stromal structure. The results of that study might shed more light on the role of collagen fibril orientation in corneal disease. AcknowledgmentsThe authors wish to thank Mr. H. Sattmann and Mr. L. Schachinger for technical assistance, and Ms. R. Amon for providing the extracted corneas. Financial assistance from the Austrian Fonds zur Fo¨rderung der wissenschaftlichen Forschung (grant P14103-MED) is acknowledged. REFERENCES
D. Huang
,
E. A. Swanson
,
C. P. Lin
,
J. S. Schuman
,
W. G. Stinson
,
W. Chang
,
M. R. Hee
,
T. Flotte
,
K. Gregory
,
C. A. Puliafito
, and
J. G. Fujimoto
,
“Optical coherence tomography,”
Science , 254 1178
–1181
(1991). Google Scholar
A. F. Fercher
and
C. K. Hitzenberger
,
“Optical coherence tomography,”
Prog. Opt. , 44 215
–302
(2002). Google Scholar
M. R. Hee
,
D. Huang
,
E. A. Swanson
, and
J. G. Fujimoto
,
“Polarization sensitive low coherence reflectometer for birefringence characterization and ranging,”
J. Opt. Soc. Am. B , 9 903
–908
(1992). Google Scholar
J. F. de Boer
,
T. E. Milner
,
M. J. C. Van Gemert
, and
J. S. Nelson
,
“Two-dimensional birefringence imaging in biological tissue by polarization-sensitive optical coherence tomography,”
Opt. Lett. , 22 934
–936
(1997). Google Scholar
M. J. Everett
,
K. Schoenenberger
,
B. W. Colston Jr.,
and
L. B. Da Silva
,
“Birefringence characterization of biological tissue by use of optical coherence tomography,”
Opt. Lett. , 23 228
–230
(1998). Google Scholar
A. Baumgartner
,
S. Dichtl
,
C. K. Hitzenberger
,
H. Sattmann
,
B. Robl
,
A. Moritz
,
A. F. Fercher
, and
W. Sperr
,
“Polarization-sensitive optical coherence tomography of dental structures,”
Caries Res. , 34 59
–69
(2000). Google Scholar
J. F. de Boer
,
S. M. Srinivas
,
B. H. Park
,
T. H. Pham
,
Z. Chen
,
T. M. Milner
, and
J. S. Nelson
,
“Polarization effects in optical coherence tomography of various biological tissues,”
IEEE J. Sel. Top. Quantum Electron. , 5 1200
–1203
(1999). Google Scholar
J. F. de Boer
,
T. E. Milner
, and
J. S. Nelson
,
“Determination of the depth resolved Stokes parameters of light backscattered from turbid media using polarization sensitive optical coherence tomography,”
Opt. Lett. , 24 300
–302
(1999). Google Scholar
C. E. Saxer
,
J. F. de Boer
,
B. H. Park
,
Y. Zhao
,
C. Chen
, and
J. S. Nelson
,
“High speed fiber based polarization-sensitive optical coherence tomography of in vivo human skin,”
Opt. Lett. , 25 1355
–1357
(2000). Google Scholar
G. Yao
and
L. V. Wang
,
“Two-dimensional depth-resolved Mueller matrix characterization of biological tissue by optical coherence tomography,”
Opt. Lett. , 24 537
–539
(1999). Google Scholar
S. Jiao
and
L. V. Wang
,
“Jones-matrix imaging of biological tissues with quadruple-channel optical coherence tomography,”
J. Biomed. Opt. , 7 350
–358
(2002). Google Scholar
B. H. Park
,
C. Saxer
,
S. M. Srinivas
,
J. S. Nelson
, and
J. F. de Boer
,
“In vivo burn depth determination by high-speed fiber-based polarization sensitive optical coherence tomography,”
J. Biomed. Opt. , 6 474
–479
(2001). Google Scholar
M. G. Ducros
,
J. D. Marsack
,
H. G. Rylander III
,
S. L. Thomsen
, and
T. E. Milner
,
“Primate retina imaging with polarization sensitive optical coherence tomography,”
J. Opt. Soc. Am. A , 18 2945
–2956
(2001). Google Scholar
B. Cense
,
T. C. Chen
,
B. H. Park
,
M. C. Pierce
, and
J. F. de Boer
,
“In vivo depth resolved birefringence measurement of the human retinal nerve fiber layer by polarization-sensitive optical coherence tomography,”
Opt. Lett. , 27 1610
–1612
(2002). Google Scholar
C. K. Hitzenberger
,
E. Go¨tzinger
,
M. Sticker
,
M. Pircher
, and
A. F. Fercher
,
“Measurment and imaging of birefringence and optic axis orientation by phase resolved polarization sensitive optical coherence tomography,”
Opt. Express , 9 780
–790
(2001). Google Scholar
A. Stanworth
and
E. J. Naylor
,
“The polarization optics of the isolated cornea,”
Br. J. Ophthamol. , 34 201
–211
(1950). Google Scholar
G. J. Van Blokland
and
S. C. Verhelst
,
“Corneal polarization in the living human eye explained with a biaxial model,”
J. Opt. Soc. Am. A , 4 82
–90
(1987). Google Scholar
D. M. Maurice
,
“The structure and transparency of the corneal stroma,”
J. Physiol. (London) , 136 263
–285
(1957). Google Scholar
D. J. Donohue
,
B. J. Stoyanov
,
R. L. McCally
, and
R. A. Farrell
,
“Numerical modeling of the cornea’s lamellar structure and birefringence properties,”
J. Opt. Soc. Am. A , 12 1425
–1438
(1995). Google Scholar
M. G. Ducros
,
J. F. de Boer
,
H.-E. Huang
,
L. C. Chao
,
Z. Chen
,
J. S. Nelson
,
T. E. Milner
, and
H. G. Rylander III
,
“Polarization sensitive optical coherence tomography of the rabbit eye,”
IEEE J. Sel. Top. Quantum Electron. , 5 1159
–1167
(1999). Google Scholar
R. H. Newton
and
K. M. Meek
,
“The integration of the corneal limbal fibrils in the human eye,”
Biophys. J. , 75 2508
–2512
(1998). Google Scholar
A. Daxer
and
P. Fratzl
,
“Collagen fibril orientation in the human corneal stroma and its implication in keratoconus,”
Invest. Ophthalmol. Visual Sci. , 38 121
–129
(1997). Google Scholar
A. W. Dreher
,
K. Reiter
, and
R. N. Weinreb
,
“Spatially resolved birefringence of the retinal nerve fiber layer assessed with a retinal laser ellipsometer,”
Appl. Opt. , 31 3730
–3749
(1992). Google Scholar
Q. Zhou
and
R. N. Weinreb
,
“Individualized compensation of anterior segment birefringence during scanning laser polarimetry,”
Invest. Ophthalmol. Visual Sci. , 43 2221
–2228
(2002). Google Scholar
R. W. Knighton
and
X.-R. Huang
,
“Linear birefringence of the central human cornea,”
Invest. Ophthalmol. Visual Sci. , 43 82
–86
(2002). Google Scholar
L. J. Bour
and
N. J. Lopez Cardozo
,
“On the birefringence of the living human eye,”
Vision Res. , 21 1413
–1421
(1981). Google Scholar
J. M. Bueno
and
F. Vargas-Martin
,
“Measurements of the corneal birefringence with a liquid-crystal imaging polariscope,”
Appl. Opt. , 41 116
–124
(2002). Google Scholar
J. W. Jaronski
and
H. T. Kasprzak
,
“Generalized algorithm for photoelastic measurements based on phase stepping imaging polarimetry,”
Appl. Opt. , 38 7018
–7025
(1999). Google Scholar
J. M. Schmitt
,
S. L. Lee
, and
K. M. Yung
,
“An optical coherence microscope with enhanced resolving power in thick tissue,”
Opt. Commun. , 142 203
–207
(1997). Google Scholar
Y. Zhao
,
Z. Chen
,
C. Saxer
,
S. Xiang
,
J. F. de Boer
, and
J. S. Nelson
,
“Phase-resolved optical coherence tomography and optical Doppler tomography for imaging blood flow in human skin with fast scanning speed and high velocity sensitivity,”
Opt. Lett. , 25 114
–116
(2000). Google Scholar
M. Sticker
,
C. K. Hitzenberger
,
R. Leitgeb
, and
A. F. Fercher
,
“Quantitative differential phase measurement and imaging in transparent and turbid media by optical coherence tomography,”
Opt. Lett. , 26 518
–520
(2001). Google Scholar
|


CITATIONS
Cited by 115 scholarly publications and 43 patents.
Cornea
Birefringence
Optical coherence tomography
Polarization
In vitro testing
Interferometry
Reflectivity


