
1.IntroductionDiabetes can lead to severe complications over time, such as blindness, renal and cardiovascular diseases, and peripheral neuropathy associated with the limbs.1 Poor blood circulation in lower extremities of the body can lead to gangrene and subsequent amputation. This pathology is the fourth leading cause of mortality in the United States. The most effective way to manage diabetes is frequent blood glucose monitoring performed by the patients themselves. Because of the pain, inconvenience, and fear of developing infections from finger-prick blood tests or implants, many patients monitor their blood glucose levels less frequently than is recommended by their physicians. Therefore a noninvasive, painless, and convenient method to monitor blood glucose would greatly benefit diabetics. Previously, several noninvasive optical techniques have been shown to have the potential of avoiding the disadvantages of the standard finger-prick method, one of them being polarimetry.2 3 4 The test sites being explored include the eye, fingertips, cuticle, finger web, forearm, ear lobe, and saliva. However, many hurdles need to be overcome before such a method could become commercially viable. The preferred test site for polarimetric measurement of glucose concentration in the human body is the aqueous humor of the eye. The aqueous humor is the clear fluid between the cornea and crystalline lens in the eye’s anterior chamber. This fluid is an ultrafiltrate of blood containing most of the molecules found in serum, including glucose, at concentrations that are reflective of serum levels in the human body.5 Therefore the aqueous humor presents an exceptional optical window for measuring glucose levels noninvasively and contact-free for diabetes care. Polarimetric techniques use the property of glucose as an optically active analyte that rotates the plane of polarization of incident polarized light by an angle ϑα in accordance with the Biot law2 3 6 7: where [α]λ is the optical rotatory power of glucose, l is the optical path length through the sample, and c the glucose concentration in the sample. In general, [α]λ is a function of temperature, pH, and wavelength λ. In the case of glucose in the aqueous humor, it has been proposed that the effects of temperature and pH may be neglected.7 8 For this assumption, the optical rotatory power can be described as a function of wavelength only, as is indicated by the index λ in Eq. (1). This functionality with wavelength is called optical rotatory dispersion (ORD). If the optical rotatory power at the wavelength used and the optical path length l inside the sample are known, the glucose concentration c can be calculated by observing the polarization rotation ϑα.Rabinovich et al.;2 first proposed the aqueous humor of the eye as an optical window to the body for noninvasive detection of glucose and described an optical feedback system that applied two Faraday rotators for polarization modulation and compensation. Their in vitro measurements showed a resolution of 0.1 mdeg in optical rotation. Cote´ et al.;9 suggested a true phase measurement technique, applying a rotating linear polarizer as modulator and a fixed linear polarizer as an analyzer to measure glucose concentrations in H 2 O samples, and achieved a resolution of about 1 mdeg. Later, Cameron and Cote´10 suggested an approach similar to that of Rabinovich, using a digital closed-loop design to improve the stability and repeatability of their sensor. They reported a resolution of about 8 mg/dl in H 2 O samples, corresponding to a resolution in optical rotation of about 0.3 mdeg. Chou et al.;11 proposed an amplitude-sensitive optical heterodyne technique using a Zeeman laser and obtained 0.1 mdeg of resolution in H 2 O samples. In order to account for other optically active substances present in the aqueous humor and, potentially, for corneal birefringence, King et al.;12 investigated multispectral glucose detection by using two helium:neon (He:Ne) lasers at 594 and 633 nm, respectively. Their feedback system applied a single Pockels cell for modulation and compensation but showed higher standard deviations in the range of 65 mg/dl for the yellow laser light, corresponding to 17 mdeg of polarization rotation, and about 15 mg/dl for the red laser light, corresponding to 3.5 millidegrees. In subsequent work, Cameron et al.;13 applied the multispectral approach to their digital closed-loop system and achieved a resolution of about 20 mg/dl glucose, with varying concentrations of albumin present. In the same work, they provided proof of the concept of applying a polarimetric signal tangentially through a rabbit eye using index matching. These and many other reported approaches are common in that they suggest passing a beam of linearly polarized light tangentially through the aqueous humor of the anterior human eye and observing ϑα on the other end.2 3 8 9 10 11 12 13 14 15 Currently, no glucose diagnostic device exploiting this simple optical principle is commercially available. We proposed earlier that the accuracy in obtaining or establishing an optimal optical path through the anterior chamber is crucial because of the refractive properties of the cornea.16 Indeed, previously, index matching was used to circumvent this problem.8 13 The contact with the eye globe, however, may make this approach less desirable for practical use. In this paper we describe a new polarimetric noncontact (no index matching) scheme, proposing Brewster reflection off of the aqueous–lens interface. This may help solve the limitations of the previous schemes in instrument design. We first justify our new scheme by discussing the difficulty of the tangential path. Then we propose the global principle of a possible glucose sensor and present a theoretical analysis of the newly proposed optical scheme, reporting the results of computer simulation based upon the anatomical eye model of Navarro.17 18 The aim of this analysis is to theoretically predict measurement errors and alignment accuracy requirements. Finally, we present the experimental results of a proof-of-concept laboratory bench-top setup. Measurements were performed on solutions of pure α-D-glucose in distilled water applying a true phase measurement technique. The concentrations of the samples investigated ranged from 0 to 1000 mg/dl. This concentration range covers the physiological conditions of the normal and extreme levels of hypo- and hyperglycemia in diabetics. The results verify the linear relationship between the known glucose concentration and the detected angle of polarization rotation. 2.Eye Model and Simulation Program2.1.Eye ModelThe Navarro eye model17 18 assumes linear, isotropic, and homogeneous ocular media, which have fixed average refractive indices. The refracting surfaces of the human eye are described by centered quadric surfaces (conicoids), which were fitted to anatomical data.19 20 All surfaces show rotational symmetry along the optical axis; thus the optical system of the eye shows rotational symmetry as well. The work described here is limited to a simplified two-dimensional representation of the eye, applying a cross-section of the Navarro eye that contains the optical axis. Thus the quadric surfaces are reduced to quadratic relations of the form17: where the space variable z defines the optical axis and forms a two-dimensional Cartesian coordinate system with the space variable x. R denotes the radius of curvature and Q is the asphericity parameter, which specifies the type of relation defined by Eq. (2).Q>0: ellipse with major axis in x direction, Q=0: circle, −1<Q<0: ellipse with major axis in z direction, Q=−1: parabola with axis in z direction, Q<−1: hyperbola. We focus on the anterior eye with the surfaces of the anterior cornea, posterior cornea, and anterior lens. The corresponding curves of the eye profile can then be given by where the corresponding parameters and curves of the model are given in Table 1 and Fig. 1, respectively. Thus, the anterior cornea is described by an ellipse, the posterior cornea by a circle, and the anterior lens by a hyperbola. Corneal diameters in adult human eyes typically range from about 10.5 to 12.5 mm.21 The finite spot size of a measurement light beam and potential boundary effects near the cornea-sclera transition restrict the usable corneal aperture to an estimated average value of 10 mm. This region of the usable clear aperture of the cornea is represented by the light area in Fig. 1. Note that for the D-line of sodium at λ=589.3 nm the refractive indices reported in Table 1 are anatomical.18 An exception to this is the lens, where the shell structure was neglected and an effective value for the refractive index was given.Figure 1Profile of the Navarro eye model for anterior cornea, posterior cornea, and anterior lens, and definition of the Cartesian coordinate system. The definition of the light propagation angle ϕ and the azimuth of polarization θp are indicated as well. The light area of the cornea indicates the usable clear aperture. 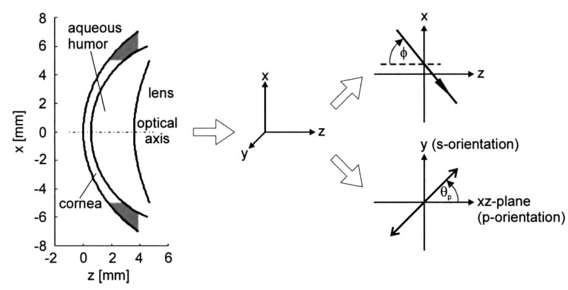 Table 1
2.2.Description of the Simulation ProgramA brief description of the simulation algorithm is presented. Starting at the user-specified initial geometrical condition (position and direction of the light beam), the geometrical properties of light propagation are calculated. We determined the intersections of the beam with the eye surfaces and the refraction and reflection angles. The definition of the Cartesian coordinate system and the corresponding parameters are indicated in Fig. 1. The intersections can be calculated analytically without any iteration. The simulation program was written to allow calculations from initial positions inside the eye, i.e., it features backward calculation against propagation of the physical beam. The geometrical properties obtained are then used to determine the electromagnetic and polarization properties of light propagation. The effects considered include the transmission and reflection properties of the electromagnetic field at transitions between the media of different refractive indices, as described by the Fresnel equations; dispersion of the eye media, described by the Herzberger formula;17 and rotation inside the aqueous humor that is due to the optical activity of glucose, described by Biot’s law in Eq. (1). Formally, the normalized Cartesian Jones matrix notation was adopted for the calculations.22 23 Here we report the general form of the Jones matrices that describe the changes to light when it is propagating through the eye. The transmission and reflection Jones matrices are reported in Eqs. (4) and (5): These matrices are diagonal and their elements are simply the Fresnel equations for transmission and reflection.23 ni and nt are the refractive indices of the incident and traversed medium, whereas ϕi and ϕt are the incident and refractive angles with respect to the normal to the eye surface at the intersection point.To describe the effects of glucose on the electric field, we use the Jones matrix shown in Eq. (6), which denotes a rotation matrix, with the rotation angle due to optical activity of glucose, according to Eq. (1).23 Dispersion of the eye media was considered by applying the Herzberger formula, reported in Ref. 17. Note, however, that this formula was computed by the authors to fit chromatic aberration of the Navarro eye model and thus the described dispersion is not anatomical. This nonanatomical Herzberger formula was used in our simulations because of lack of anatomical dispersion data for eye media. Nevertheless, this description of dispersion is expected to yield results similar and on the same order of magnitude as anatomical dispersion curves. Birefringence of the cornea is not considered within this investigation. The total sum and modeling of birefringence was found to be inadequate and partially contradictory in the literature.24 25 26 27 28 29 3.Optical Access to the Eye3.1.Problem of the Tangential PathIn the tangential path approach to optically accessing the eye, a linearly polarized entrance light is passed tangentially through the aqueous humor, as shown in Fig. 2(a). The linearly polarized entrance state is rotated by the optical activity of the glucose molecules present in the aqueous humor. Measurement of the rotation angle of polarization at the output and of the path length inside the aqueous humor determines the glucose concentration according to Eq. (1). It is because of the refraction at the cornea that an entrance light beam has to impinge the anterior cornea at a minimum distance x min from the ocular axis to achieve this tangential path. Applying the simulation, this minimum distance could be found as follows: The initial position of the light beam (589.3 nm) was placed on the optical axis (z-axis) into the aqueous humor (region 0.55 mm<z<3.6 mm) with a beam propagation direction parallel along the x-axis. For initial z-values near the posterior corneal surface, this did not lead to any solution for light transmitted through the cornea, from this point of view, because of total inner reflection at the cornea–air interfaces. The minimal z-value, which led to a traversed beam through the cornea, was then iteratively determined and yielded the corresponding minimal x-value. This value amounts to x min =5.45 mm, which is outside the estimated usable clear aperture of the cornea. This result holds for the whole visible spectrum of the measurement light. Therefore, the practicability of the tangential path is doubtful. Figure 2Optical access to the human eye. (a) Tangential path (solid beam path). The dashed beam path indicates the first possible entrance condition. (b) New scheme applying Brewster reflection off the lens. The 10-mm aperture of the cornea is indicated by the light area. Polarization states at different positions are shown schematically.  In Fig. 2(a) the first possible entrance condition is indicated by the dashed beam path. Likewise, this path does not exit through the aperture of the cornea. To overcome this difficulty, a contact lens for index matching could be applied to the eye. The contact with the eye globe, however, may notably reduce the convenience of the method and its advantage over the standard finger-prick test. Previous publications of in vivo measurements in rabbit eyes, where index matching was applied, support our theoretical findings.8 13 3.2.New Scheme Applying Brewster ReflectionTo circumvent the problems of the tangential path approach, a new noncontact approach to access the aqueous humor of the eye is shown in Fig. 2(b). It works as follows: Part of the circularly polarized entrance beam (λ=589.3 nm) is reflected off the ocular lens at Brewster’s angle ϕB. According to the data reported in Table 1 ϕB can be calculated to be 46.72 deg for wavelength λ=589.3 nm. Ideally, the reflected light is linearly polarized, with the polarization orientation perpendicular to the plane of refraction. On its way out of the eye, the polarization state of this beam is rotated by the glucose molecules in the aqueous humor and thus carries the concentration information. The distance of the entrance point of the beam from the optical axis was found by simulation, placing the initial position at the vertex of the anterior lens with the beam direction in Brewster’s condition. This yielded an entrance x-value x in =3.12 mm, and an entrance angle (with respect to the optical axis) of ϕ in =55.4 deg. These values are not difficult to achieve in a human eye. The optical path length of the reflected beam in the aqueous humor, which is the relevant quantity for determining glucose concentration, amounted to l ah =3.63 mm. These geometric properties calculated for light at wavelength λ=589.3 nm define the ideal entrance condition for the human eye for the Brewster scheme. Relative output power was determined to be 0.2. Besides the more convenient optical access to the aqueous humor, the Brewster scheme has another potential advantage over the tangential path: The effective measurement light is that of the reflected beam. Therefore the birefringence of the cornea, which is a potential source of measurement errors, ideally affects measurement results only by the transition of the outgoing light through the cornea. In contrast, for the tangential path, measurement results are affected by both transitions of the light beam through the cornea. One disadvantage of the Brewster scheme compared with the tangential path is that about 97 of the incident light to the eye may reach the retina. Therefore the intensity of the measurement light has to be carefully controlled in real eye applications to avoid eye hazards. Another disadvantage arises from the shorter optical path of the measurement light inside the aqueous humor, which is about half of that for the tangential path. 3.3.Working Principle of the Novel Glucose SensorThe detection system diagramed in Fig. 3 uses a multiwavelength light source to take advantage of the optical rotatory dispersion of glucose, in which the orientation of light polarization is rotated by different amounts at different wavelengths, while concentration and optical path length are kept constant. Formally, this is described by the functionality of optical rotatory power with wavelength λ, where the general form is given by the law of Drude.30 The ORD is specific for each optically active substance. Therefore, the use of multiple wavelengths has the advantage of potentially allowing the elimination of the influences of other optically active substances present in the aqueous humor, such as albumin and ascorbic acid. In addition, it may also allow accounting for measurement errors that are due to corneal birefringence.12 13 31 The resulting relative rotation of light polarization that are due to glucose in the aqueous humor can be determined simultaneously from the different chromatic channels by spectrally resolved signal detection performed by the angle detection unit. For simultaneous determination of the corresponding optical path l ah of the reflected light beam inside the aqueous humor, the application of low-coherence interferometry32 33 34 35 is proposed at the path length detection unit. Figure 3Diagram of the glucose sensor. The detection system applies a multiwavelength light source and spectrally resolved signal detection to measure relative polarization rotation profiting, from the optical rotatory dispersion of glucose. The corresponding path length inside the aqueous humor, l ah , can be measured simultaneously to the relative polarization rotation measurement by low-coherence interferometry. 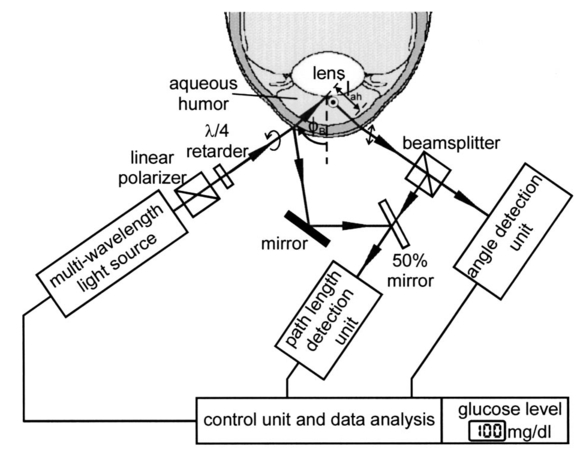 The proposed glucose sensor works as follows: The light beam from the multiwavelength light source (for example, a halogen lamp or a multilaser system) is passed through a high-quality linear polarizer (for example, a Glan-Thompson polarizer), followed by an achromatic quarter-wave retarder (Fresnel Rhomb retarder), to generate a nearly pure circularly polarized entrance beam. This multiwavelength beam is aligned to the anterior cornea so that it performs Brewster reflection at the vertex of the anterior lens surface. Simplified, the resulting reflected light is then linearly polarized perpendicular to the plane of refraction. This light rotates the polarization orientation when it passes through the aqueous humor. The amount of polarization rotation is a function of the glucose concentration in the aqueous humor, the optical path length of the reflected beam inside the aqueous humor, and of wavelength λ. The measurement light then reaches the true phase angle-detection unit, which is composed of a rotating linear polarizer (Glan-Thompson) as an analyzer, a dispersive unit (a variable interference filter, a system of dichroic beamsplitters and filters, or a grating), and photodetectors. The rotating analyzer modulates the optical power of the multiwavelength beam, which in turn is separated into different chromatic channels by the dispersive element(s). The photodetectors measure the signals at each channel (see Sec. 5) simultaneously. This angle detection scheme is new in the field in that it uses a rotating linear polarizer as an analyzer to obtain signal modulation and in that different chromatic channels are detected simultaneously. At the control unit, the relative polarization rotations resulting from glucose are determined from the acquired signals. To simultaneously determine the corresponding path length l ah , the part of the entrance beam reflected from the anterior cornea and part of the beam reflected from the ocular lens can be used to perform low-coherence interferometry at the path length detection unit. Therefore the path length detection unit has to be calibrated to the individual subject. Finally, the results from both detection units are used to determine and present the glucose concentration of the aqueous humor. 3.4.System RequirementsFor practical use in diabetes care, a glucose sensor needs to detect glucose concentration with an accuracy of at least 15.36 37 If an accuracy of a path length measurement of 5 (∼180 μm) is assumed, the relative rotation angle has to be measure with an accuracy of 10. This follows from the linearity of Eq. (1). To estimate absolute values at the accuracy required in detecting the relative polarization rotation, the ORD curve of glucose has to be known. This curve is also needed for evaluating concentration from experimental measurements. An approximate dispersion curve has been obtained by interpolation of the data reported in the literature.6 7 Table 2 presents data from two sources. Interpolation has been performed for the mean values of the two datasets and is reported graphically in Fig. 4, where the (barely visible) vertical error bars denote the standard deviations. The analytical form of the interpolation curve yielded Figure 4Optical rotatory dispersion curve of glucose interpolated for the mean values of the data from Refs. 6 and 7 reported in Table 2. The (barely visible) vertical error bars indicate the standard deviations obtained from the two datasets. 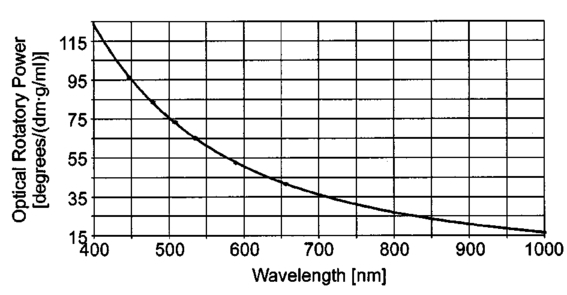 Table 2
We consider the simplest situation, applying only two different wavelengths, λ1 and λ2, and assume identical optical paths for both wavelengths. The corresponding values of optical rotatory power of glucose in units of degrees/(dm⋅g/ml) can be determined from Eq. (7) and are denoted as [α]λ1 and [α]λ2 respectively. Applying Eq. (1), the relative rotation of light polarization is calculated as where lah denotes the optical path length of the reflected beam inside the aqueous humor in units of millimeters. In Sec. 3.2 this value was theoretically determined as l ah =3.63 mm. The glucose concentration of the aqueous humor in healthy people typically amounts to c=100 mg/dl. The factor of 10−7 has to be introduced to match the units and to obtain Δϑα in units of degrees. For wavelengths λ1=405 nm (the emission wavelength of a blue diode laser) and λ2=830 nm (the emission wavelength of a diode laser), the values for optical rotatory power can be determined as [α]405=120.08 deg/(dm⋅g/ml) and [α]830=24.87 deg/(dm⋅g/ml), respectively. The relative rotation of light polarization for these wavelengths amounts to Δϑα=3.5 mdeg. We therefore estimate that to obtain a 10 detection accuracy for relative polarization rotation, a resolution of the angle detection unit of |ΣΔϑα|=0.3 mdeg is required.4.Theoretical Analysis of Performance of the Brewster SchemeThree sources of errors in determining glucose concentration have been classified: errors that are due to variation in the optical path length of the reflected light inside the aqueous humor (path length error, PLE), errors that are due to refraction of the entrance light at the cornea and subsequent reflection off the ocular lens (lens reflection error, LRE), and errors that are due to refraction of the reflected light output at the cornea (cornea refraction error, CRE). The physical origin of the last two errors is the difference of the transmission on reflection coefficients for the s- and p-components of the electromagnetic wave, resulting in rotation of light polarization. For the lens reflection error, the additional effects of deviations from an exact Brewster reflection contribute to polarization rotation, thus leading to measurement errors. Simulations have been performed as a multiwavelength approach (MWA) reflecting the experimental situation. A reference light beam at λ2=589.3 nm (D-line of sodium) was applied to each setting of the eye model. The choice of this wavelength was based on the fact that the refractive indices of the eye model are anatomical for this wavelength. The glucose concentration was determined by comparing the result of azimuth calculation of the output light at the measurement wavelength λ1 with the result at the reference wavelength λ2, profiting from the ORD of glucose. Thus, for each setting of the parameters of the eye model, the calculation was performed twice, once for the reference wavelength at λ2=589.3 nm and once for the measurement wavelength. For the concentration calculations, the constant optical path length at the ideal entrance condition l ah =3.63 mm was assumed (see Sec. 3.2). Thus the concentration c was calculated as where Δϑα denotes the relative polarization rotation angle. In consequence, the net error in determining the concentration is composed of PLE, LRE, and CRE.Simulations have been performed for two distinct entrance polarizations, which are a linearly polarized entrance light (s-mode) and a circularly polarized entrance light. The results are discussed as a comparison between these two approaches. Errors in determination of concentration are reported as percentage relative errors. For all simulations, the influence of the wavelength of the measurement light on the relative error was very small. Therefore all results are reported for only one measurement wavelength at λ=488 nm. The same holds true for different glucose concentrations within the physiological range. This parameter was set to the normal physiological value of c=100 mg/dl in humans. 4.1.Variations in the Entrance ConditionVariations in the entrance condition took into account the limitations of the 10-mm usable aperture of the cornea. Limitations infused by the iris were not considered and may put even more stringent limitations on entrance conditions. The ranges of the entrance angles and entrance positions for each of the two entrance polarizations investigated were chosen to focus on the range of relative errors that is of practical interest. Therefore the ranges of the entrance parameters x in and ϕ in differ for the separate entrance polarizations. The beam paths for the extreme situations of the ranges of entrance parameters investigated are shown in Fig. 5 for λ=589.3 nm. Figure 5(a) denotes the ideal entrance condition x in =3.12 mm, ϕ in =55.4 deg, where the optical path of the reflected light inside the aqueous humor amounts to l ah =3.63 mm. Figures 5(b) and 5(c) show the extreme entrance conditions for linear and circular entrance polarization, respectively. Figure 5Variations from the ideal entrance condition for λ=589.3 nm. (a) Ideal entrance condition x in =3.12 mm, ϕ in =55.4 deg (l ah =3.63 mm). (b) Extreme situations of entrance conditions for linear entrance polarization, x in =4.22 mm, ϕ in =52.4 deg (solid beam path) and x in =2.42 mm, ϕ in =58.4 deg (dashed beam path). (c) Extreme situations of entrance conditions for circular entrance polarization, x in =4.72 mm, ϕ in =29.4 deg (solid beam path), and x in =2.32 mm, ϕ in =59.4 deg (dashed beam path).  In Figs. 6(a) and 6(b) the results of the simulation for linear entrance polarization in the s-mode and circular entrance polarization are shown. The vertical lines indicate the ideal entrance condition. For both entrance polarizations, the requirements for the entrance parameters to stay within acceptable error limits are modest (compare the extreme situations in Fig. 5). A real beam having a finite beam width can be described by the sum of the enclosed infinite beams. The relative error of such a beam can be described with good approximation as the average of the relative errors of the corresponding infinite beams. The beam width should, therefore, be kept at 1 mm or below to stay within acceptable error limits. Regarding eye movements at fixation, small involuntary saccades represent the type of such movement with highest amplitudes, which amount to about 25 min of angle.38 Owing to the correcting character of small involuntary saccades, this corresponds to ±0.2 deg of deviation of the eye axis. Therefore, from the earlier results, the small involuntary eye movements at fixation are not expected to be critical as long as corneal birefringence is not considered. Figure 6Net error of concentration determination for c=100 mg/dl, λ=488 nm, and for the influence of deviations from the ideal entrance condition. (a) Linearly polarized entrance light (s-mode). (b) Circularly polarized entrance light. The vertical lines indicate the ideal entrance conditions.  In Fig. 6 the limitations on the entrance angle are much more stringent in the case of linear polarization of the entrance light. Further analysis showed that this is due to the higher LRE for linearly polarized entrance light. In addition, in the case of linear polarization, the orientation of the entrance polarization notably influences the relative error, leading mainly to a vertical shift of the error curve and to a dependence on actual glucose concentration. The reason for this is likewise the LRE. Further investigations showed that the orientation of the linear entrance polarization would have to be adjusted to the s-direction with an accuracy on the order of ±0.01 deg, to maintain acceptable errors in determination of glucose concentration. In Fig. 7 the isolated LRE, CRE, and PLE of this simulation are shown for both entrance polarizations. Note that these errors are not independent of each other, so that the net error is not simply their sum. Figures 7(a) and 7(b), showing the LRE, demonstrate that this error is notably higher for linearly polarized entrance light and denotes the dominant error in this case [also compare with Fig. 6(a)]. In Figs. 7(c) and 7(d) the CRE is shown. This error is slightly higher for the case of circular entrance polarization (when comparing equal ranges of entrance conditions), owing to the higher portion of p-polarization of the reflected light for this kind of entrance polarization. The PLE is reported in Figs. 7(e) and 7(f), where Fig. 7(e) is actually a section of Fig. 7(f). This error is the dominant error for circular entrance polarization [also compare with Fig. 6(b)]. The reported range of the entrance parameters is very high. In practice, reasonable control of these parameters could reduce this error significantly. Path length errors within ±5 are expected to be experimentally achievable. Thus, simultaneous measurement of the path length may not be necessary for detecting glucose concentration, once the angle detection unit of the instrument has been calibrated to the individual eye, making the unit for detecting potential path length obsolete. Figure 7Contributions of the different sources of errors to the net error for different entrance conditions (λ=488 nm, c=100 mg/dl) (a) LRE, linearly polarized entrance light (s-mode). (b) LRE, circularly polarized entrance light. (c) CRE, linearly polarized entrance light. (d) CRE, circularly polarized entrance light. (e) PLE, linearly polarized entrance light. (f) PLE, circularly polarized entrance light. The vertical lines indicate the ideal entrance condition.  4.2.Variations in Lens ShapeVariations in the asphericity of the anterior lens and the radius of curvature of excised eye lenses have been reported in Ref. 19. In this publication, 60 pairs of human cadaver lenses from 33 males and 27 females, aged 1 to 87 years, were examined. The reported values of the asphericity parameter range from 0 to −21.25, with an average value at Q=−3.1316 (default value of the eye model, see Table 1). According to Ref. 17, the radius of curvature of the anterior lens has not been varied within this simulation, since the reported values for the excised lenses are smaller than those for in vivo lenses. In Fig. 8 variations in the lens shape are indicated within the eye profile. Changes in errors of concentration determination that are due to variations in the shape of the anterior lens occur only for optical paths that differ from the ideal one. Therefore the simulations were performed by varying the entrance parameters as described in Sec. 4.1. The only difference was that the value of the asphericity parameter Q of the anterior lens was changed by applying the values of the upper and lower limit Q=0 and Q=−21.25 to the eye model. The results for Q=0 were found to be almost equal to those of the previous section (see Fig. 6), whereas for Q=−21.25, small deviations became noticeable. Therefore, only the results for Q=−21.25 are reported in Fig. 9. Figure 9(a) shows a linear entrance polarization, Fig. 9(b) a circular entrance polarization. The vertical lines indicate the ideal entrance condition. A comparison of these figures with Figs. 6(a) and 6(b) shows that the relative error curve is influenced little by the variation in the asphericity parameter of the anterior lens. Some small changes occur, since for Q=−21.25 the anterior lens is notably more even, which influences the LRE. This in turn explains the higher changes for a linear entrance polarization, which is more sensitive to this type of error. In proximity to the ideal entrance condition, the changes in the relative error curve are minimal for both entrance polarizations because the beam impinges the lens close to the vertex, where changes in asphericity have minimal influence. 4.3.Variations in Corneal ShapeIn contrast to variation in lens shape, variation in the anterior corneal shape leads even at ideal entrance conditions to deviations from the ideal optical path, which can alter the measurement errors. Published data from in vivo measurements for both asphericity parameter and radius of curvature are available.20 These data are based on 176 eyes from 49 males and 39 females at ages evenly distributed from 16 to 80 years. Interindividual variations in the asphericity parameter occurred in the range from Q=−0.76 to Q=+0.47. Eighty percent of the intraindividual variations at perpendicular meridians of the eye have been reported to amount to |ΔQ|⩽0.5. The mean value of the asphericity parameter of Q=−0.26 is the one reported in Table 1 and denotes the default value of the eye model. The same holds true for the reported mean value of the radius of curvature of R=7.72 mm. For this parameter, interindividual variations were found to cover the range from R=7.06 mm to R=8.64 mm, and 78 of in traindividual variations at perpendicular eye meridians have been reported to amount to |ΔR|⩽0.3 mm. In Fig. 10 the range of interindividual variations of the corneal shape is indicated within the eye profile. Figure 10Interindividual variations in the corneal shape within the extreme situations of R=8.7 mm, Q=−0.8 and R=7.0 mm, Q=+0.5. 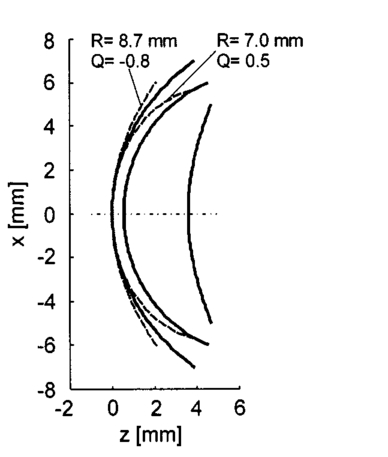 Simulations have been performed under ideal entrance conditions, varying both corneal shape parameters independently. The absolute limits of interindividual variations have been used for the ranges of the shape parameters investigated. Figures 11(a) and 11(b) show the results for linear (s-mode) and circular entrance polarization. The vertical lines indicate the default values of the corneal shape parameters, as reported in Table 1. The errors for linearly polarized entrance light are notably higher than those for circular entrance polarization. This is due to the changed refraction of the entrance beam at the anterior cornea, leading to deviation from ideal beam propagation prior to reflection at the lens, which results in an LRE. Linear polarization, however, is more sensitive to this type of error. Figure 11Net error in concentration determination for c=100 mg/dl, λ=488 nm, and for the influence of variations in the anterior corneal shape parameters. (a) Linearly polarized entrance light (s-mode). (b) Circularly polarized entrance light. The vertical lines indicate the default values of the corneal shape parameters. 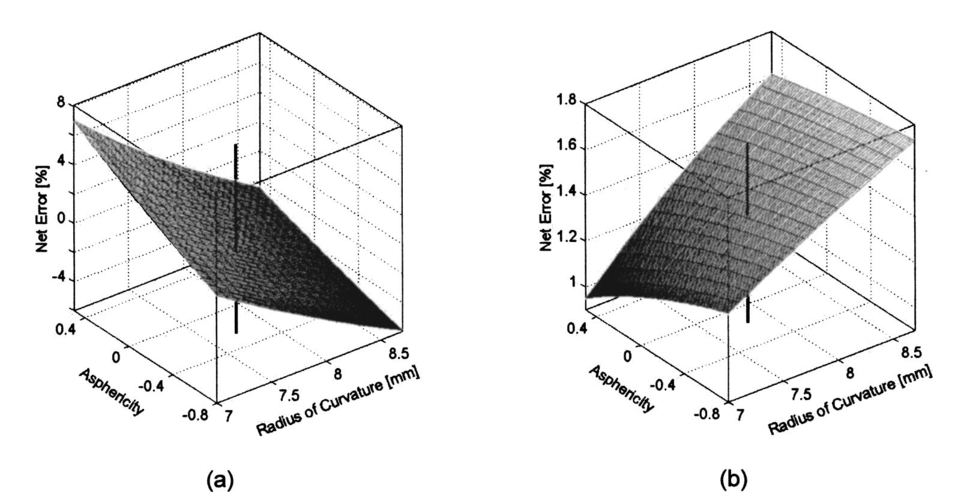 4.4.SummaryThe theoretical investigation of the Brewster scheme demonstrated that circular entrance polarization performs better than linear polarization for this approach. This can be attributed to the high sensitivity of linear entrance polarization to the lens reflection error and the need for accurate adjustment of orientation in linear entrance polarization. The theoretical accuracy requirements for the entrance parameters of the light beam are expected to be experimentally achievable. The influences from lens shape variations, corneal shape variations, and eye movements are not expected to be critical. 5.Experimental Investigation5.1.Measurement SetupFigure 12 is a schematic of the experimental proof-of-concept bench-top setup. The components that represent the eye are indicated by the dashed circle. The dashed box indicates the components that denote the true phase-angle detection unit. Two He:Ne laser light sources (L543; λ=543 nm, 1 mW and L633, λ=633 nm, 2 mW) were aligned by a dichroic mirror (DM1, DELTA, R(480 to 555)>99, T(620 to 780 nm)>90), which reflected the green laser light and transmitted the red. The two light beams were passed through a linear polarizer (LP, Newport, Glan-Thompson, 105:1, angular acceptance ±1 deg) and reflected at the plane side of a planoconvex lens (PCL, n=1.457 at 633 nm) at Brewster’s angle (ϕB=55.54 deg at 633 nm). The linearly polarized reflected light was then passed through a curvette (C, Starna Brand, optical path l=10 mm) containing the glucose sample. Figure 12Experimental setup of the true phase measurement system applying a rotating linear polarizer. Components: He:Ne laser at 543 nm (L543), He:Ne laser at 633 nm (L633), dichroic mirrors (DM1 and DM2), linear polarizer (LP), planoconvex lens (PCL), sample cuvette (C), diaphragm (D), rotating linear polarizer (RLP), spectral filters (F543 and F633), and photodiodes (PD543 and PD633). The components that represent the eye are indicated by the dashed circle. The Brewster’s angle of reflection ϕB is also shown. The components denoting the angle-detection unit are indicated by the dashed box.  It was impossible to perform the reflection inside the cuvette because the incident angle of the light output at the cuvette–air interface would have been too close to the total internal reflection condition and the resulting output power too low. This problem is not expected to occur at the eye because of the corneal curvature. Here we used linearly polarized incident light. The linear polarization prior to reflection at the PCL was adjusted to the s-direction, maximizing the optical power of the reflected beam. This adjustment was performed only approximately. Thus, the polarization state of the reflected measurement light was actually determined by the reflection off of the PCL. Since the reflection conditions of the experimental setup were stationary, the advantage of using circularly polarized entrance light did not hold anymore. The use of the linear polarizer was motivated by practical aspects; the light sources emitted prepolarized beams. Introducing the linear polarizer enabled the relative adjustment of the light power by rotating the sources around their axes. In this way, equal signal amplitudes of the detector signals at equal detector amplifications could be achieved, minimizing signal interferences. Note that the eventual presence of circular polarization components only leads to signal offset [see Eq. (10)] and thus does not disturb determination of the relative azimuth of rotation. Therefore, the only effect of simplifying the proof-of-concept setup is that there is no influence on the measurement light from glucose prior to the Brewster reflection. However, in Sec. 4 it was shown theoretically that this effect can be expected to be small. After passage through the cuvette, the two beams carrying the glucose concentration information were detected by the true phase angle-detection unit. This consists of a rotating linear polarizer as an analyzer (RLP, Melles Griot, Glan-Thompson, 105:1, 350 to 2300 nm, angular acceptance ±10 deg), a second dichroic mirror (DM2) of same type as DM1, and two photodetectors (PD543 and PD633, a preamplified photodiode UDT 555-UV). Additional spectral interference filters (F543 and F633) were placed in front of the photodetectors, avoiding interferences between the two chromatic signals caused by the nonideality of the DM2 dichroic mirror. The output signals from the photodetectors were digitized, using a digital data acquisition board (LabPC, National Instruments, 12-bit resolution), plugged into a personal computer. 5.2.MeasurementsThe signals detected from the photodetectors form sine waves because the continuously rotating linear polarizer changes the transmitted light power of the detection beams sinusoidally with time. The glucose concentration provided by the sample leads to different rotations of the azimuth of polarization for the two wavelengths, owing to the ORD of glucose, thus to a nonzero relative azimuth of polarization between the two beams. This relative azimuth of polarization changes linearly with glucose concentration, as expected from Eq. (1). The detection unit transforms the relative azimuth of polarization between the two detected beams into a relative phase between their corresponding sinusoidal signals. The relative signal phase and relative azimuth of polarization are simply correlated by a factor of 2. One advantage of this detection method is that possible circularly polarized and nonpolarized components of the measurement beams only lead to an offset of the detection signals from the photodetectors; thus they do not disturb the angle measurements. This can be seen formally in Eq. (10). The detection signals were acquired for one revolution of the rotating linear polarizer. The rotation frequency amounted to about 0.66 Hz. Thus the acquisition of one dataset took 1.5 s. Acquisition synchronization with respect to the angular orientation of the RLP was achieved by use of an encoder which drove the A/D conversions. The total number of data points acquired per chromatic channel amounted to about 30,000. The glucose samples were prepared by dissolving pure α-D-glucose (Serva) in 50 ml of distilled water. The solutions were only used after at least 9 h to ensure chemical equilibrium between α- and β-D-glucose. Measurements were performed using twelve different glucose concentrations between 0 and 1000 mg/dl. At each concentration, the measurements were repeated 50 times for statistical accuracy. Figure 13 shows an example of the raw signals detected for a glucose concentration c=0 mg/dl. The optical peak power values amounted to 13 μW for the 543-nm signal and 7.5 μW for the 633-nm signal. Typical light power values, prior to propagation through the sample cuvette, were 19 and 9.5 μW, respectively. 5.3.Evaluation of DataThe relative azimuths of polarization were calculated from the digitized data by applying an integral method based upon the Stokes theory,22 39 40 which uses the complete dataset. The theoretical power signal P th formed by the detection system can be expressed as39 where θ is the varying azimuthal orientation of the rotating linear polarizer and Si are the so-called Stokes parameters of the light beam.The absolute azimuth of polarization θp of a light beam can be calculated from the Stokes parameters S1 and S2 as40 Following the theoretical power signal P th expressed in Eq. (10), the two Stokes parameters can be calculated from the detected power signal Pd as where n is an integer number. Thus, integrations over integer periods of each detection signal have to be performed. The relative azimuth of polarization between the two light beams is then calculated simply from the difference between their absolute azimuths.5.4.Results and DiscussionThe experimental results are shown in Fig. 14. The relative rotations of light polarization with the glucose concentrations show a correlation coefficient of 0.986. The slope of the linear regression amounts to (0.0166±0.0020) mdeg⋅dl/mg. The theoretical value for a 10-mm optical path length in the sample amounts to 0.0179 mdeg⋅dl/mg. This is in good agreement with the experimental findings. The theoretical value was obtained by using the values of the optical rotatory power at the respective wavelengths in Eq. (1). The vertical error bars in Fig. 14 show the standard deviations calculated from the 50 repetitions of each measurement. These values fluctuate between 0.86 and 2.08 mdeg, with a mean value of 1.38 mdeg, corresponding to a glucose concentration of 77 mg/dl for the wavelengths used. This indicates a lower resolution of our proof-of-concept detection system than that for several previous approaches (see Sec. 1). However, the results show that a reflected multi-wavelength light beam can be used to accurately measure relative polarization rotation and, therefore, glucose concentration. This meets the requirement for noninvasive and noncontact polarimetric measurement of glucose levels in the aqueous humor of the human eye. Figure 14Relative rotation of light polarization between the measurement beams for different known glucose samples. Each measurement was repeated 50 times for statistical accuracy. The vertical error bars show the standard deviation of each measurement. The correlation coefficient of the linear regression amounts to R2=0.986. 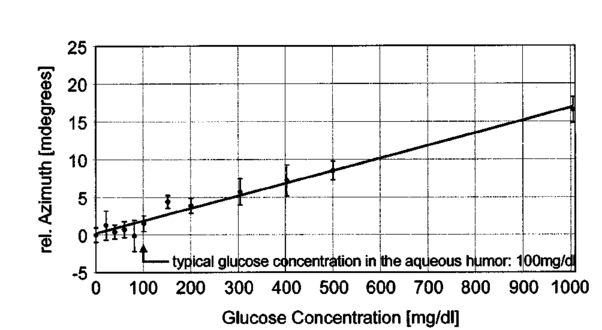 In contrast to previously reported multiwavelength investigations,12 13 the detection of the different chromatic channels has been performed simultaneously. This is an important property, especially when corneal birefringence coupled with eye motion artifacts is addressed.13 The use of additional wavelengths is not expected to be critical for this setup, especially since the modulating analyzer (a rotating Glan-Thompson) is of a broadband type. It only requires the use of additional dichroic mirrors, appropriate interference filters (or similar dispersive elements), and detectors. Note that in the present investigation the system resolution in terms of polarization rotation is more significant than of glucose concentration. The system resolution in terms of glucose concentration can be increased by replacing the light sources and taking advantage of the accessible wavelength range of the aqueous humor. For example, if two light sources at 400 and 900 nm were used (which are fully available), the resolution of 1.38 mdeg in polarization rotation would correspond to 13 mg/dl resolution in glucose concentration. A further investigation of the angle-detection unit indicated a system instability, which explains the deviations from the linear regression. System instability may result from the uncontrolled conditions of the experiment (no temperature control, nonstabilized light sources). For example, the low-pass filter of the preamplified photodetectors introduces a phase shift on each detection signal, which may vary with temperature and with incident light intensities on the detectors. The use of appropriate low noise detection electronics and stabilization of the light sources is expected to improve system accuracy to the necessary resolution of about 0.3 mdeg (see Sec. 3.4) in future experiments. At this stage, the signals were digitized directly after detection and no signal conditioning or processing of the raw data was performed. In conclusion, the sensitivity of the proposed optical scheme with respect to glucose concentration has the potential of being substantially increased to make possible future noninvasive and noncontact measurements of physiological glucose concentrations in the human eye. 6.ConclusionsA unique optical scheme that exploits the Brewster reflection for polarimetric measurements of glucose concentration is described, analyzed, and tested. Based on this approach, a noninvasive and noncontact sensor that measures glucose concentration in the aqueous humor of the human eye can be developed in the future. When compared with the previous approach of a tangential optical path, our new scheme seems more convenient (noncontact) and applicable in accessing the aqueous humor in a human eye. It may be more comfortable to the patient since no index matching is required between the cornea and the apparatus. However, the applicability of the scheme to a real eye will have to be demonstrated. In particular, the sensitivity of the system has to be increased and the problems of beam alignment through curved surfaces (cornea), reflection off a curved surface (lens), and the limiting factor of spatially varying corneal birefringence coupled with motion artifacts will have to be addressed in future experiments. AcknowledgmentsThe authors would like to thank the Office of Biological and Physical Research of the National Aeronautics and Space Administration and the John H. Glenn Biomedical Engineering Consortium for supporting this work. REFERENCES
B. Rabinovich
,
W. F. March
, and
R. L. Adams
,
“Noninvasive glucose monitoring of the aqueous humor of the eye: Part I. Measurement of very small optical rotations,”
Diabetes Care , 5 254
–258
(1982). Google Scholar
R. J. McNichols
and
G. L. Cote´
,
“Optical glucose sensing in biological fluids: an overview,”
J. Biomed. Opt. , 5 5
–16
(2000). Google Scholar
J. S. Baba
,
B. D. Cameron
, and
G. L. Cote´
,
“Effect of temperature, pH, and corneal birefringence on polarimetric glucose monitoring in the eye,”
J. Biomed. Opt. , 7 321
–328
(2002). Google Scholar
G. L. Cote´
,
M. D. Fox
, and
R. B. Northrop
,
“Noninvasive optical polarimetric glucose sensing using a true phase measurement technique,”
IEEE Trans. Biomed. Eng. , 39
(7), 752
–756
(1992). Google Scholar
B. D. Cameron
and
G. L. Cote´
,
“Noninvasive glucose sensing utilizing a digital closed-loop polarimetric approach,”
IEEE Trans. Biomed. Eng. , 44
(12), 1221
–1227
(1997). Google Scholar
C. Chou
,
Y. C. Huang
,
C. M. Feng
, and
M. Chang
,
“Amplitude sensitive optical heterodyne and phase lock-in technique on small optical rotation angle detection of chiral liquid,”
J. Appl. Phys. , 36 356
–359
(1997). Google Scholar
T. W. King
,
G. L. Cote´
,
R. McNichols
, and
M. J. Goetz
,
“Multispectral polarimetric glucose detection using a single Pockels cell,”
Opt. Eng. , 33
(8), 2746
–2753
(1994). Google Scholar
C. Chou
,
C. Y. Han
,
W. C. Kuo
,
Y. C. Huang
,
C. M. Feng
, and
J. C. Shyu
,
“Noninvasive glucose monitoring in vivo with an optical heterodyne polarimeter,”
Appl. Opt. , 37 3553
–3557
(1998). Google Scholar
G. L. Cote´
and
B. D. Cameron
,
“Noninvasive polarimetric measurement of glucose in cell culture media,”
J. Biomed. Opt. , 2
(3), 275
–281
(1997). Google Scholar
S. Bo¨ckle
,
L. Rovati
, and
R. R. Ansari
,
“Polarimetric glucose sensing using the Brewster-reflection off the eye lens: theoretical analysis,”
Proc. SPIE , 4624 160
–164
(2002). Google Scholar
R. Navarro
,
J. Santamarı´a
, and
J. Besco´s
,
“Accommodation-dependent model of the human eye with aspherics,”
J. Opt. Soc. Am. A , 2
(8), 1273
–1281
(1985). Google Scholar
Isabel Escudero-Sanz
and
Rafael Navarro
,
“Off-axis aberrations of a wide-angle schematic eye model,”
J. Opt. Soc. Am. A , 16 1
–11
(1999). Google Scholar
Michael J. Howcroft
and
John A. Parker
,
“Aspheric curvatures for the human lens,”
Vision Res. , 17 1217
–1223
(1977). Google Scholar
P. M. Kiely
,
G. Smith
, and
L. G. Carney
,
“The mean shape of the human cornea,”
Opt. Acta , 29
(8), 1027
–1040
(1982). Google Scholar
M. Hosny
,
J. L. Alio`
,
P. Claramonte
,
W. H. Attia
, and
J. J. Pe`rez-Santonja
,
“Relationship between anterior chamber depth, refractive state, corneal diameter, and axial length,”
J. Refract. Surg. , 16 336
–340
(2000). Google Scholar
L. J. Bour
and
N. J. Lopes Cardozo
,
“On the birefringence of the living human eye,”
Vision Res. , 21 1413
–1421
(1981). Google Scholar
G. J. Van Blokland
and
S. C. Verhelst
,
“Corneal polarization in the living human eye explained with a biaxial model,”
J. Opt. Soc. Am. A , 4
(1), 82
–90
(1987). Google Scholar
J. M. Bueno
,
“Measurement of parameters of polarization in the living human eye using imaging polarimetry,”
Vision Res. , 40 3791
–3799
(2000). Google Scholar
J. M. Bueno
and
J. Jaronski
,
“Spatially resolved polarization properties for in vitro corneas,”
Ophthalmic Physiol. Opt. , 21
(5), 384
–392
(2001). Google Scholar
R. W. Knighton
and
X. Huang
,
“Linear birefringence of the central human cornea,”
Invest. Ophthalmol. Visual Sci. , 43
(1), 82
–86
(2002). Google Scholar
J. M. Bueno
and
F. Vargas-Martı´n
,
“Measurements of the corneal birefringence with a liquid-crystal imaging polariscope,”
Appl. Opt. , 41
(1), 116
–124
(2002). Google Scholar
B. D. Cameron
,
H. W. Gorde
, and
G. L. Cote´
,
“Development of an optical polarimeter system for in vivo glucose monitoring,”
Proc. SPIE , 3599 43
–49
(1999). Google Scholar
L. Rovati
and
F. Docchio
,
“Low-coherence interferometry using a self-mixing superluminescent diode,”
IEEE Photonics Technol. Lett. , 10
(1), 123
–125
(1998). Google Scholar
A. C. Oliveira
,
F. M. M. Yasuoka
,
J. B. Santos
,
L. A. V. Carvalho
, and
J. C. Castro
,
“Low coherence lock-in interferometer for ophthalmology,”
Rev. Sci. Instrum. , 69
(4), 1877
–1881
(1998). Google Scholar
W. J. O. Boyle
,
G. L. Dick
,
K. T. V. Grattan
,
A. W. Palmer
,
D. N. Wang
, and
K. Weir
,
“Optical instrumentation for eye length measurement using a short coherence length laser-based interferometer approach,”
Rev. Sci. Instrum. , 64
(11), 3082
–3087
(1993). Google Scholar
C. K. Hitzenberger
,
“Measurement of corneal thickness by low-coherence interferometry,”
Appl. Opt. , 31
(31), 6637
–6642
(1992). Google Scholar
W. A. Alto
,
D. Meyer
,
J. Schneid
,
P. Bryson
, and
J. Kindig
,
“Assuring the accuracy of home glucose monitoring,”
J. Am. Board Fam. Pract. , 15
(1), 1
–6
(2002). Google Scholar
S. Pelizzari
,
L. Rovati
, and
C. De Angelis
,
“Rotating polarizer and rotating retarder plate polarimeters: comparison of performances,”
Proc. SPIE , 4285 235
–243
(2001). Google Scholar
|
||||||||||||||||||||||||||||||||||||||||||||||||||||||||||||||


CITATIONS
Cited by 61 scholarly publications and 5 patents.


