1.IntroductionCellular transparency is a natural and unique property of the animal lens that is essential for normal visual function. Lens cell opacification is known as cataract and is the leading cause of blindness worldwide, with the expectation that the problem will increase dramatically in the next three decades as a result of extended life spans.1 Aging cataract is a multifactorial disease resulting from a variety of risk factors that contribute to post-translational modifications and abnormal protein interactions that lead to aggregation of cellular proteins.2 It is well established, theoretically and experimentally, that light scattering in cataracts results from a progressive increase in the proportion of high molecular weight aggregates of cytoplasmic proteins.3 4 As the number and size of the scatterers increases with age, opacity progresses to a dense, mature cataract. In fact, aggregation of less than 3 of the cytoplasmic proteins in lens cells can cause complete opacification. Significantly less opacification can cause visual impairment in humans or animal models. Until recently, most cataract studies were done in animal lens models that formed dense, mature cataracts that were easily observed. Minor opacities, or early stages below 3 on a cataract scale of 0 to 6,5 were difficult and expensive to document reproducibly in vivo. Systematic and quantitative image analysis of the location, extent, and intensity of an opacity can be informative for understanding in vivo the earliest stages of cataract formation which is due to a variety of abnormal factors. In rats, a single subcutaneous injection of selenite resulted in the progressive aggregation of cellular proteins that caused abnormal degradation of the lens cytoskeleton.6 Partial protection of lens cytoskeletal proteins at the earliest stages of opacification corresponded with protection against opacification. In humans, desmin-related myopathy (DRM) is a hereditary disease in which abnormal aggregates of the intermediate filament protein, desmin, are associated with protein aggregation and cataracts.7 8 Similarly, deletion of the lens-specific intermediate filament, CP49, in mouse lenses resulted in subtle opacification.9 Myotonic dystrophy, the most common muscular dystrophy in adults, results from expansion of a cytosine-thymine-guanine (CTG) trinucleotide repeat in the untranslated region of the dystrophia myotonica protein kinase (DMPK) gene, and the severity of the disease correlates with the size of the expansion. In addition to myotonia and other developmental and degenerative manifestations, myotonic dystrophy in mouse models, as in humans, is characterized by low-grade cataract that is difficult to evaluate.10 This paper presents a rapid method for digital recording of subtle opacification during cataract formation using low-cost components. Current imaging methods for the examination of human lens and cataract classification include slit-lamp photography,11 12 retroillumination photography, Scheimpflug photography,13 14 15 video capture,16 and dynamic light scattering.17 These methods, developed largely for use in humans, can be very expensive and are often difficult to use for routine and systematic ophthalmic examinations of small experimental animals. Laboratory research on lens transparency can be limited by the small size of rodent eyes, subtle modes of opacity, and minimal scattering intensity, which complicate reproducible documentation using simple and inexpensive methods. Digital evaluation of the location, extent, and intensity of the opacity can be important for the documentation of subtle opacities in experimental animals. Objective evaluation of the lens using densitometry traces of digital images is also important for spatial and temporal quantification of opacities. In response to these limitations and needs, we report a rapid method for digital image capture and image analysis of cataract formation in rats and transgenic mice using low-cost components. Although this method is not as sensitive as dynamic light scattering,18 it simplifies the recording and analysis of lenses in living, unanesthetized mice or rats, making automated documentation and image analysis rapid and cost effective. 2.Methods and Materials2.1.EquipmentA Nikon zoom photo slit-lamp microscope FS-2 (Melville, New York) was used to examine the animals (Fig. 1). Equivalent inexpensive slit lamps from Topcon, Zeiss, or ReSeeVit should be equally effective. An additional beamsplitter with a Nikon vertical phototube adapter was added to the slit lamp to connect a Canon Optura Pi digital video camcorder (Tokyo, Japan) via a custom-machined brass adaptor ring. The exact dimensions of the adaptor (ID, OD, thickness, and thread spacing) depend on the slit lamp and video recorder used for the system. An IEEE 1394 FireWire connected the digital video to a personal computer. Adobe Premiere 6.0 software (San Jose, California) was used to capture still images from the video, and Adobe Photoshop 6.0 was used to process the images. The finished pictures were printed on a high-resolution color ink jet printer. Figure 1Light scattering is dependent upon the concentration and size of the molecular scatterers in lens cells. At a slit angle of approximately 40 deg, scattering will increase as the size of the protein aggregates increases from less than 10 nm to dimensions equal to or greater than half the wavelength of visible light (400 to 800 nm). The sensitivity of the photodetectors in most common home digital video cameras is adequate for recording the light scattering observed using a conventional slit lamp. In the Nikon FS-2 slit lamp, beamsplitters permit direct viewing of the animal eye while simultaneously recording the transparency of the eye in a living animal. If the levels of scattered light are very low, all the light can be directed to the camera, and the image can be viewed on the camera screen alone. Imaging software becomes very important for achieving maximum representation of a developing opacification in the lenses of rats and mice. A major advantage of the system described here is that observations can be recorded digitally without anesthesia, which can affect the animal and limit opportunities for repeated measurements. Video clips are transferred to a personal computer through the FireWire using Adobe Premiere application software.  2.2.Animal HandlingThe animals were housed and cared for by the University of Washington Department of Comparative Medicine. All protocols and procedures were approved by the University of Washington Animal Care and Use Committee. The selenite cataract resulted from a single 3.28 mg/kg body weight subcutaneous injection of sodium selenite (Sigma, St. Louis, Missouri) in 13-day-old Sprague-Dawley rat pups (Charles River Laboratory, Kingston, New York). Lens opacity developed and reached maturity within a few days.19 The cellular alterations in the selenite model involve abnormal calcium homeostasis, proteolysis, protein aggregation, and altered levels of glutathione, factors that are important for aging cataract in humans. In mice, the targeted genomic deletion of CP49, a lens-specific intermediate filament protein, caused a minor cataract that worsened with age.9 The cataract associated with myotonic dystrophy was the result of the targeted deletion of Six5, a gene product that is altered in humans by the expression of mutant DMPK.10 To dilate pupils, a 1:1 mixture of 10 phenylephrine hydrochloride (Akorn, Buffalo Grove, Illinois) and 1 tropicamide (Alcon, Forth Worth, Texas) was delivered by eyedropper into the rodent eye. After about 4 min the animal was placed on a platform directly in front of the slit lamp. We usually found it necessary to hold the mice gently by the scruff of the neck, whereas rat pups could be cuddled in the hand to limit movement. 2.3.RecordingRecording was done in a darkened room with the slit-lamp illumination at maximum brightness. The digital video was set to progressive scan mode to capture 30 full-frame images per second, and the recording program was set on low light. The slit width was about 0.2 mm and magnification was set at 30×. The animal underwent a slit-lamp examination, which was recorded by the digital video. Recording time was usually 1 to 1.5 min per eye to allow observation over a range of angles from 0 to 60° and account for small movements of the animal. Video start and stop times were documented, as this information was useful for video capture with Adobe Premiere. 2.4.Capturing Video Clips and Printing Still ImagesVideo clips were captured using Adobe Premiere 6.0. We found the batch capture method, in which start and stop times are manually entered for each clip, to be the least problematic. Each captured frame was examined and the clearest frames were selected and saved as TIFF files. The TIFF files were opened in Adobe Photoshop, where the rotate and crop functions were used to center the image of the eye and crop extraneous regions of the picture. Pictures were printed on glossy photo paper using an Epson stylus color 740 ink jet printer (Long Beach, California). 2.5.Quantification of OpacityThe images were converted to gray scale using Adobe Photoshop and saved as JPEG files. These files were opened in Image J (downloaded from the National Institutes of Health website, 〈http://rsb.info.nih.gov/ij/〉). A single, horizontal line of pixels was selected through the center of the eye and the plot profile function was chosen. This produced a graph of pixel brightness along all points on the selected line. These values were copied and pasted into Microsoft Excel. The values were normalized to the cornea in order to compare plots among images. The intensity value at the cornea was adjusted to 100, assuming that all images had the same corneal clarity unless corneal abnormalities were observed. The minimum value relative to the cornea corresponded to the aqueous chamber for intensity. All values determined were using the equation: These adjusted values were plotted to obtain the graphs in Fig. 2.Figure 2Frames of slit-lamp images and corresponding densitometry traces. In the slit-lamp view, the vertical curved white line on the left is scattering from light incident on the cornea (b). To the right (posterior) of the cornea, the dark band is the aqueous chamber. Posterior to the aqueous, a thin layer of scattering was observed from the capsule and cells of the anterior epithelium. Densitometry graphs are plotted along a line of pixels taken through the center of each slit-lamp image. The first peak from the cornea is normalized to 100. (a) Clear lens from a control and (b) to (c) lenses from selenite-injected rat pups with dense nuclear cataracts. (d) Clear control lens and (e) to (f) lenses from CP49-null mice exhibiting minor “rings” of structured opacity. (g) Control lens. (h) Clear lens from a heterozygous null mouse, and (i) lens from a Six5-null mouse with subtle nuclear opacity. Note that the densitometry graph for the heterozygote falls below the horizontal axis and thus seems to be less than the value of the aqueous. Increased scattering in the anterior epithelium will reduce the intensity of incident light reaching the posterior regions of the lens and can result in artificially low levels of scattering intensity. Corrections for this condition need to be considered in lenses having anterior subcapsular opacity. (Panels g to i reproduced with permission.) 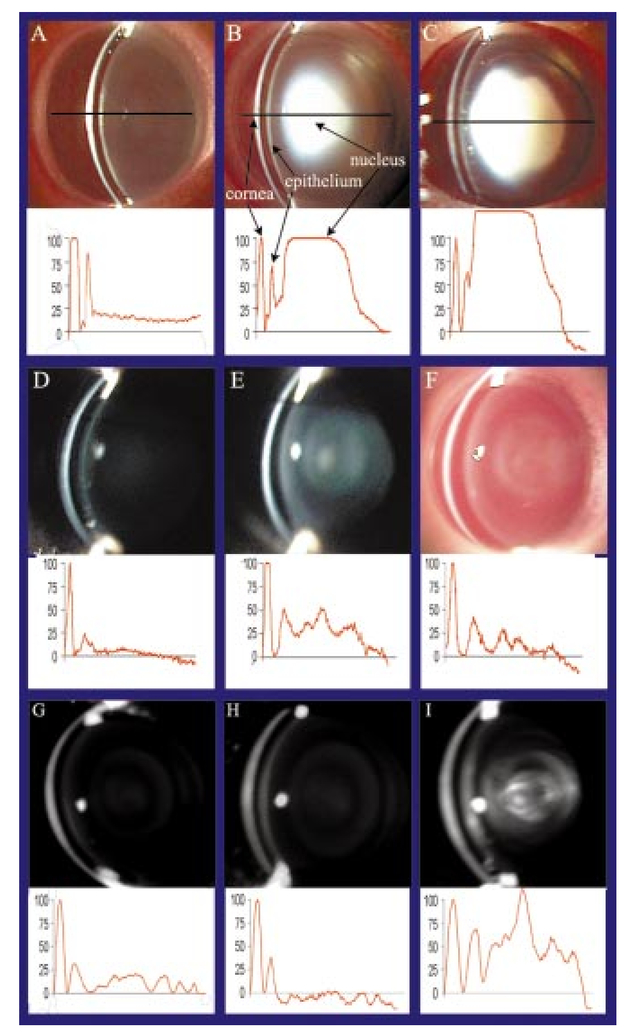 3.Results and ExamplesFigures 2(a) to 2(c) show a series of slit-lamp images from rat pups injected with selenite to produce a dense mature cataract that is obvious at late stages of opacification. A control, uninjected animal [Fig. 2(a)] can be compared with injected animals with stage 4 [Fig. 2(b)] and stage 5 [Fig. 2(c)] cataracts.5 The brightest white curved line to the left of the eye is scattered light from the cornea. Immediately to the right (posterior) is a thin dark band that is the aqueous chamber. The next bright line to the right (posterior) is scattered light from the capsule and epithelium of the lens. The large white mass in Figs. 2(b) and 2(c) is a dense nuclear (central) cataract. (Note: the center of the lens is known as the lens “nucleus.” Historically, the lens was thought to be a single, very large cell and the center was known as the nucleus. Although it is now known that the lens is cellular throughout, the central region of the lens is still known as the “nucleus” and the periphery as the “cortex”.) The thin horizontal black line through the center of each image represents the pixels selected for densitometry that were plotted in the graphs below the slit-lamp images. The corresponding densitometer trace that was plotted using the Image J software is below each slit-lamp view. The first peak in each graph corresponded to the cornea. All three corneal peaks were normalized to the same height, using 100 as an arbitrary value. The second peak corresponded to the lens capsule and epithelium. Lens epithelial cells contain normal organelles and thus are expected to scatter incoming light, and the lens capsule is a basement membrane consisting largely of type IV collagen. These were the major peaks in the graph of the control eye that included the transparent lens. In the graphs for images in Figs. 2(b) and 2(c), a large third peak represented the intense scattering from the nuclear cataract. In Figs. 2(d) to 2(f), a slit-lamp image of a wild-type mouse (d) was compared with two transgenic littermates in which expression of CP49, a lens-specific intermediate filament protein, was disrupted [Figs. 2(e) and 2(f)]. The corresponding densitometer traces are below the slit-lamp view of each eye, representing the quantitative differences between the wild-type mouse, pigmented knock out mouse, and albino knock out mouse. Opacification in the CP49-null mouse model was subtle and not easily characterized or recorded without the system described here. As in Figs. 2(a) to 2(c), the first peak in each graph corresponded to the cornea. See Table 1 for the numerical values of peak heights. The second peak, which corresponded to the lens epithelium and capsule, was highest in the pigmented knock out, lower in the albino knock out mouse, and lowest in the wild-type mouse. The third peak in the pigmented and albino knock out mice, which corresponded to the anterior lens cortex, was not present (thus indicating a clear lens) in the wild-type mouse. The fourth peak, which corresponded to the nucleus of the lens, was very small in the wild type and albino knock out eyes and largest in the pigmented knock out. The densitometer traces quantified the differences between the wild-type control mouse, which had very little lens opacity, and the pigmented knock out lens, which had the most opacity, especially in the nucleus of the lens. The densitometer traces showed directly that the opacity in the albino eye was less than in the pigmented eye; the difference was not just an artifact of color and contrast. Table 1
Figures 2(g) to 2(i) show slit-lamp images of Six5-null mice, which are a model for cataract in myotonic dystrophy in humans. These mice exhibited a subtle opacity in the nuclear core of the lens and a supranuclear layer that was difficult to characterize, requiring the examination of large numbers of animals to obtain statistically significant results.10 4.DiscussionSlit-lamp biomicroscopy is among the most commonly used ophthalmic techniques for subjective assessment of lens transparency and loss of transparency resulting from protein aggregation and opacification. Slit-lamp imaging is cost effective and sensitive to the size, number, and location of scattering centers. While this instrumentation is readily available in most ophthalmology clinics, fewer than 10 of studies on laboratory animals systematically document the progression of cataract, especially at the earliest stages, when it may be possible to modify opacification therapeutically. It is interesting to note that in the small eyes of rodents, a conventional photo slit lamp provides image quality that is similar to the image quality obtained with Scheimpflug optics.14 15 The advantages of the Scheimpflug system are in the examination of the eyes of humans and large animals, in which the depth of field of a conventional and less expensive slit lamp does not permit the entire lens to be in focus (as described in a brief lecture online http://www.columbia.edu/∼akj19/scheimpflug.html). The small diameter of the rodent lens allows the entire lens to be in focus using the optics of a conventional slit lamp. There are no substantial differences in the sensitivity to light scattering either in theory or practice between Scheimpflug and conventional slit-lamp optics. The most sensitive instrumentation for detection of light-scattering structures in rodent or human lenses remains dynamic or quasi-elastic laser light-scattering spectroscopy.17 18 The system described in this paper provides a low-cost, quantitative method for evaluating subtle opacities in living mice without the use of anesthesia. In our experience, repeated anesthesia can result in unfavorable and sometimes fatal responses, even when used under the most careful conditions. Although unanesthetized animals can be difficult to photograph, video recording of the slit-lamp examination and digital storage allows the best images to be selected and analyzed later. Changes in transparency in the entire lens or in a region of the lens can then be compared as a function of age or other experimental condition. The high sensitivity of the system permits an assessment of the minor changes in transparency that occur over time in living animals. For all applications this instrumentation was found to be a very effective method of recording and quantifying lens opacification at the earliest stages of cataract formation. REFERENCES
A. Foster
,
“Cataract—a global perspective: output, outcome and outlay,”
Eye , 13 449
–453
(1999). Google Scholar
J. J. Harding
,
“Viewing molecular mechanisms of ageing through a lens,”
Aging Res. Rev. , 1
(3), 465
–479
(2002). Google Scholar
G. B. Benedek
,
J. Pande
,
G. M. Thurston
, and
J. I. Clark
,
“Theoretical and experimental basis for the inhibition of cataract,”
Prog. Retin Eye Res. , 18
(3), 391
–402
(1999). Google Scholar
T. Hiraoka
and
J. I. Clark
,
“Inhibition of lens opacification during the early stages of cataract formation,”
Invest. Ophthalmol. Visual Sci. , 36
(12), 2550
–2555
(1995). Google Scholar
J. I. Clark
,
H. Matsushima
,
L. L. David
, and
J. M. Clark
,
“Lens cytoskeleton and transparency: a model,”
Eye , 13 417
–424
(1999). Google Scholar
R. Quinlan
and
P. van den Ijssel
,
“Fatal attraction: when chaperone turns harlot,”
Nat. Med. , 5
(1), 25
–26
(1999). Google Scholar
M. D. Perng
,
P. J. Muchowski
,
P. van den Ijssel
,
G. J. Wu
,
A. M. Hutcheson
,
J. I. Clark
, and
R. A. Quinlan
,
“The cardiomyopathy and lens cataract mutation in alpha B-crystallin alters its protein structure, chaperone activity, and interaction with intermediate filaments in vitro,”
J. Biol. Chem. , 274
(47), 33235
–33243
(1999). Google Scholar
A. Alizadeh
,
J. I. Clark
,
T. Seeberger
,
J. Hess
,
T. Blankenship
,
A. Spicer
, and
P. G. FitzGerald
,
“Targeted genomic deletion of the lens-specific intermediate filament protein CP49,”
Invest. Ophthalmol. Visual Sci. , 43
(12), 3722
–3727
(2002). Google Scholar
T. R. Klesert
,
D. H. Cho
,
J. I. Clark
,
J. Maylie
,
J. Adelman
,
L. Snider
,
E. C. Yuen
,
P. Soriano
, and
S. J. Tapscott
,
“Mice deficient in Six5 develop cataracts: implications for myotonic dystrophy,”
Nat. Genet. , 25
(1), 105
–109
(2000). Google Scholar
M. Karbassi
,
P. M. Khu
,
D. M. Singer
, and
L. T. Chylack Jr.,
,
“Evaluation of lens opacities classification system III applied at the slitlamp,”
Optom. Vision Sci. , 70
(11), 923
–928
(1993). Google Scholar
Age-Related Eye Disease Study Research Group. “,
“The age-related eye disease study (AREDS) system for classifying cataracts from photographs: AREDS report no. 4,”
Am. J. Ophthalmol. , 131
(2), 167
–175
(2001). Google Scholar
W. Qian
,
P. Soderberg
,
E. Chen
, and
B. Philipson
,
“Universal opacity standard for Scheimpflug photography,”
Ophthalmic Res. , 32
(6), 292
–298
(2000). Google Scholar
B. Wu
,
C. Medvedovsky
, and
B. V. Worgul
,
“Non-subjective cataract analysis and its application in space radiation risk assessment,”
Adv. Space Res. , 14
(10), 493
–500
(1994). Google Scholar
K. R. Hegde
,
M. G. Henein
, and
S. D. Varma
,
“Establishment of the mouse as a model animal for the study of diabetic cataracts,”
Ophthalmic Res. , 35
(1), 12
–18
(2003). Google Scholar
E. Cotlier
,
“Cataract image analysis system,”
Eye , 13 457
–463
(1999). Google Scholar
M. B. Datiles III
,
R. R. Ansari
, and
G. F. Reed
,
“A clinical study of the human lens with a dynamic light scattering device,”
Exp. Eye Res. , 74
(1), 93
–102
(2002). Google Scholar
R. R. Ansari
,
J. F. King
,
T. Seeberger
, and
J. I. Clark
,
“Early detection of cataract and response to pantethine therapy with noninvasive static and dynamic light scattering,”
J. Biomed. Opt. , 4951 168
–176
(2003). Google Scholar
H. Matsushima
,
L. L. David
,
T. Hiraoka
, and
J. I. Clark
,
“Loss of cytoskeletal proteins and lens cell opacification in the selenite cataract model,”
Exp. Eye Res. , 64 387
–395
(1997). Google Scholar
|
||||||||||||||||||||||||||||||||||||


CITATIONS
Cited by 13 scholarly publications.


