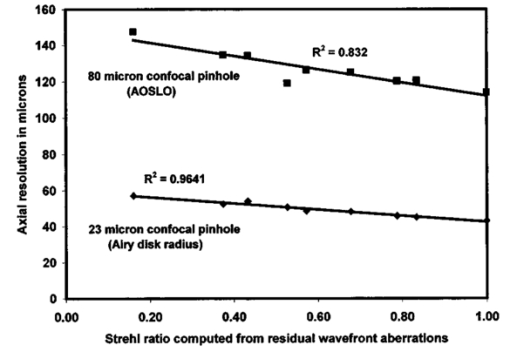
1.IntroductionConfocal imaging systems are attractive because of their enhanced three-dimensional imaging capability.1 The optical system images light scattered from the regions in the neighborhood of the focal plane and this is focused onto a pinhole. The confocal pinhole selectively allows light from a specific thickness of the object to be imaged onto the detector. This enables us to axially section the specimen and generate a three-dimensional view of the specimen itself. Wilson2 discusses at length the role of the pinhole in confocal imaging systems. His analysis was for a scanning laser microscope, and the treatment of aberrations was limited to low-order aberrations only (astigmatism, primary coma, and spherical aberration), which are the only aberrations that are typically present in manufactured optical systems. Our model includes myriad aberrations that can be present in the eye, albeit to a smaller degree, even after correction with adaptive optics (AO). Another important distinction between Wilson’s analysis and ours is that he concentrated on imaging perfect reflectors, rather than diffuse reflectors. A specular reflection retains the phase information that is induced in the first pass of light into the system, whereas a diffuse reflection does not. In the human eye, the retina best approximates a diffuse reflector,3 so that our diffuse reflection model is more appropriate for modeling the performance of the ophthalmoscope. Unlike conventional imaging systems, the scanning laser imaging system discussed in this paper is a double-pass imaging system, which uses identical optics for illumination and observation. Brakenhoff and Muller4 discuss the advantage of a double-pass system and have shown that the full width at half maximum (FWHM) of the point spread function (PSF) of a double-pass system is smaller than that of a single-pass imaging system. For example, in confocal systems with small pinholes, the lateral resolution is about 40 better than conventional diffraction-limited imaging.1 However, image quality in double-pass scanning imaging systems is degraded by aberrations in the same way as conventional imaging systems. In scanning laser ophthalmoscopy, the main source of aberrations is the eye itself, which serves as the objective lens. To overcome the image degradation from ocular aberrations, Roorda et al.;5 incorporated AO into a scanning laser ophthalmoscope (SLO; the instrument will be hereafter referred to as the AOSLO) and they were able to provide the first real-time images of photoreceptors and blood flow in the human retina. The goal of this work is to model and understand the benefits that AO provides to a scanning laser ophthalmoscope, specifically with respect to its ability to enhance efficiency in light detection and improve axial and lateral resolution. We are concerned with the impact of residual aberrations because AO systems do not necessarily correct all the aberrations of the eye. In our opinion, the performance of an AO confocal imaging system depends on two things: (1) the effectiveness of the AO system in correcting for the aberrations and (2) the choice of the appropriate confocal pinhole. The strength of the AO incorporated in the conventional scanning laser ophthalmoscope lies in the fact that the higher-order aberrations are corrected and hence the PSF is much narrower, resulting in an improved resolution as well as a greater concentration of photons through the confocal pinhole. When the object is in the focal plane, the light scattered from the object is focused onto the pinhole and the signal is detected. If the object is positioned out of the focal plane and a defocused spot is formed on the pinhole, then the intensity measured in the detector is greatly reduced. In either case, the structure of the PSF determines the amount of light getting through the pinhole. In the following sections, we describe the model developed to calculate the axial resolution of the AOSLO and discuss the results obtained using such a model. 2.Model-Based Axial Resolution Calculation for the AOSLOThe computation of the axial resolution involves three stages: (1) computing the single-pass PSF on the retina, (2) re-imaging the PSF in the retina to the confocal pinhole plane, and (3) computing the amount of light that passes through the confocal pinhole (which depends on the pinhole size). An unfolded optical diagram of the system is shown in Fig. 1. Each stage is described here. To simplify the analysis, the model uses a magnification of unity between the source, the retina, and the confocal pinhole. Figure 1A diagram of the unfolded optical model of the eye. A light from the origin of the source forms a point spread on the retina. On the second pass, the blur of the retina diffusely reflects back and acts as a secondary source. Passing through the optics, it forms an image outside the eye at the image plane. f is the focal length of the eye. 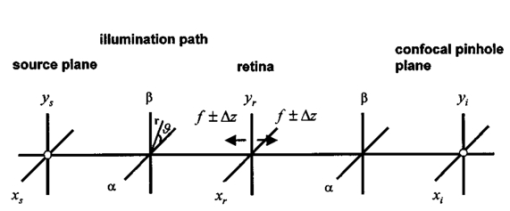 The calculation models a condition where a flat, diffuse reflector is moved through the focal plane of the SLO. This is not the only metric to define axial image quality (for example, one might choose to quantify the resolution between two axially separated point sources), but it is commonly used2 and it is easily measured in an experimental setting.6 7 2.1.Stage 1: Image Formation on the RetinaWave aberrations are two-dimensional functions that can be decomposed into Zernike polynomials, separable in angle and radius, and written in orthogonal form as where n=0, 1, 2 are piston and tilt components, respectively, and an are the coefficients of the corresponding Zernike polynomial zn (ordered according to the standards proposed for use in vision science8). The phase map of the wavefront for each subject in the study is computed from actual wave aberrations, represented by Zernike polynomials. For the diffraction-limited eye, all the Zernike coefficients are set to zero and hence the PSF is the diffraction-limited PSF of the system itself.The AO system in the AOSLO consists of a wavefront sensor for measuring the wave aberrations and a deformable mirror for compensating for the aberrations. A Shack Hartmann wavefront sensor is used to measure the wavefront slopes, and these slopes are modeled using these Zernike polynomials. Based on these coefficients, the appropriate signals are then sent to a deformable mirror to compensate for the aberrations. The sampling of the wavefront by the wavefront sensor and the number of degrees of freedom in the deformable mirror determine the level of wavefront correction, especially the higher orders. In the AOSLO, the wavefront is sampled at 241 locations over a 6.3-mm pupil and the deformable mirror has a continuous surface supported by 37 actuators. After AO correction, we are left with the residual aberrations, which prevent us from reaching the ideal diffraction-limited performance. In our model, these residual aberrations are used to estimate the achievable axial resolution. Phase maps are generated using the residual Zernike coefficients after wavefront compensation using AO. In our case, the Zernike coefficients are calculated for a 6.3-mm pupil, which is the pupil size used most often in the Houston AOSLO. Using the coordinate system in Fig. 1, assuming that the aberrations are introduced in the (α,β) plane, the point spread function at the retinal plane is given by the Fourier transform of the phase map, where P(α,β) is a function defining the shape and size of the pupil, and ϕ(α,β) is the wave aberration function, cast into Cartesian coordinates. The intensity PSF in the retinal plane is where * represents the complex conjugate.2.2.Stage 2: Imaging the Retinal PSF at the Plane of the Confocal PinholeThe AOSLO is a double-pass imaging system in which the same pupil size is used for illumination as well as light collection. The intensity distribution at the confocal pinhole plane is simply an image of the PSF that landed on the retina (assuming that the retina is a uniform diffuse reflector). When the pupil size for retinal illumination and light collection is the same, the intensity distribution at the plane of the confocal pinhole turns out to be the autocorrelation of the single-pass PSF.9 Moving the retina forward or backward slightly results in a defocused single-pass PSF. Under such conditions, the double-pass PSF is still the autocorrelation of the (defocused) single-pass PSF because the light collection path suffers from the same defocus as the illumination path, and hence has the same PSF. Therefore, the double-pass PSF Idpsf measured at the image plane (xi,yi) is where Ipsf and Idpsf are the intensities of the single-pass PSF and double-pass PSF at some fixed axial plane at a distance ±zr on either side of the zero defocus plane.2.3.Stage 3: Integrating the Light through the Confocal PinholeIf c(xi,yi) is a circ function representing the confocal pinhole, with the principal axis of the optical system passing through its center with (x0,y0) defining the origin in the (xi,yi) plane, the total integrated intensity I at different axial positions is where Idpsf(xi,yi,zr) is the double-pass point spread function estimated at various defocus planes along zr, and the confocal pinhole defined over a diameter a in the (x0,y0) plane. In the equation for I(zr), it is assumed that all of the light passing through the pinhole is detected. The FWHM of the axial intensity response I(zr) is a measure of the axial resolution of the system.In order to relate changes in defocus to changes in actual distance, we used a reduced eye model with a power of 60 D and an index of refraction of 1.333 having an emmetropic secondary focal length of 22.2-mm. Although the reduced eye is a poor approximation for a human eye, the important parameter for our computation, the numerical aperture, is about the same. For example, for a 6-mm pupil, the Gullstrand-Emsley schematic eye (described in Ref. 10), which is a more realistic schematic eye, and the reduced eye have numerical apertures of 0.176 and 0.175, respectively. Therefore it is appropriate to use a reduced eye model for axial and lateral resolution calculations. The Zernike coefficients are obtained over a time t, so that z˜n used in our axial resolution calculations is where n=0,1,2…k (in the AOSLO k=65) and 〈…〉 denotes the time average of the Zernike coefficients computed from the slope measurements of the wavefront sensor obtained in real time in the AOSLO.5 The root mean square value (r.m.s) of the Zernike modes, which is the r.m.s. of the wavefront, is computed using the formula, The average r.m.s. of the eight subjects after AO correction are as follows:
Calculations were done for a wavelength of 660 nm. To get proper scaling between the double-pass PSF and the physical pinhole size, we modeled a numerical aperture of the image-collecting optics of 0.03. These factors were chosen to imitate the optical system currently used in the Houston AOSLO. 3.Lateral Positioning of the Confocal Pinhole and its Effect on Axial Resolution MeasurementsAny misalignment in the lateral positioning of the confocal pinhole with respect to the rest of the optics may significantly affect the high-resolution imaging capabilities of the instrument. In the following section we compute the effect of misalignment of the confocal pinhole. We introduce a known amount of misalignment in our computational model and calculate the total intensity at the detector arm, as well as the width of the axial intensity response. If (xk,y0) defines the origin in the (xi,yi) plane, then the intensity I at a defocus position zr with a misalignment x0±xk is given by Eq. (5), with the confocal pinhole centered at (xk,y0). 4.Results4.1.Axial Resolution of the Theoretically Modeled AOSLOThe model calculations were performed and the FWHM of the axial spread function was obtained for pinholes of different diameters. The plots show the pinhole diameter expressed in units that are normalized to the radius of the Airy disk of the optical system. This normalization facilitates the interpretation of the results and allows a direct comparison between similar instruments. With the pinhole sizes normalized in this way, one can easily compute actual pinhole sizes, or the pinhole size projected into retinal coordinates, using the following equation: where λ is the wavelength of light, f is the focal length, n is the index of refraction of the media in which the light is focused, and d is the diameter of the beam forming the image. For example, in the Houston AOSLO, the collector lens in front of the confocal pinhole (in air) has a focal length (f) of 100 mm and the beam diameter at this lens is 3.5 mm (d); hence the radius of the Airy disk at the confocal pinhole (ra) is 23 μm. The pinhole projects into the reduced eye retinal space (6.3 mm pupil diameter) as 2.13 μm. In the Houston AOSLO, we often use a pinhole size of 80 μm, which converts to 3.48 Airy disk units and projects to 7.41 μm on the reduced eye retina.The computations are centered on confocal pinhole diameters of 23 and 80 μm, which are the Airy disk radius of the AOSLO and the confocal pinhole currently used in the AOSLO, respectively. The 23-μm pinhole, which is the Airy disk radius, was chosen because that represents a pinhole size that will result in the highest achievable axial resolution for any imaging system.2 The axial intensity response curves calculated for a typical subject imaged with and without AO using a 23- and an 80-μm pinhole are shown in Fig. 2. The initial r.m.s. without AO is 0.60 μm and the mean r.m.s. after the AO correction is applied is 0.11 μm. For a 23-μm pinhole, we could see at least a fourfold increase in the axial resolution with AO, and for an 80-μm confocal pinhole, we observed at least a twofold increase in axial resolution with AO. A comparison of the axial intensities with and without AO obtained using a 23-μm confocal pinhole shows at least an eightfold increase in the peak intensity of the axial spread function with AO, and an 80-μm confocal pinhole shows a 2.5 times increase in peak intensity of the axial spread function with AO compared with that obtained without AO. Figure 2Axial intensity responses with (solid lines) and without (dashed lines) AO. The bottom pair of lines is for a confocal pinhole diameter equal to the Airy disk radius of the light collection optics in the AOSLO (23 μm), and the top pair of lines is for an 80-μm confocal pinhole. The subject had an initial r.m.s. wave aberration of 0.60 μm; after AO correction it was reduced to 0.11 μm. 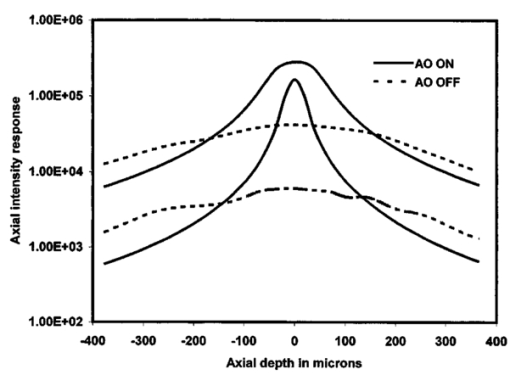 Figure 3 shows a plot of the computed axial resolution as a function of pinhole size for all the eight subjects used in our study. The expected axial resolution of the AOSLO differs among subjects because the residual aberrations determine the limit of axial resolution. There is a flattening of the curve that occurs as the pinhole size is reduced beyond the radius of the Airy disk (similar to what was observed by Wilson2), confirming that a pinhole that has a diameter equal to the radius of the Airy disk of the collection optics is the optimal pinhole size for the axial resolution, as long as photons are not limited. The FWHM of the axial intensity response increases (implying a decrease in axial resolution) linearly with the pinhole diameter. Figure 3The FWHM of an axial intensity response estimated for different pinhole diameters. Residual aberrations after AO correction determine the axial resolution. The line with short dashes is for a subject who had not been corrected with AO and who had an r.m.s. wave aberration of 0.53 μm. The line with long dashes is for a diffraction-limited model eye, and the solid lines are for the eight subjects after the best AO correction. 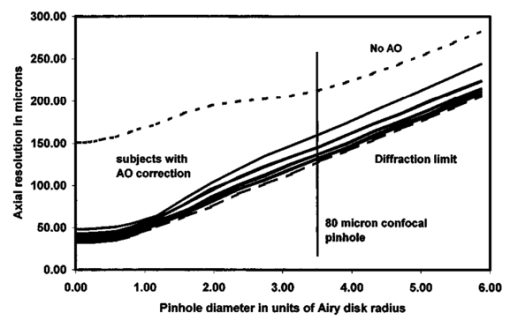 A plot of peak intensity of the axial intensity profile as a function of the pinhole diameter is shown in Fig. 4 for the eight subjects included in this study. All curves asymptotically tend to the same value once the pinhole size is large enough to capture the whole PSF, but the rate of increase in detected intensity is highest when aberrations are lowest. Reducing the pinhole size from 80 μm to a pinhole of Airy disk size (23 μm) results in a reduction of peak intensity by roughly 50 to 60 for the average AO-corrected eye in our study. Below the Airy disk radius, the peak intensity falls off sharply, whereas the FWHM of the axial intensity asymptotes at a constant FWHM, depending on the residual aberrations. Confocal pinhole diameters that are close to the Airy disk radius would, therefore, enhance the axial resolution, but at the cost of lowering the number of photons available for imaging. Figure 5 is the plot of the r.m.s. of the Zernike orders for each of the eight subjects included in this study. Subject a8, who had the highest residual aberration of all the subjects, also had the broadest FWHM of the intensity response and the lowest detected intensity. Figure 4Plot of the peak intensity of an axial intensity profile for different pinhole diameters. The line with short dashes is for a subject who had not been corrected with AO and who had an r.m.s. wave aberration of 0.53 μm. The line with long dashes is for a diffraction-limited model eye, and the solid lines are for the eight subjects after the best AO correction. 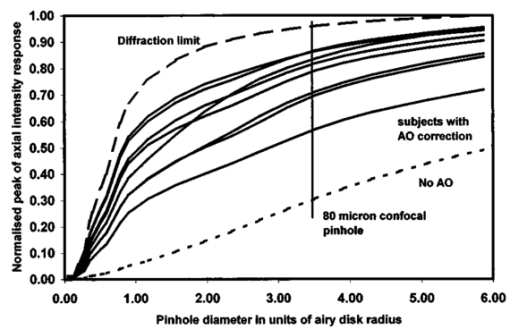 Figure 5The residual r.m.s. of Zernike orders of eight different subjects used in our study. The panel is arranged in order of decreasing axial resolution for different subjects whose axial resolution was computed from these residual Zernike coefficients. 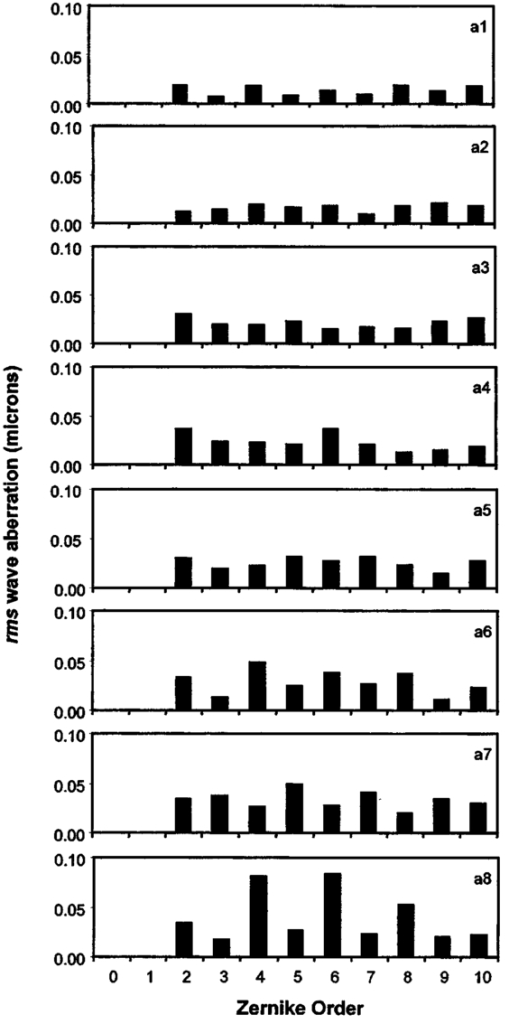 When the r.m.s. of the wave aberration is less than (λ/2π), the Strehl ratio is given approximately by the expression11: where Idpsf is the maximum intensity of the PSF with residual aberrations after AO correction, Idpsf(ϕ=0) is the maximum intensity in the diffraction-limited case, and λ is the wavelength of light used for imaging. For an AO-corrected wavefront, it is safe to assume that r.m.s.<λ/2π and the r.m.s. is calculated as described in Eq. (7).Figure 6 is a scatter plot of peak intensity of the axial intensity response curves calculated from the residual aberrations versus the FWHM of the axial intensity response. Figure 7 is a scatter plot of the Strehl ratio max(Idpsf)/max(Idpsf(ϕ=0)) calculated directly from the r.m.s. wave aberrations versus the FWHM of the axial intensity response of the subjects in our study for an 80-μm confocal pinhole. We can see that the axial resolution of a subject is proportional to the Strehl ratio. From this figure, we also see that the FWHM of the best AO-corrected wavefront can lead to an effective axial resolution of approximately 48 μm and the diffraction limit is approximately 45 μm for a confocal pinhole of a size equal to the Airy disk radius of the AOSLO; however, the peak intensity drops off by approximately 50. Assuming that photon noise is the only source of noise, the signal-to-noise ratio in the image reduces by about ⊡2 times the signal-to-noise ratio obtained using an 80-μm confocal pinhole. Figure 6A scatter plot of the FWHM of the axial intensity response of different subjects versus the normalized peak intensity of the axial intensity response (measure of Strehl ratio) for an 80-μm confocal pinhole and for a 23-μm confocal pinhole, which is the Airy disk radius of the collection optics of the AOSLO. The peak intensities are normalized to the peak intensity of the axial intensity response of the diffraction-limited model eye. 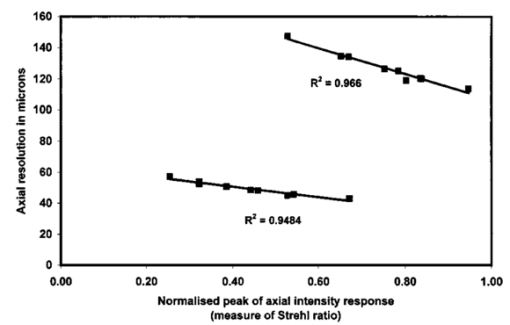 4.2.Effect of Lateral Misalignment of the Confocal PinholeTo investigate the role of a misaligned pinhole, we do the following: Misalignments in the pinhole ranging from 0 to 5 μm are introduced by laterally displacing the pinhole on either side of the optical axis, and the axial intensity response is calculated. After AO correction, the PSF at the confocal pinhole is compact and symmetric and therefore it affects the axial resolution symmetrically for any misalignment on all directions in the confocal pinhole plane. Figure 8 shows the point spread function at the confocal pinhole plane with and without AO. The percentage of intensity getting through the confocal pinhole to the detector plane is calculated and normalized to the intensity at the detector plane at zero misalignment. Figure 9 shows, on one hand, the FWHM of the axial intensity response for 23- and 80-μm diameters of the confocal pinhole plotted as a function of the misalignment of the confocal pinhole. Figure 10 is, on the other hand, the plot of the percentage decrease in intensity for misalignments from 0 to 5 μm for different pinhole sizes for (1) the subject with highest residual r.m.s. (2) the subject with the lowest residual r.m.s. and (3) for the diffraction-limited eye. Figures 9 and 10 demonstrate, however, that only the small pinhole is sensitive to misalignments. Axial resolution degrades and intensity drops rapidly with small misalignments with the smaller confocal pinhole. In the case of a 23-μm confocal pinhole, for the subject with the highest residual aberrations there is about an 80 increase in FWHM compared with the FWHM at zero misalignment (decrease in axial resolution), and a corresponding drop in detected intensity of about 70 for a misalignment of 5-μm in the pinhole position. For the 80-μm confocal pinhole, small misalignments cause small improvements in the axial resolution and only a negligible drop in detected intensity. Figure 8The left panel is the double-pass PSF with AO compensation and the right panel is the double-pass PSF without AO compensation, at the confocal pinhole plane. We see that the PSF is more symmetric after AO correction. The scale bar represents 23 μm or one Airy disk radius (for the light collection optics). 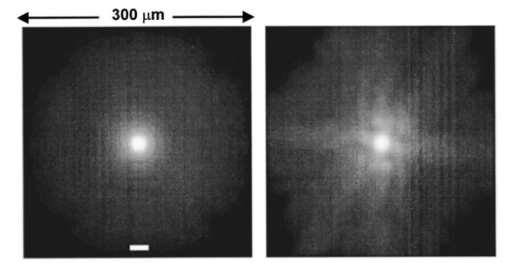 Figure 9The axial resolution plotted as a function of the misalignment of the confocal pinhole. Solid circles, diffraction-limited eye; triangles, subject with lowest residual aberrations; squares, subject with highest residual aberrations. The lower and upper curves are for the 23- and 80-μm pinholes, respectively. 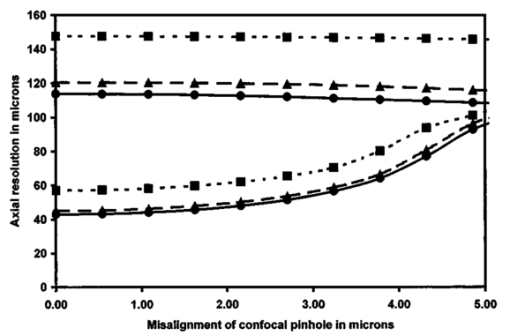 Figure 10A plot of the fractional loss in intensity as a function of misalignment of the confocal pinhole. Solid circles, diffraction-limited eye; triangles, subject with lowest residual aberrations; squares, subject with highest residual aberrations. The lower and upper curves are for the 23- and 80-μm pinholes, respectively. Note the higher dependence on the alignment of the confocal pinhole for the smaller pinhole. 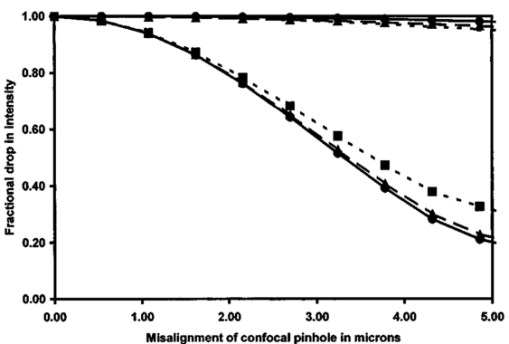 5.DiscussionThe results presented here represent important reference information that will guide our efforts toward optimizing the AOSLO for maximum imaging performance. The main outcome of the study is that the residual levels of aberration left after AO corrections do not impose a large limitation on axial resolution performance. Figure 3 shows that on average, the axial resolution for the AO-corrected eyes is ∼129 μm, which is 12 worse than the no-aberration case (for an 80-μm pinhole). Rather, the main limit to axial resolution is imposed by the size of the confocal pinhole. For pinhole sizes that are larger than the radius of the Airy disk of the collection optics, the pinhole size and FWHM of axial resolution are linearly related. However, the residual levels of aberrations after AO correction do cause large losses in the amount of light that can be detected. On average, the decrease in intensity with an 80-μm pinhole is ∼30 compared with the aberration-free eye. For high-magnification ophthalmoscopy, a decrease in the detected light levels is a concern because retinal safety imposes limits on how much light can be used to illuminate the retina,12 and the retina is a very weak reflector.13 In the Houston AOSLO, we operate with light levels that are well below hazardous levels, and because the retina is such a weak reflector, our dominant noise source is photon noise. Therefore, improving axial resolution by using smaller confocal pinholes may be facilitated only by improved performance of the AO system. Improvements in AO performance can be achieved through real-time AO operation and/or by having a higher number of actuators for correcting higher-order aberration modes, both of which have been demonstrated to improve performance in the Rochester second-generation adaptive optics ophthalmoscope, which is a conventional imaging system without axial slicing capabilities.14 We showed that when the aberrations are low, the axial resolution is linearly related to the Strehl ratio, whether calculated from the r.m.s. of the residual wave aberration, or from the PSF itself. This result demonstrates that after AO correction, the r.m.s. alone should be sufficient to predict the experimental axial resolution. We are planning to do experiments to test this hypothesis. The subjects whose axial resolution is higher in our calculation (a smaller FWHM) have correspondingly higher peak intensities of the axial resolution profile. This may not be the case in an experiment since the absorption of photons by the retina varies among individuals,13 and this has not been taken into account in our calculations. Therefore, the axial intensity profile discussed here depends only on the aberrations and not on the reflective properties of the retina for a specific subject. Based on the reflective quality of the retina, the confocal pinhole diameter can be chosen for the best possible axial resolution to obtain a reasonable signal-to-noise ratio in the images. Using smaller confocal pinholes will improve axial resolution, but the requirement for a better optical alignment between the confocal pinhole and the rest of the optical system can inhibit obtaining images with a good signal-to-noise ratio. The demands on alignment of the confocal pinhole are higher as the confocal pinhole diameter gets closer to the Airy disk radius, for which we see significant drops in peak intensity with misalignments of a few micrometers (Fig. 10). We can also see that when the pinhole diameter is considerably larger than the Airy disk radius, the effects of pinhole misalignment are less significant, for both intensity and resolution. It is worth noting here that in some cases, the axial resolution can improve slightly with a pinhole misalignment, at little cost to the peak detected intensity. All calculations have been done assuming a plane diffuse-reflecting object with isotropic reflectivity and a reduced model eye with no absorption and no scattering. However, no plane diffuse-reflecting features exist in the retina. In previous reports, axial resolution has been reported for features such as blood vessels6 15 and the surface of the nerve fiber layer,7 16 which only approximate diffuse reflectors. The actual resolution that one will obtain will depend on the specific retinal feature, and therefore the ability to resolve layers in axial depth for that specific feature may be worse than what is reported here. 6.ConclusionsWe have discussed in this paper a theoretical model developed to optimally choose the confocal pinhole to improve the axial sectioning capabilities of an AO scanning laser ophthalmoscope. The optimal confocal pinhole choice will be the one for which the axial spread function has a small FWHM and a high peak intensity. For example, with the present AOSLO, if an axial resolution of 60 μm is desired, then the confocal pinhole diameter would have to be about 35 μm (1.5 times the Airy disk radius), but in our current system this would result in a relative reduction in peak intensity to 30 compared with what would be detected through large pinholes. Only superior AO performance can help us achieve lower axial resolution without appreciable loss in intensity. We have also shown that since the AO-corrected r.m.s. wave aberration is low (r.m.s.<λ/2π), we are in a regime where r.m.s. values alone can be a good predictor of the axial resolution. AcknowledgmentsThis work was supported by grants from the National Science Foundation’s “Center for Adaptive Optics,” a Science and Technology Center managed by the University of California at Santa Cruz under cooperative agreement No. AST-9876783, and National Institutes of Health Grant NEI RO1 EY-13299 to AR. REFERENCES
L. Diaz Santana Haro
and
J. C. Dainty
,
“Single-pass measurement of the wavefront aberration of the human eye using retinal lipofuscin autofluorescence,”
Opt. Lett. , 24 61
–63
(1999). Google Scholar
G. J. Brakenhoff
and
M. Muller
,
“Improved axial resolution by point spread autocorrelation function imaging,”
Opt. Lett. , 21
(21), 1721
–1723
(1996). Google Scholar
A. Roorda
,
F. Romero-Borja
,
W. J. Donnelly
,
H. Queener
,
T. J. Hebert
, and
M. C. W. Campbell
,
“Adaptive optics scanning laser ophthalmoscopy,”
Opt. Express , 10
(9), 405
–412
(2002). Google Scholar
A. W. Dreher
,
J. F. Bille
, and
R. N. Weinreb
,
“Active optical depth resolution improvement of the laser tomographic scanner,”
Appl. Opt. , 28 804
–808
(1989). Google Scholar
P. Artal
,
S. Marcos
,
R. Navarro
, and
D. R. Williams
,
“Odd aberrations and double-pass measurements of retinal image quality,”
J. Opt. Soc. Am. A , 12 195
–201
(1995). Google Scholar
F. C. Delori
and
K. P. Pflibsen
,
“Spectral reflectance of the human ocular fundus,”
Appl. Opt. , 28 1061
–1077
(1989). Google Scholar
H. Hofer
,
L. Chen
,
G. Yoon
,
B. Singer
,
Y. Yamauchi
, and
D. R. Williams
,
“Improvement in retinal image quality with dynamic correction of the eye’s aberrations,”
Opt. Express , 8
(11), 631
–643
(2001). Google Scholar
R. Birngruber
,
U. Schmidt-Erfurth
,
S. Teschner
, and
J. Noack
,
“Confocal laser scanning fluorescence topography: a new method for three-dimensional functional imaging of vascular structures,”
Graefe's Arch. Clin. Exp. Ophthalmol. , 238
(7), 559
–565
(2000). Google Scholar
|
CITATIONS
Cited by 54 scholarly publications.
Confocal microscopy
Adaptive optics
Point spread functions
Eye
Imaging systems
Retina
Eye models

