1.IntroductionThe clinical appearance of the normal macula lutea, either in standard fundus photographs or through the ophthalmoscope, is a composite of complex light reflection from and absorption by multiple layers of the retina and associated structures.1 Color fundus photographs have been routinely employed for diagnostic purposes for many years and are central to clinical studies of macular disease.2 3 4 5 6 7 8 9 10 11 12 13 14. There has been continued interest in the use of digital techniques for quantification of macular pathology, particularly drusen, over the past two decades.15 16 17 18 19 20 The systematic study of drusen resorption following laser photocoagulation also underscores the importance of drusen measurement and recognition.7 8 9 21 22 23 24 However, despite progress, none of the digital methods have gained widespread use. As an image analysis problem, a major difficulty in the segmentation of macular pathology is that the reflectance of the normal background, on which the pathology is superimposed, is inherently nonuniform. For example, absorption by luteal pigment in the central macula (fovea and parafovea) is superimposed on whatever the underlying reflectance might be. Hence, given two anatomically identical drusen, one in the center of the fovea and one 1500 μm distant, the observer will see them differently in the fundus photograph. The outlying drusen will appear brighter and larger than its identical counterpart. With training, the human eye makes allowances for this variability, but a computer applying a threshold does not. Our approach to this problem has been to study the geometric patterns on the background in the green channel of normal fundus images. A suitable pattern could then be used to correct a fundus image showing pathology to obtain the gray level of the specific pathology, independent of the background. This in turn would allow accurate segmentation by a threshold. This is not, however, the standard technique of shading correction by subtracting or dividing by a blur image.25 These standard techniques (also used here) are useful for shading correction on large scales. As we will see, however, the foveal gray level changes over ranges of distance (50 to 100 μm) that are comparable to the size of the pathological structures of interest. Hence, subtracting the variation on this scale would tend to remove such structures from the image. Previous work has quantitatively documented the central fovea as a point of minimum reflectance using spectral imaging and spectral reflectometry.26 To our knowledge, this is the first two-dimensional description of this geometry, in our case using the green channel in normal foveal and parafoveal images from color fundus photographs as a surrogate for reflectance. These patterns, inapparent in the original photographs, are achieved with inexpensive commercial imaging software using a desktop computer. A more sophisticated mathematical model (two-zone elliptic quadratic polynomials) can approximate the foveal data, which are an indirect measure of the density of pigmentation and its geometric distribution. The ability of the model to reconstruct the foveal data from selected pixels suggests promise in digital quantitation of drusen. 2.Methods2.1.SubjectsThe fundus images studied consisted of 40 good-quality color photographs of 20 eyes of 14 patients with normal maculas selected retrospectively from the files of the authors. For the patients older than 60 years, maculas were deemed normal for that age if there was no eye disease affecting the posterior pole. In particular, patients with signs of age-related maculopathy or drusen were excluded. Images with either a bright photographic artifact or significant pigment thinning (e.g., myopia) with baring of choroidal vessels were also excluded. The ages of the patients ranged from 27 to 77 years (median of 61). There were 7 male and 7 females; 10 were white, 2 were black, 1 was Asian, and 1 was Hispanic. 2.2.Image AcquisitionStandard film-based color fundus photographs (Topcon 50EX camera, Topcon Corp., Tokyo; Ektachrome 64 Professional film, Kodak Corp., Rochester, New York) centered on the macular regions were scanned and digitized (CoolScan LS-1000 and LS-2000, Nikon Corp., Tokyo, and Scanjet 6300, Hewlett-Packard (HP) Corp., Palo Alto, California) at resolutions of 2700 pixels/inch (Nikon) and 1200 pixels/inch (HP). All images had been taken at 35 deg except for a few taken at 50 deg. These 50-deg images were in addition to 35-deg images of the same subject. Different scanners were used as they became available. Because no significant differences were found in the digital images for purposes of this study, all scanner data have been combined. The images were saved as 24-bit RGB TIFF files, with 256 gray levels for each color channel. One patient had had 35-deg photographs taken of decentered fields in both eyes; these fields were situated one to two disk diameters (DD) superiorly, inferiorly, nasally, and temporally. Since red-free and color imaging are both useful in ophthalmic practice and research, we felt it was important to include at least some red-free images in the present study for comparison. Red-free photographs had also been obtained using a green filter with black-and-white film. The black-and-white film was scanned as 24-bit color to provide 256 gray levels for analysis, rather than the 100 gray levels available in Photoshop gray-scale images. The color channels were virtually identical, and the green channel of the result was studied. 2.3.Image ProcessingFor uniformity of processing, all images were resized in Photoshop with bicubic interpolation so that the distance from the center of the macula to the temporal disk edge was 490 pixels. This macula-disk distance (3000 μm)27 is the usual constant of reference in clinical macular grading systems.12 13 A common clinical alternative, the disk diameter, is subject to more congenital variation.28 29 We also preferred this approach to resizing based on published camera magnification because we did not find the Topcon50EX to be telecentric.30 For 35-deg photographs, we generally resized to 1350 pixels per inch to achieve the desired distance from fovea to disk. For slides scanned at 2700 pixels/inch on the Nikon scanners, this reduced the image area by a factor of 0.25 while maintaining adequately high resolution. In particular, we noticed no effect on the clinical appearance of the image or in the patterns analyzed in this study. We also scanned a few images directly on the Nikon scanner at 1350 pixels/inch, with no noticeable change in image patterns. Likewise, images scanned on the HP scanner at 1200 dpi required increasing the image area by 1.27, without a noticeable change in the image or pattern. All image processing and measurement was performed completely within commercially available software (Photoshop 5.5, Adobe Systems Inc., San Jose, California) on a desktop personal computer. Two basic regions were studied: a 1500-μm-diameter area centered on the fovea (fovea), and a 3000-μm-diameter area centered on the fovea (parafovea). Note that our parafoveal region is a disk, not the annulus used clinically, and is larger than that usually defined clinically. The first step was to correct for the large-scale variation in reflectance that results from the nonuniform illumination of the fundus during photography. The process of large-scale shading correction was carried out independently on each of the three color channels, and the results combined as a new RGB color image. Specifically, each channel was copied, blurred (Gaussian blur, 535-μm half-maximum radius), and then subtracted from the original, with constant offset values: 195 for red, 125 for green, and 75 for blue. This is distinct from a difference-of-Gaussian operation, which requires a much smaller kernel size for a Gaussian filter operation. The offsets were chosen by trial and error to produce a color-balanced, shading-corrected fundus image recognizable to the human eye (Fig. 1). We found this human recognition of fundus features essential to understanding our results. (We tested the Gaussian blurs in Photoshop and found they all have half maxima at radii that are 19 greater than the stated radii. Hence, the large-scale blurring of 535-μm half-maximum radius was done with the Gaussian of stated radius 450 μm in Photoshop. All Gaussian blurs are given with their true half-maximum radii.) Figure 1Shading correction and color balancing of a fundus image (53-year-old Caucasian female subject). (a) Original digitized image. (b) Shading-corrected, color-balanced image, in which large-scale photographic variation has been removed, but small-scale variation (central macular darkness) is preserved. Note that shade correction eliminated the inferotemporal shadow, which is visible in the original. 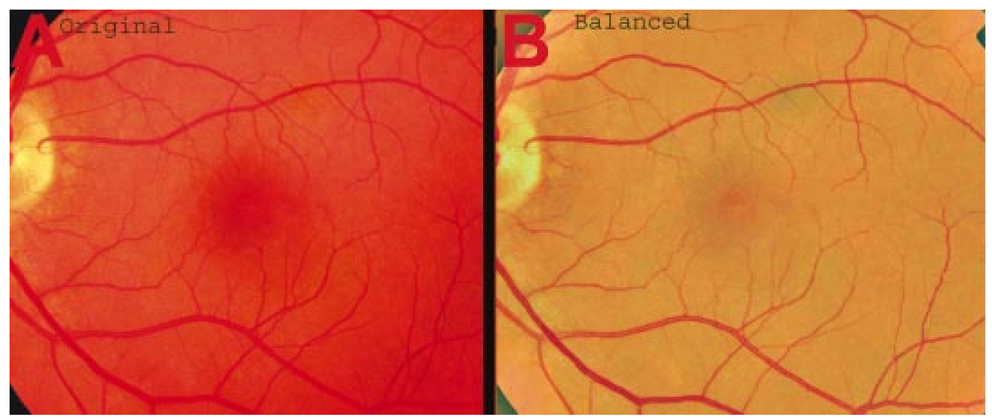 After shading correction and color balancing, the foveal region (1500 μm) was filtered on a small scale (Gaussian blur, 178.5 μm radius) to remove noise and high frequency components while preserving image variability over approximately 150 to 200-μm intervals. The more complex parafovea (3000 μm) was filtered on a larger scale (Gaussian blur, 238-μm radius) in a separate copy of the image. These blur radii were determined on a trial-and-error basis to provide the best patterns for analysis. Through these trials we determined that although quantitative details would differ slightly, our main geometric findings would be the same for blur radii within 10 of those chosen. For convenience in nomenclature, we have termed the set of pixels with a constant gray level an “isobar.” Each channel of the filtered image is thus naturally segmented into a collection of isobars, one for each observed gray-level scale value. In practice, the fovea segments into eight to fifteen isobars, each separated from its neighbor by one unit step of gray-level scale value. The pattern of the isobars could now be studied without further digital manipulation. However, since unit steps of gray-level values are imperceptible to the human eye, a contrast-enhancing histogram stretch (Photoshop, Auto levels) was applied for the human observer, as well as for illustration. Once contrast was enhanced, the isobars were unchanged as sets, but neighboring isobars were separated by several units of gray level and were easily distinguishable. It is important to be aware that absolute gray levels are not meaningful after this step. For reasons that are described in Sec. 3, all further analysis was carried out in the green channel. We sought to find the best geometric description of the isobars from real data, in particular, to see whether they followed the overall oval geometry of the macula. Hence, we postulated theoretical isobar patterns to be elliptical and globally convex (in the mathematical sense that a line connecting any two points of an isobar would be contained within that isobar and the isobars of a lesser gray level). We expected that the real patterns would be neither precisely elliptical nor strictly convex, but very close to both except where retinal vessels impinged. 2.4.Retinal VesselsTo examine the contribution of retinal blood vessels to the isobar pattern, the patterns from four typical parafoveal images were analyzed after a 238-μm radius Gaussian blur and contrast enhancement. Retinal vessels were chosen in an area of the original image corresponding to a peripheral darkening of the pattern; these vessels were then masked on the original by manually and sequentially replacing small segments of the vessels with adjacent background color. The patterns were then regenerated and compared qualitatively with the originals. 2.5.Range of the Foveal Shading PatternGray levels of the foveal data were measured in the green channel. One representative image of each of the twenty normal maculae was measured after shading correction. The minimum, which was always at the foveal center, and the maximum, which was always at the periphery, were determined, as was the difference between the maximum and the minimum. The mean, range, and standard deviation of each of these were tabulated. 2.6.Mathematical ModelThe pixel gray levels were considered to be functions of their pixel coordinates (x,y) in the x-y plane. The general quadratic q(x,y)=ax2+bxy+cy2+dx+ey+constant in two variables was fit by custom software employing least-squares methods to the dataset of green channel gray levels in the fovea (1500-μm diameter) to optimize the six coefficients (a, b, c, d, e, constant). This function was chosen because the level sets defined by q(x,y)=constant are conic sections, of which ellipses are one, and our observation was that the foveal isobars defined by a constant gray level most closely resemble ellipses. In the two-region model, a central disk of darker luteal pigment was taken as region one. This region was estimated directly on the original, shading-corrected and color-balanced image, and generally was about 500 μm in diameter. The surrounding annulus was region two. A quadratic q1 was fit to the data in the luteal region and a second quadratic q2 to the data in the annulus (twelve coefficients total). Five foveal images were studied in all at a resolution of 1350 pixels/inch (two images were scanned directly, the rest were resized from scans at 2700 pixels/inch). The original data and the smooth fits were displayed as contour graphics in the program Mathematica (Wolfram Research Inc., Champaign, Illinois). We also tested the ability of the model to reconstruct the foveal data in these images from limited numbers of selected pixels. 3.Results3.1.Normal Foveal PatternThe filtered and enhanced green channel from a color fundus photograph exhibited concentric elliptically shaped foveal patterns in all 40 images from 17 eyes. The patterns were essentially all convex in the fovea, and then became nonconvex (generally star shaped) in the peripheral fovea or parafovea with the incursions of the retinal vessels (see later discussion). The green channel from Fig. 1(b) is shown in Figs. 2(d), 2(e), and 2(f). Examination of the other color channels showed that the gray-level patterns were also generally radially increasing, but the consistency of this finding varied (Fig. 2). The pattern in the red channel [Figs. 2(a)–2(c)] was similar to the green image, but it was not as finely resolved, and was not always convex [Fig. 2b]. The blue channel [Figs. 2(g)–2(i)] frequently contained nonconcentric patterns, and generally revealed coarser resolution and a less regular pattern, especially in the 3000-μm zone. Figure 2Contour pattern of gray-level gradients in the normal macula from Fig. 1(b), as seen in the individual color channels. The yellow rings denote the fovea (1500-μm diameter) and parafovea (3000-μm diameter). (a) to (c) The red channel of the fundus image before (a) and after filtering and contrast enhancement in (b) the fovea (magnified 3×) and (c) the parafovea (magnified 1.5×) . (d) to (f) The green channel of the same image before (d) and after image processing in (e) the fovea and (f) the parafovea. (g) to (i) The blue channel (printed in gray scale for better reproduction of detail) before (g) and after image processing in (h) the fovea and (i) the parafovea. The image filtration and enhancement are done on a larger scale for the 3000-μm areas than for the 1500-μm areas (see text). Hence these patterns differ. The red channel pattern is decentered and kidney shaped. The green channel pattern is centered and convex. The blue channel patterns are significantly coarser than either the red or green. Note that none of this structure is apparent in the original photograph [Fig. 1(a)]. 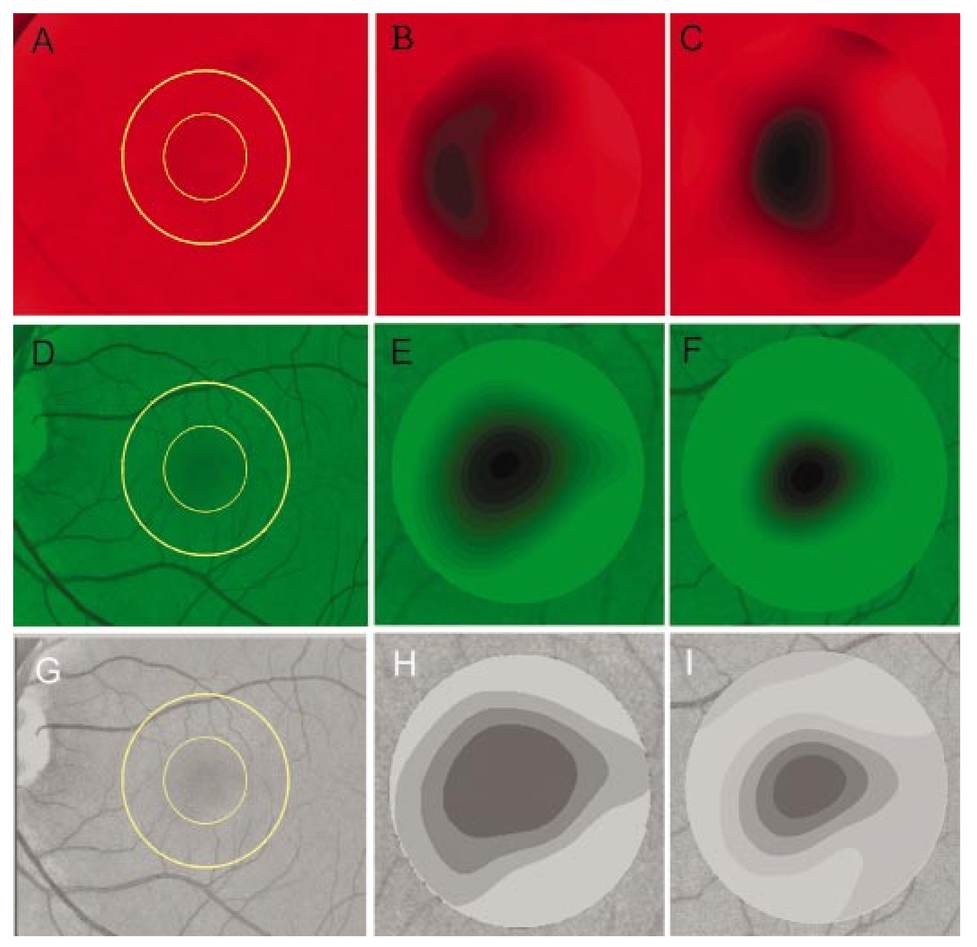 Further analysis of the shade-corrected, color-balanced images was carried out in the green channel for several reasons. First, as in the example given earlier, the patterns in the red channel were sometimes found to be irregular and dependent on details of ocular pigmentation. Second, the range of gray-level values in the blue channel was limited in most of the images studied, often with artifacts that predominated. While the latter problem in the blue channel was not experienced with four high-resolution images acquired on a digital fundus camera (Zeiss FF4, Carl Zeiss Meditec AG, Germany), we have limited the present study to the more common film and scanner-based technology. And finally, we, as others, have found the green channel to be best for drusen identification.15 The gray levels in the green channel increased from the darkest center to the edge of the fovea along any radius. The isobar corresponding to the lowest gray level was a central ellipse, around which the higher isobars formed concentric elliptical annuli. The center of this disk, usually about 200 to 500 μm in diameter, was situated at the anatomical center of the fovea, as determined by comparison with the original color photograph. The most central isobars were nearly circular, with an elliptic character developing with greater radial distance. Where a larger retinal vessel extended into the fovea, the convex pattern could be broken with a darker infolding peripherally (see later discussion). 3.2.Determination of Isobar ResolutionThe annular isobars around the center disk were all complete until an outer ring reaching the boundary of the foveal region became a partial annulus. The gradient of gray level in the foveal region was described quantitatively as the isobar resolution, a measure defined as the radius of the fovea, nominally 750 μm, divided by the number of complete isobars in the foveal pattern (Fig. 3). This definition is equivalent to the average width of an isobar; hence, it is a measure of how finely the isobars divide the fovea. The isobar resolution in the parafovea was similarly defined as 1500 μm divided by the number of complete isobars in the parafoveal pattern. Figure 3Determination of isobar resolution (normal 46-year-old black male subject). The foveal data are filtered and enhanced in the green channel. (a) A magnified view of the foveal area (1500 μm) segmented into isobars, with the twelfth isobar (counted from the center) being the last complete isobar. (b) The twelfth isobar is darkened for emphasis. The resolution of this image is 63 μm (750 μm/12; see text).  In the fundus image shown in Fig. 2, the green channel gave isobar resolutions in the fovea of 58 μm [Fig. 2(e)] and parafovea of 120 μm [Fig. 2(f)]. Measurements of 20 normal eyes from 14 individuals yielded an average foveal isobar resolution of 71±15 μm (mean±standard deviation; range 19 to 98 μm). We did not find any major differences in these patterns or their isobar resolutions with respect to age, race, or sex in this small sample. The patterns found in the 50- and 35-deg photographs of one subject were essentially the same. 3.3.Variation of Pattern with PhotographTo verify that the essential features of convexity and concentricity were preserved under conditions of different photographic centrations, and to assess the impact of variable illumination with different centrations, we considered the following two groups of images: The first group consisted of 11 well-centered images of 5 eyes of 4 patients. The second group consisted of 14 decentered images of 3 eyes from 2 patients. We measured the pattern isobar resolution as defined earlier. The data for the well-centered image group showed that the isobar resolutions differed by no more than 9 μm for photos of the same eye. An example of a pair of patterns from such images is shown in Fig. 4. The patterns in Fig. 4 have quite similar overall shapes in addition to comparable isobar resolutions. We found a close resemblance of pattern pairs from the same eye in the other images from this group as well. Figure 4The pair of images (a) and (b) shows the patterns in two well-centered photographs of the right eye of the subject in Fig. 3. The patterns are horizontally elliptical and otherwise closely resemble each other, with some minor variation in shading superiorly; the isobar resolutions are 75 and 84 μm. 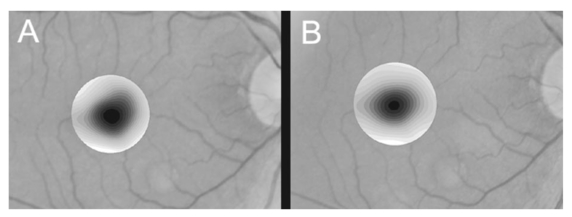 For the decentered images, the patterns remained concentric and convex, but the isobar resolutions were more variable. For one patient, centered and decentered photographs of both eyes were available (see Sec. 2). In the photos of the left eye (OS), the patterns of two centered photos were nearly circular, with 67- to 75-μm isobar resolutions. In three decentered photos of OS, the patterns were more horizontally elliptic, with isobar resolutions varying from 75 to 175 μm. In the centered photo of the right eye (OD), the pattern was again more circular, and in the remaining four decentered photos of OD, more horizontally elongated. In the four photographs of OD with comparable decentrations taken with black-and-white film through a green filter (“red-free” photos), the gray-level patterns in these images were similar to the green channel patterns in the corresponding color photos. The isobar resolutions of all nine photos of OD ranged between 54 and 94 μm. Figure 5 illustrates a case of pattern variability with photograph centration. Here the overall appearance of the three patterns is quite similar except in the nasal quadrant; the measured isobar resolutions (94, 75, and 75 μm, respectively) also differ, owing to a greater elongation of one pattern nasally. Figure 5Pattern variation with photographic decentration. (a) Photograph of a normal macula (76-year-old Caucasian male subject) decentered 750 μm inferiorly. (b) Photo of the same macula decentered 1500 μm temporally, and (c) decentered 3000 μm superiorly. The target in each image marks the photo centration. The overall appearance of the three patterns is quite similar, but elongation of the first pattern (a) in the nasal meridian increases the measured isobar resolution [95 μm for (a), 75 μm for (b) and (c)]. The radial isobar resolutions in the temporal, superior, and inferior meridians are essentially the same for all three patterns. 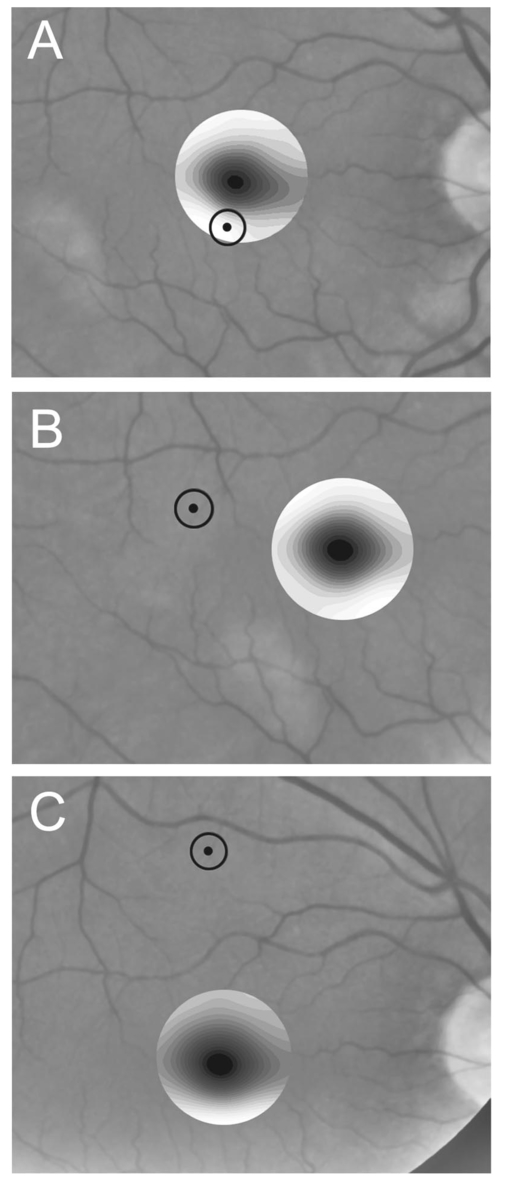 3.4.Effect of Retinal VesselsWe were also interested in whether the foveal patterns of convexity and concentricity extended through the parafovea, and if not, what fundus features appeared to be responsible. In particular, the larger dark retinal vessels were expected to make dark incursions into the pattern peripherally, making the parafoveal patterns star shaped rather than convex. Accordingly, the parafoveal image (3000-μm diameter) was processed as described earlier and the resulting patterns of isobars compared with their foveal counterparts. A typical parafoveal pattern in a normal eye generated by a Gaussian blur of 238-μm radius maintained concentricity and convexity until the periphery, where it became star shaped [Figs. 6(a), and 6(b)]. Because of the Gaussian blur used in the parafovea, perivascular details were blended with the vessels themselves in these patterns. Consequently, the relative contributions made to the pattern by vessels and perivascular structures could not be determined. However, when retinal vessels were masked before the blurring, the convexity and the radially increasing property of the pattern were partially but not completely restored at the periphery [Figs. 6(c) and 6(d)], suggesting that both vessel and perivasculature details play a role. Similar results were obtained in three other star-shaped parafoveal patterns studied. Figure 6Effect of retinal vessels. A normal parafoveal image from a 46-year-old black male subject (3000 μm) in the green channel before (a) and after filtering and contrast enhancement (b). The star-shaped pattern in (b) is created in part by the dark incursions of the retinal vessels into the underlying convex, radially increasing background pattern. Partial masking of the darker retinal vessels in the inferior parafovea [vessels to the left of the Vs in (a)] yields (c). Filtering and contrast enhancement applied to (c) yield (d), largely but not completely restoring convexity and the pattern of radially increasing reflectance in the inferior parafovea. 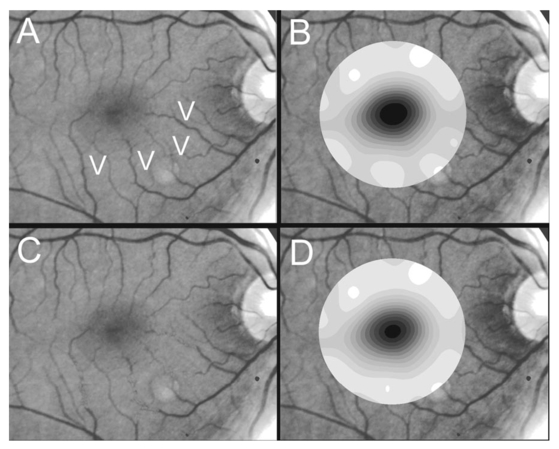 3.5.Gray-Level Values in the Normal FoveaTo obtain a quantitative description of the range of foveal photographic data, we measured the gray levels of the background over the 1500-μm foveal area in one image from each eye (20 images). It was immediately apparent that 4 eyes from 2 patients had significantly lower foveal minima and much larger net ranges. The data for the remaining 16 photographs showed the following means: the green channel maximum at the periphery was 130±3.0 (range 127 to 136); the minimum at the foveal center was 105±4.5 (range 98 to 112); and the mean net range was 24.1±5.5 (range 16 to 35). For the four other photographs, the means were maximum 134±2.2, minimum 76±9.7, and range 59±11.6. These two patients represented the extremes of age in our study (29 and 77 years). The four photographs were of excellent quality and also represented the finest foveal resolutions in our series (mean 25±4.3 μm) , but were otherwise unremarkable. 3.6.Mathematical ModelThe raw data from the green channel of a digitized normal foveal photograph are presented in Fig. 7(a). Individual pixels are represented by their (x,y) coordinates in the horizontal plane. At the level of resolution used, there are about 7,500 data points in the foveal ellipse. Figure 7(b) is the contour graph of the two-zone, 12-parameter quadratic elliptic fit to these data. The central luteal area appears as the darker “egg yolk” in this pattern, while the outer annulus is the gently bowl-shaped remainder. The pattern is relatively simple, with each contour approximately an ellipse. The pattern generated by the model fit is also strikingly similar to the normal foveal patterns (compare Fig. 2). Despite the simplicity of the model compared with the complexity of the raw data, the mean absolute error of this fit (as calculated later) is only 0.95 gray levels (4.8 of the net range of 20). Figure 7(c) plots the errors (+ and −) as another contour graph, showing that the errors are rather randomly distributed. Figure 7A two-zone mathematical model of normal foveal reflectance. (a) Digitized unfiltered data from the green channel of a normal foveal photograph (76-year-old Caucasian male subject) scanned at 1350 pixels per inch. Individual pixels are represented by their (x,y) coordinates in the horizontal plane. The original gray levels for this image range from 105 to 125; the data have been contrast enhanced so that the image details can be seen, and image complexity is evident. There are about 7500 data points in the foveal ellipse bounded by x and y, x ranging from 40 to 140 and y from 50 to 140. Each pixel gray level in this range is represented by contour levels as indicated on the accompanying strip. (b) The two-zone, 12-parameter quadratic elliptic fit to these data plotted as a contour graph relative to the same gray-level scale. The central luteal area appears as the darker “egg yolk” in this pattern. It is modeled by one elliptic quadratic q1(x,y)=a(x−x0)2+b(x−x0)(y−y0)+c(y−y0)2+d(x−x0)+e(y−y0)+constant, where the six parameters are (a,b,c,d,e,const)=(0.009059,0.004791,0.008806,−0.0009,−0.0298,108.74) and centered at (x0,y0)=(85,82). The outer annulus is the gently bowl-shaped remainder. It is modeled by a second elliptic quadratic q2(x,y)=a(x−x0)2+b(x−x0)(y−y0)+c(y−y0)2+d(x−x0)+e(y−y0)+constant, where the six parameters are now (a,b,c,d,e,const)=(0.004237,0.000894,0.002444, 0.0438,−0.0040,113.09), and centered at (x0,y0)=(93,92). (c) The fit error plotted as a contour graph (+ and −) , showing a fairly random error distribution. The mean absolute error of this fit (both regions) is 0.95 gray levels (4.8 of the net range of 20 in the original data). 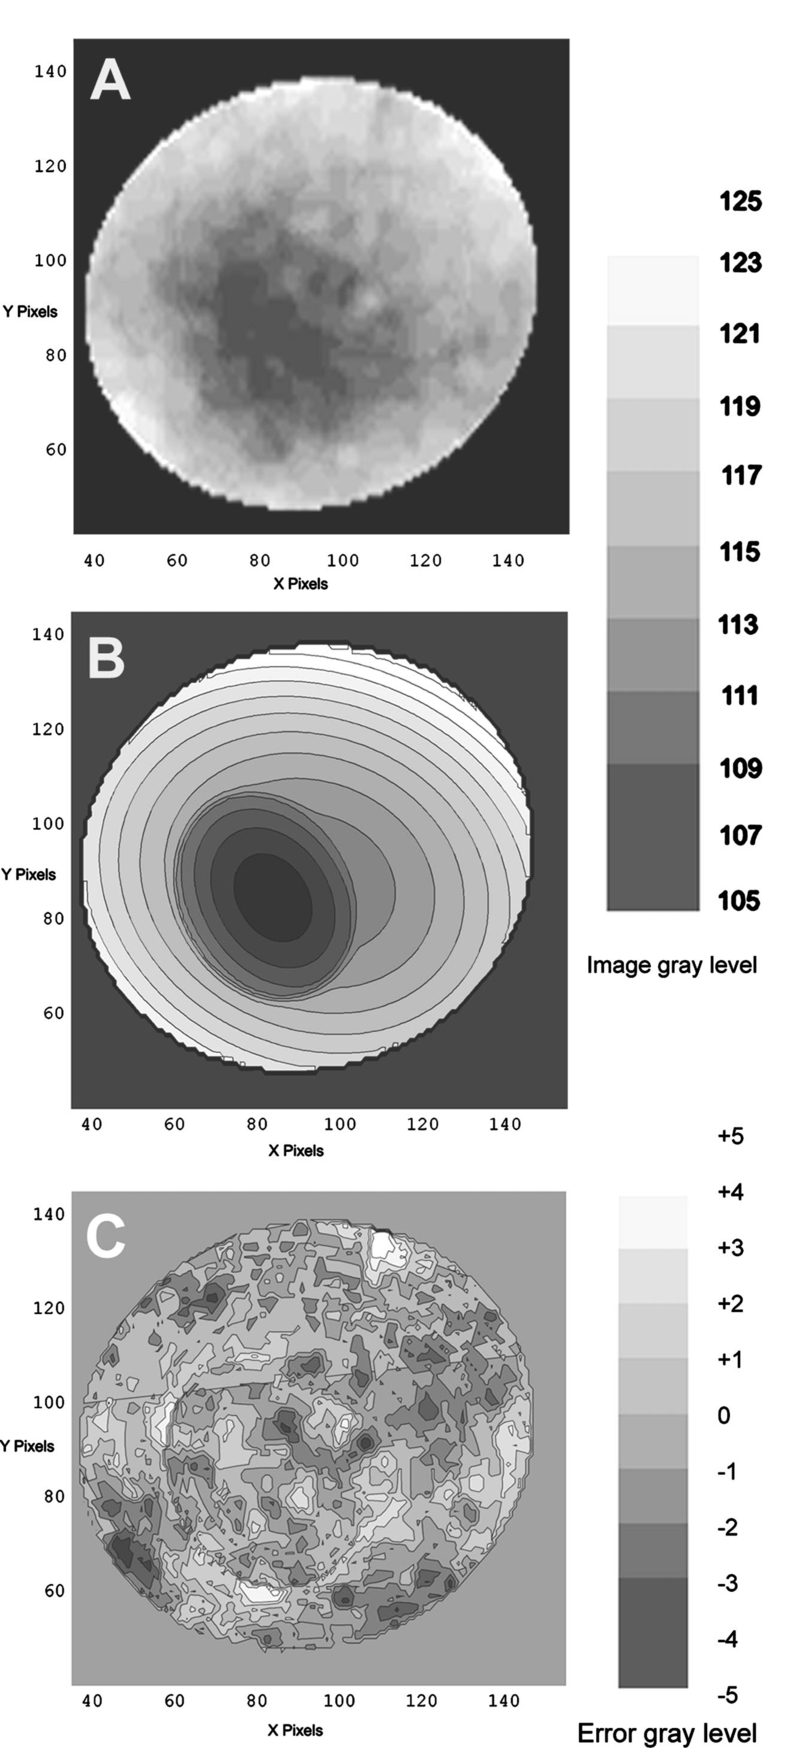 Five images were modeled in two zone fits. The accuracy of each fit was determined as follows: The absolute values of the errors at each (x,y) point in two dimensions were treated as a single data set E. We then calculated the mean and standard deviation of E and scaled these results to the net gray-level range to give a percentage mean error for each image. We also averaged these mean errors over the five images studied. For the two-zone elliptic model, the mean absolute errors and standard deviations per image ranged from 5.4±4.2 to 7.2±6.2; the mean of these mean errors was 6.1 (4.6 in the central disk, 6.6 in the surrounding annulus). Visual inspection of error plots suggested random spatial distribution, with the occasional exception of vessels where the errors were higher. This was expected since the vessels were not part of the background pattern being modeled, but were not excluded from the data. The two-zone model was also applied to a limited number of selected pixels (3.3 of the entire dataset on average) from the same five foveal images to try to reconstruct the gray-level data. In this procedure, pixels were chosen as small clusters from each quadrant of both zones that roughly represented the gray-level variation. Because gray-level values change faster from the center to the periphery in the central zone, we chose a higher density of pixels here than in the annular zone. The coefficients for elliptic quadratics were then generated in each zone to approximate these pixel data only, treating all other data points as unknown. The resulting polynomials, of course, defined a model over the entire region, which we termed the model generated from selected pixels. To measure the accuracy of the reconstruction, the average absolute errors of this model were determined as described earlier, by pointwise comparison over the entire region with the original data. The mean absolute errors of the five models constructed from selected pixels using the two-zone model ranged from 6.2±4.6 to 8.7±5.7 (mean of mean errors, 7.2; 6.2 in the central disk, 7.6 in the surrounding annulus). These mean errors are all within about 1 of their counterparts for the models using all available pixels. Figure 8 illustrates the geometric similarity of the two models, one using all available pixels and the other using selected pixels. These results suggest that the entire gray-level pattern can be reconstructed from only selected points in the fovea by use of the two-zone quadratic elliptic polynomial model. Figure 8The two-zone mathematical model of normal foveal reflectance generated from selected pixels. (a) Digitized unfiltered gray-level data from the green channel of a 1500-μm-diameter foveal photograph scanned at 1350 pixels per inch from a normal 53-year-old Caucasian female subject. The data have been contrast enhanced so that the image details can be seen. There are about 15,300 data points in this region. (b) The contour graph of the model fit to the complete data in (a). The average absolute error of this model is 6.8 of the net gray-level range of 16. (c) Selected clusters of data points comprising 336 pixels, or 2.2 of the total. Of these pixels, 114 are in the central zone (5.0 of the 2280 pixels in the central zone) and 222 are in the annulus (1.7 of 13,030 pixels). The two-zone model was fit to this small number of pixels. (d) The contour graph of the model fit to the data in (c). The average absolute error of this model with respect to the original data in (a) is 7.7, which is slightly greater than that of the model in (b) generated by fitting to the original complete data. The transition between the two zones in this model is also slightly less smooth than that in (b). The two models are otherwise quite similar. 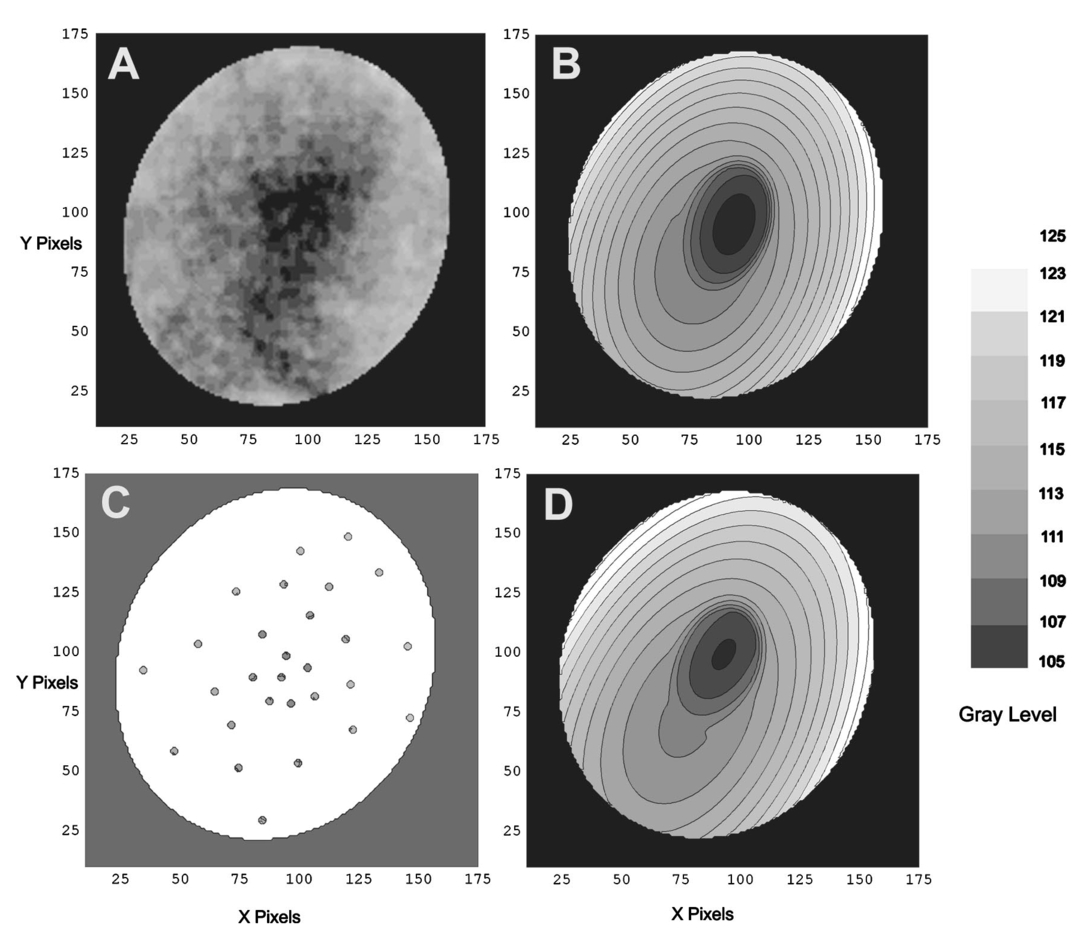 4.DiscussionThe main findings of this digital analysis were twofold and complementary. First, that properly filtered normal foveal photographic images, when viewed in the 8-bit green channel, exhibit concentric convex elliptically shaped gray-level isobars, with isobar resolutions of 50 to 100 μm. This two-dimensional structure is not apparent in the original images (compare Fig. 1 and Fig. 2) and to our knowledge has not heretofore been described. Images scanned at higher than 8 bits, or with a high-resolution digital camera, suggest even higher isobar resolution, but this was not pursued in this study. Second, a mathematical model using elliptic quadratic polynomials in two variables can closely approximate the individual gray-level data. The elliptically shaped patterns in the image data tended to be more circular centrally and more elongated peripherally, with the gray level increasing outward along any radius from a least reflectant center. These concentric elliptical patterns were present in a cohort of patients ranging in age from 29 to 77 years and of varying ethnicity. For well-centered photographs of the same eye, the patterns varied only slightly (Fig. 4). These patterns persisted even with the variable illumination induced by photographic decentration (Fig. 5), but the precise isobar resolutions and shapes were also more variable. Image variability on smaller scales is more complex. If image filtering were done on a smaller scale (e.g., a Gaussian blur of smaller radius), then this additional complexity, closer to the raw data, would be demonstrated. However, our experience was that such additional complexity was not useful or reproducible. Our technique for depicting foveal image data is therefore a compromise that shows an easily understandable structure on a scale of 50 to 100 μm. As a clinical comparison, this is also the size of the small to intermediate drusen that will be sought in macular image analysis. Furthermore, this structure appears to be reasonably reproducible for well-centered, good-quality images (Fig. 4), which also makes it potentially more useful. Similar comments apply to the parafoveal patterns. Here the Gaussian blur was increased in radius to compensate for the increased complexity of this larger 3000-μm region, particularly the involvement of the retinal vessels. The patterns generated tended to maintain concentric elliptic isobars centrally, but then became star shaped in the regions of the darker retinal vessels. While we had expected that the vessels themselves produced this phenomenon, with background gray levels continuing to be radially increasing around the vessels, we found that replacing the vascular columns with adjacent background color generally resulted in only partial restoration of the expected concentric convex patterns continuing from the fovea. It may be that the vascular column itself is only partly responsible for the observed perivascular change of pattern and that in the neighborhood of vessels, the macular pattern itself may depart from its radially increasing nature. Detailed study would be necessary to confirm this. A potential source of error in the measured isobar resolutions is the standardization of the images based on the commonly accepted macula–optic disk distance of 3000 μm. This distance has been reported to be as large as 3400 μm, with a standard deviation on the order of 340 μm.31 Hence any single isobar resolution could be subject to a 10 error. Because such errors would tend to be random, the range of resolutions reported here (50 to 100 μm) is probably affected only slightly. Furthermore, we found that the geometry of elliptic concentric convex patterns was unaffected by variations of ±10 in the radii of the Gaussian blurs used to create them. Hence this geometry would appear to be unaffected by ±10 potential image magnification errors. For these reasons we did not pursue more accurate image magnification measurements, which would require additional biometry such as axial length measurements.32 Quantitatively, the foveal data were well described by our model based on the anatomical zones of a central luteal disk and a surrounding annulus with fits by elliptic quadratic polynomials in each zone. Although generic patterns can be described by such quadratic equations, these precise profiles were unique to each fundus photograph, and parameters for the fit equations were determined on an individual basis. The model was also capable of reconstructing the raw foveal data from a small subset of selected data points. The accuracy of these reconstructions was nearly as good as the model fits to the entire dataset. This argues favorably for the potential ability of the model to reconstruct the foveal photographic data in a macula containing pathology, by applying it to a representative group of normal background points. The minimum spatial distribution and density requirements for such a dataset to achieve acceptable modeling remain to be determined. Our results suggest that greater density of data sampling is required in the more variable luteal region than in the surrounding annulus (see Fig. 8). This could be pertinent to the clinical situation of a macula with a heavy drusen load, in which the choice of normal background points may be limited. Extending the model into the parafovea would also be more complex, particularly in perivascular regions, as discussed earlier. The concentric convex model would need modification to approximate the data in these regions. The photographic patterns we have described are consistent with the anatomical distributions of the macular structures that serve as principal reflectors and absorbers. Detailed discussion is beyond the scope of this paper (see Ref. 33 and references therein). Briefly, however, the most variable components are the macular luteal pigment,34 35 36 the nerve fiber layer (NFL),37 38 39 40 41 42 43 and melanin of the retinal pigment epithelium (RPE).36 The macular luteal pigment, a mixture of the carotenoids lutein and zeaxanthin, has an optical density spectrum that has been well described by Bone and co-workers.35 From a peak at 460 nm and a shoulder at 490 nm, the optical density declines rapidly, but is still significant in the green wavelengths. The distribution of this pigment in primate retinas peaks centrally and tapers radially.34 For the green channel, then, the luteal pigment should contribute a central darkness that brightens radially, a pattern that is consistent with our findings. In normal eyes, the density of RPE melanin is also greatest centrally.36 Since melanin is an effective absorber of green wavelengths,33 this distribution of RPE melanin is also consistent with a pattern of central darkness in the green channel. In the case of the NFL, which is highly reflective of the blue to green wavelengths, the analysis proceeds somewhat differently. Knighton et al.;39 first made quantitative measurements of the spectral reflectance of the NFL of a primate retina. The highest reflectance is for blue light (460 nm), dropping off to perhaps two-thirds of this for green (510 nm). The reflectance spectrum has essentially the same shape at varying points along an arcuate nerve fiber bundle, but decreases in magnitude in parallel with the decline in thickness seen histologically.41 42 43 If NFL reflectance in the macular area generally parallels thickness, this implies that there will be a minimum centrally that will increase toward the arcades, contributing to an overall pattern of radially increasing reflectance. Reflectance of the retinal NFL is also highly directional in that it depends on the angles of illumination and observation.37 40 Furthermore, the fovea is not a flat surface; rather, it is a concave reflector. These factors may contribute to the variability in the geometry of foveal reflectance, as we have demonstrated in photographs taken with varying centrations (Fig. 5). The fact that pattern concentricity and convexity are still preserved at a fairly high level of isobar resolution (50 to 100 μm) suggests that the principal reflectors and absorbers in the fovea must also lie in a concentric, convex arrangement. Specular reflections from the internal limiting membrane could also contribute to variation with image centration (as in Fig. 5), as well as the overall pattern, especially in young patients.27. These reflections contribute a bright point at the center of the fovea (the foveal reflex) and an oval halo around the fovea. These concentric convex patterns of photographic gray levels provide a relatively simple geometric representation of complex image data in the fovea as nested sets of ellipses. The accuracy of the fits to these data by the mathematical model of elliptic quadratic polynomials confirms this underlying structure. Furthermore, these patterns have a logical basis in the anatomy of the luteal pigment, RPE pigment, and the NFL. The patterns outside the fovea assume star-shaped configurations that can be explained by vessels and perivasculature impinging on an underlying radially increasing pattern. The ability of the model to reconstruct the foveal image data from a small subset of points suggests utility in analyzing maculas with pathology. By applying these findings, we are developing methods for leveling the macular background that hold promise in quantification of macular pathology. A potential advantage of this technique will be that in leveling the macular background, the same correction can be simultaneously applied to the pathological structures embedded within the image, with the dimmer central ones being brightened for uniform identification. Testing and validation of these methods will be taken up in a subsequent paper. AcknowledgmentsThe authors wish to thank Prof. Robert Knighton for reviewing an earlier version of the manuscript. We acknowledge support from The New York Community Trust (RTS), Nichols Foundation (JPK), National Institute of Health/National Eye Institute grant 12951 (JRS) and unrestricted funds from Research to Prevent Blindness. REFERENCES
T. Behrendt
and
T. D. Duane
,
“Investigation of fundus oculi with spectral reflectance photography,”
Arch. Ophthalmol. (Chicago) , 75 375
–379
(1966). Google Scholar
C. C. Klaver
,
R. C. Wolfs
,
J. R. Vingerling
,
A. Hofman
, and
P. T. de Jong
,
“Age-specific prevalence and causes of blindness and visual impairment in an older population: the Rotterdam Study,”
Arch. Ophthalmol. (Chicago) , 116 653
–658
(1998). Google Scholar
W. E. Smiddy
and
S. L. Fine
,
“Prognosis of patients with bilateral macular drusen,”
Ophthalmology , 91 271
–277
(1984). Google Scholar
S. B. Bressler
,
M. G. Maguire
,
N. M. Bressler
, and
S. L. Fine
,
“Relationship of drusen and abnormalities of the retinal pigment epithelium to the prognosis of neovascular macular degeneration. The Macular Photocoagulation Study Group,”
Arch. Ophthalmol. (Chicago) , 108 1442
–1447
(1990). Google Scholar
N. M. Bressler
,
S. B. Bressler
,
J. M. Seddon
,
E. S. Gragoudas
, and
L. P. Jacobson
,
“Drusen characteristics in patients with exudative versus non-exudative age-related macular degeneration,”
Retina , 8 109
–114
(1988). Google Scholar
F. G. Holz
,
T. J. Wolfensberger
,
B. Piguet
,
M. Gross-Jendroska
,
J. A. Wells
,
D. C. Minassian
,
I. H. Chisholm
, and
A. C. Bird
,
“Bilateral macular drusen in age-related macular degeneration. Prognosis and risk factors,”
Ophthalmology , 101 1522
–1528
(1994). Google Scholar
A. Abdelsalam
,
L. Del Priore
, and
M. A. Zarbin
,
“Drusen in age-related macular degeneration: pathogenesis, natural course, and laser photocoagulation-induced regression,”
Surv. Ophthalmol. , 44 1
–29
(1999). Google Scholar
H. L. Little
,
J. M. Showman
, and
B. W. Brown
,
“A pilot randomized controlled study on the effect of laser photocoagulation of confluent soft macular drusen,”
Ophthalmology , 104 623
–631
(1997). Google Scholar
I. C. Frennesson
and
S. E. Nilsson
,
“Effects of argon (green) laser treatment of soft drusen in early age-related maculopathy: a 6-month prospective study,”
Br. J. Ophthamol. , 79 905
–909
(1995). Google Scholar
N. M. Bressler
,
B. Munoz
,
M. G. Maguire
,
S. E. Vitale
,
O. D. Schein
,
H. R. Taylor
, and
S. K. West
,
“Five-year incidence and disappearance of drusen and retinal pigment epithelial abnormalities. Waterman study,”
Arch. Ophthalmol. (Chicago) , 113 301
–308
(1995). Google Scholar
S. B. Bressler
,
N. M. Bressler
,
J. M. Seddon
,
E. S. Gragoudas
, and
L. P. Jacobson
,
“Interobserver and intraobserver reliability in the clinical classification of drusen,”
Retina , 8 102
–108
(1988). Google Scholar
A. C. Bird
,
N. M. Bressler
,
S. B. Bressler
,
I. H. Chisholm
,
G. Coscas
,
M. D. Davis
,
P. T. de Jong
,
C. C. Klaver
,
B. E. Klein
, and
R. Klein
,
“An international classification and grading system for age-related maculopathy and age-related macular degeneration. The International ARM Epidemiological Study Group,”
Surv. Ophthalmol. , 39 367
–374
(1995). Google Scholar
R. Klein
,
M. D. Davis
,
Y. L. Magli
,
P. Segal
,
B. E. Klein
, and
L. Hubbard
,
“The Wisconsin age-related maculopathy grading system,”
Ophthalmology , 98 1128
–1134
(1991). Google Scholar
Arch. Ophthalmol. (Chicago) , 119 1417
–1436
(2001). Google Scholar
D. S. Shin
,
N. B. Javornik
, and
J. W. Berger
,
“Computer-assisted, interactive fundus image processing for macular drusen quantitation [see comments],”
Ophthalmology , 106 1119
–1125
(1999). Google Scholar
M. Sebag
,
E. Peli
, and
M. Lahav
,
“Image analysis of changes in drusen area,”
Acta Ophthalmol. , 69 603
–610
(1991). Google Scholar
W. H. Morgan
,
R. L. Cooper
,
I. J. Constable
, and
R. H. Eikelboom
,
“Automated extraction and quantification of macular drusen from fundal photographs,”
Aust. N. Z. J. Ophthalmol. , 22 7
–12
(1994). Google Scholar
J. N. Kirkpatrick
,
T. Spencer
,
A. Manivannan
,
P. F. Sharp
, and
J. V. Forrester
,
“Quantitative image analysis of macular drusen from fundus photographs and scanning laser ophthalmoscope images,”
Eye , 9 48
–55
(1995). Google Scholar
E. Peli
and
M. Lahav
,
“Drusen measurement from fundus photographs using computer image analysis,”
Ophthalmology , 93 1575
–1580
(1986). Google Scholar
M. H. Goldbaum
,
N. P. Katz
,
M. R. Nelson
, and
L. R. Haff
,
“The discrimination of similarly colored objects in computer images of the ocular fundus,”
Invest. Ophthalmol. Visual Sci. , 31 617
–623
(1990). Google Scholar
M. S. Figueroa
,
A. Regueras
,
J. Bertrand
,
M. J. Aparicio
, and
M. G. Manrique
,
“Laser photocoagulation for macular soft drusen. Updated results,”
Retina , 17 378
–384
(1997). Google Scholar
M. S. Figueroa
,
A. Regueras
, and
J. Bertrand
,
“Laser photocoagulation to treat macular soft drusen in age-related macular degeneration,”
Retina , 14 391
–396
(1994). Google Scholar
J. Sigelman
,
“Foveal drusen resorption one year after perifoveal laser photocoagulation,”
Ophthalmology , 98 1379
–1383
(1991). Google Scholar
Neovascularization Prevention Trial Research Group,
“Laser treatment in eyes with large drusen. Short-term effects seen in a pilot randomized clinical trial. Choroidal Neovascularization Prevention Trial Research Group,”
Ophthalmology , 105 11
–23
(1998). Google Scholar
F. C. Delori
,
E. S. Gragoudas
,
R. Francisco
, and
R. C. Pruett
,
“Monochromatic ophthalmoscopy and fundus photography,”
Arch. Ophthalmol. (Chicago) , 95 861
–868
(1977). Google Scholar
A. R. Rudnicka
,
R. O. Burk
,
D. F. Edgar
, and
F. Fitzke
,
“Magnification characteristics of fundus imaging systems,”
Ophthalmology , 105 2186
–2192
(1998). Google Scholar
B. Bengtsson
and
C. Krakau
,
“Correction of optic disc measurements on fundus photographs,”
Graefe's Arch. Clin. Exp. Ophthalmol. , 230 24
–28
(1992). Google Scholar
J. van de Kraats
,
T. T. Berendschot
, and
D. van Norren
,
“The pathways of light measured in fundus reflectometry,”
Vision Res. , 36 2229
–2247
(1996). Google Scholar
D. M. Snodderly
,
J. D. Auran
, and
F. C. Delori
,
“The macular pigment. II. Spatial distribution in primate retinas,”
Invest. Ophthalmol. Visual Sci. , 25 674
–685
(1984). Google Scholar
R. A. Bone
,
J. T. Landrum
, and
A. Cains
,
“Optical density spectra of the macular pigment in vivo and in vitro,”
Vision Res. , 32 105
–110
(1992). Google Scholar
J. J. Weiter
,
F. C. Delori
,
G. L. Wing
, and
K. A. Fitch
,
“Retinal pigment epithelial lipofuscin and melanin and choroidal melanin in human eyes,”
Invest. Ophthalmol. Visual Sci. , 27 145
–152
(1986). Google Scholar
R. W. Knighton
,
X. Huang
, and
Q. Zhou
,
“Microtubule contribution to the reflectance of the retinal nerve fiber layer,”
Invest. Ophthalmol. Visual Sci. , 39 189
–193
(1998). Google Scholar
R. W. Knighton
and
X. R. Huang
,
“Directional and spectral reflectance of the rat retinal nerve fiber layer,”
Invest. Ophthalmol. Visual Sci. , 40 639
–647
(1999). Google Scholar
R. W. Knighton
,
S. G. Jacobson
, and
C. M. Kemp
,
“The spectral reflectance of the nerve fiber layer of the macaque retina,”
Invest. Ophthalmol. Visual Sci. , 30 2392
–2402
(1989). Google Scholar
R. W. Knighton
and
C. Qian
,
“An optical model of the human retinal nerve fiber layer: implications of directional reflectance for variability of clinical measurements,”
J. Glaucoma , 9 56
–62
(2000). Google Scholar
T. E. Ogden
,
“Nerve fiber layer of the primate retina: thickness and glial content,”
Vision Res. , 23 581
–587
(1983). Google Scholar
T. E. Ogden
,
“Nerve fiber layer of the primate retina: morphometric analysis,”
Invest. Ophthalmol. Visual Sci. , 25 19
–29
(1984). Google Scholar
R. L. Radius
,
“Thickness of the retinal nerve fiber layer in primate eyes,”
Arch. Ophthalmol. (Chicago) , 98 1625
–1629
(1980). Google Scholar
|


CITATIONS
Cited by 16 scholarly publications and 1 patent.
Photography
Data modeling
Reflectivity
Mathematical modeling
Macula
Eye
Image filtering


