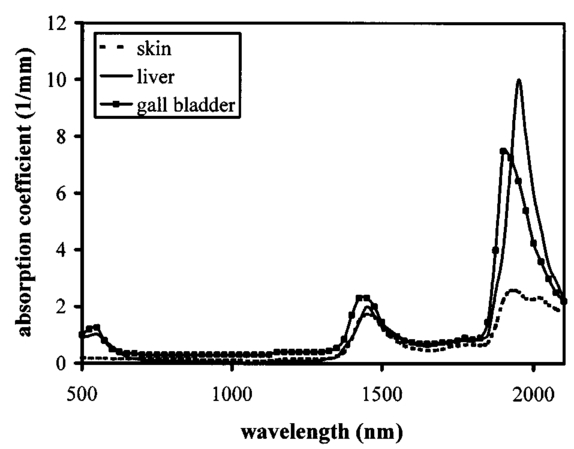
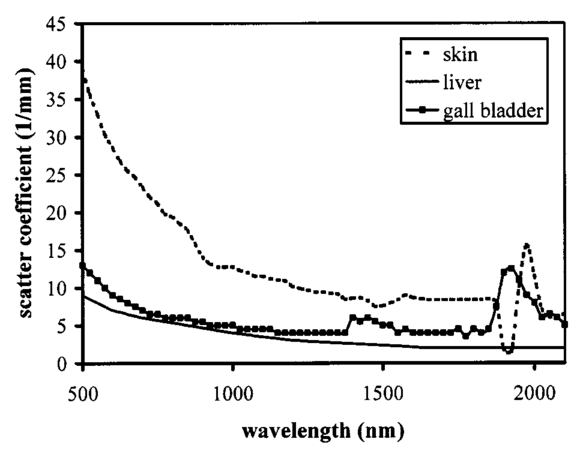
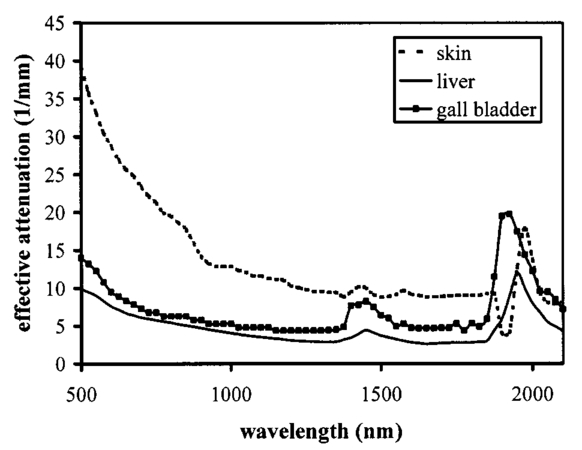
1.IntroductionOptical coherence tomography (OCT) was developed from optical coherence domain reflectometry (OCDR) in the early 1990s.1 Developed mainly for medical applications, it allows noninvasive acquisition of three-dimensional images2 in turbid structures in vivo, at high speed and with, so far, up to 1 μm of resolution.3 This resolution allows cellular imaging and the high speed allows functional imaging.4 The principle behind depth-ranging optical imaging is measurement of the light travel time,5 and hence distance, to and from a scattering structure within a sample, similar to ultrasound imaging, which uses sound waves.1 Since the speed of light is far greater than the speed of sound, the travel time is difficult to measure directly, so low-coherence interferometry is used.6 Light interacts with tissue by scattering or absorption. Both the absorption and scattering coefficients vary among different wavelengths and tissues because soft tissue is a complex, turbid structure, with components ranging in size from less than 100 nm to in excess of several millimeters.7 In the search for ultrabroadband light to improve the resolution achievable in OCT images, many different light sources have been proposed. However, owing to the variation in tissue optical properties among wavelengths, some sources achieve better penetration depths and image contrast than others. It is difficult to compare the suitability of sources for OCT experimentally because of the differing optical spatial characteristics of sources and the differing spectral response of optical components. No comprehensive study of the sources proposed to date has taken place. Pan and Farkas8 compared superluminescent diode (SLD) lasers at 830 and 1285 nm in OCT, as did Schmitt et al.;9 at 830 and 1300 nm,10 and Bouma et al.;10 compared OCT images with fiber lasers at 1.55 and 1.81 μm with those from a 1.3-μm superluminescent diode laser. However, owing to experimental variation in the use of each source, no definite conclusions have been reached as to the best wavelength or source to be used. This paper aims to quantify the appropriateness of common OCT sources based on the effect of travel through tissues with known optical properties. 2.Theory2.1.Optical Coherence TomographyIn OCT, light from a source is split into two paths, the sample and reference paths, as in a Michelson interferometer. The light in the sample path interacts with the subject under study, with some light reflected or scattered back from different structures within it. The light in the reference path is reflected back in the opposite direction to recombine with light returning from the sample path. The beams interfere when the difference between the two paths is within the coherence length of the light source, and the reference path length is modulated to investigate the interference at varying depths within the sample. Since interference only occurs when the difference between the lengths of the sample and reference paths is within the coherence length of the light source, use of a broadband source and hence of short coherence length, enables more precise location of the depth of a structure within the sample than other techniques.1 The light intensity at a detector in the output, ID, is where E denotes the electric field of light; τ is the time delay that is due to the mismatch in path length between the sample and reference paths; the prime denotes “after interaction with tissue,” and the subscripts D, r, and s denote the detector, reference, and sample paths, respectively. The real part of the equation represents the amplitude of the interference fringes at time delay τ, which depends on the cross-correlation amplitude of Er and Es ′, and is a measure of the spatial and temporal similarity of these fields. If the sample acts as an ideal mirror (i.e., the amplitude and coherence of the light do not change on interaction with the sample), the amplitude of the fringes is the autocorrelation of the source. This depends only on the complex temporal coherence function, G(τ), of the light source, where v0 is the center frequency of the source and ϕ(τ) is the difference in phase between spectral components of the light at the detector.11The coherence function is the Fourier transform of the source’s spectral power density, S(v), as given by the Weiner-Khinchin relation,12 It can be seen from this that the wider the source bandwidth, the narrower the interference patterns, i.e., the shorter the coherence length of the source, lc. The coherence length is related to the wavelength bandwidth of the source, Δλ, by where A is a constant that depends on the spectral shape of the source output and is approximately 0.44 for a source with a Gaussian profile.11 13 The coherence length is then a measure of the axial resolution, Δz, of the system.14In reality, tissue does not act as an ideal mirror and the detected signal is related to the convolution of the source spectrum and the spectrum of light returning from the tissue involved, rather than the autocorrelation of the source’s spectrum. If both spectra are Gaussian in shape, with spectral widths α and β, the Gaussian resulting from the convolution has a width,15 γ, 2.2.Tissue Structure and OpticsIn tissue, there are three main types of scatter, the predominance of which depends on the wavelength of incident light and the size and concentration of scattering elements. In turbid tissue, which is composed mainly of structures with sizes much greater than the wavelength of light (e.g., blood cells), Mie scattering has been found to be a suitable approximation.16 It is not isotropic, with more of the scattered light being directed forward than backward, and is strongly wavelength dependent.16 For example, approximately three times as much scattering occurs at 830 nm than at 1285 nm.18 For OCT, the system’s wavelength has to be such that absorption in the sample is minimized to allow maximal imaging depth. In tissue, absorption is minimized between 700 and 1300 nm, in what is known as the window of transmission.17 Below 700 nm, absorption in blood is high and above 2500 nm absorption in water is extremely high.11 The amount of scattering in tissue also varies with wavelength, and is minimized in the near-infrared.18 So far, OCT research has concentrated on the wavelengths around 800 and 1300 nm because of the sources available. Absorption is lower at 800 than at 1300 nm, although scattering is higher.1 This tradeoff results in a greater tissue penetration depth at 1300 than at 800 nm.10 19 20 A study comparing two SLDs at 830 and 1300 nm for OCT in vitro on rat arterial tissue found the overall attenuation of the source’s output to be lower at 1300 nm.9 The decreased attenuation that is due to decreased scatter at 1300 nm has led many groups to study OCT in this wavelength region.6 21 2.3.Modeling Light Propagation in TissueBoltzmann’s radiative transport equation is commonly used to describe the propagation of light in turbid media with different approximations used under different circumstances.22 It assumes that scatterers act independently of one another and it ignores polarizing effects.23 The Beer’s law approximation may be used where absorption is much greater than scatter, and the diffusion approximation may be used for the reverse situation. No simplification or analytical solution has been found for the situation where scatter and absorption both occur to a similar extent, which happens, for example, in the epidermis between 220 and 2000 nm.23 Where use of the diffusion approximation is intended, in media where the distribution of light can be assumed to be diffuse,23 the reduced scattering coefficient, μs ′, is used, which is defined, where μs is the scattering coefficient and g is the anisotropy coefficient, the cosine of the mean scattering angle.24 This approximation also assumes that the medium is homogeneous, that any inhomogeneities would be much smaller than the thickness of the medium,7 that the source is more than a minimum distance (the reciprocal of the reduced scattering coefficient) from the detector, and that the source and detector can be assumed to be pointlike.22 As a result of these constraints, the diffusion approximation is not suitable for use in OCT.A recent approach to determining tissue optical coefficients, where approximations are inappropriate, is by using the Monte Carlo method with experimental measurements of diffuse and collimated transmission and diffuse reflectance.25 Once determined, a tissue’s optical properties, μa, μs, and g, can be used to predict light attenuation in the tissue. A beam incident on tissue is attenuated exponentially with depth in the form where μ eff is the effective attenuation coefficient.26 The penetration depth of light into tissue is given by the inverse of μ eff . 27 The factor k in Eq. (7) accounts for the fact that there is a diffuse reflection at the air–skin boundary, from either direction, of between 4 and 7.7 27In OCT, the sum of the absorption and scattering coefficients given in Eq. (8) has been found to be adequate in describing attenuation at shallow depths in turbid tissue28: In this case, the penetration depth is the same as the mean-free path and is the reciprocal of the effective attenuation coefficient.273.MethodSkin dermis, liver, and gallbladder, for which data were obtained from publications, were chosen for this study as examples of different turbid tissues. Skin dermis is less vascularized than liver,29 while liver tissue has a more homogeneous structure than skin.27 Gallbladder tissue is stratified and has some similarity to other digestive tract mucosa, on which much interest has been focused in the development of OCT. Spectral profiles and overall intensities for a variety of light sources that have either been demonstrated for use in OCT or have properties appropriate for use in OCT were also obtained from publications. A wavelength range of 500 to 2100 nm was chosen for this study, based on the range of sources that have been demonstrated for use in OCT. Porcine liver data were obtained from a publication by Ritz et al.;,29 who used a double integrating sphere and the Monte Carlo technique to obtain the optical properties of samples between 400 and 2400 nm. Parsa et al.;,27 had previously measured the optical properties of rat liver using a similar numerical technique and an integrating sphere, with similar results. The data on human dermis are from work by Troy and Thennadil,30 who used a numerical approach similar to the Monte Carlo method, and a double integrating sphere, to obtain data between 1000 and 2200 nm from in vitro human skin samples. Data from 500 to 1000 nm and from 1900 to 2040 nm are from work by Anderson and Parrish,7 but were scaled to fit with the data from Troy and Thennadil. This is necessary because the work by Anderson and Parrish was done before numerical techniques considered more accurate came into use, so their values for absorption are overestimated. Also, Du et al.;25 have measured optical properties of porcine skin dermis using the Monte Carlo technique and a single integrating sphere, but only between 900 and 1500 nm. Gallbladder data were calculated in a similar manner by Maitland et al.;31 The anisotropy coefficient for gallbladder was taken to be constant at 0.9 to allow calculation of scattering coefficients from the reduced scattering coefficients given, using Eq. (6). Figures 1, 2, and 3 summarize the tissue data used for this study. They show the absorption coefficients, scattering coefficients, and anisotropy coefficients, respectively, of skin, liver, and gallbladder. Since the amount of scattering decreases in the form of an inverse power law as the wavelength increases in all models of scattering, the variations in the scattering and isotropy coefficients around 1500 and 1900 nm are probably arteficts of the measurement process.32 Sources for which published data were obtained and used here are ytterbium (Yb)-doped superfluorescent fibers,30 33 a superfluorescent source consisting of combined Yb-doped and neodymium (Nd)-doped fibers,34 a superfluorescent thulium (Tm) fiber,35 a Kerr lens mode-locked titanium (Ti): sapphire-laser,36 an erbium (Er)-doped fiber laser,10 two types of superluminescent diode,37 two different Kerr lens mode-locked chromium (Cr):forsterite lasers,38 39 and a semiconductor optical amplifier (SOA)-based source from AFC Inc.40 Figure 4 shows the spectral intensity profiles of these sources. Other Yb sources were studied, but only those with the best FWHM are discussed. The data shown in Figs. 1, 2, and 3 were used to determine the effective attenuation of light in the tissues at 1-nm intervals using Eq. (8). The effective attenuation coefficients used for skin, liver, and gallbladder are shown in Fig. 5. Equation (7) was then used to determine the intensity of light from each source returned from the tissues from depths of 10, 60, and 100 μm. These depths were chosen to reflect the stratified nature of skin tissue because 10 μm is the thickness of the stratum corneum, 100 μm is the thickness of the epidermis, and 60 μm is between the two. The mean-free path of light in the tissues was determined at the wavelength of the intensity peak of each source, and the predicted resolution of the source and the light returned from each depth were determined using Eq. (4). The results were recorded in the form of a change in spectral peak intensity and predicted resolution on travel to and from each depth. The change in intensity was examined, rather than the overall intensity, because the intensity requirement for an OCT source depends on the application and on the system’s scanning speed. Systems that use very high scanning speeds require greater power sources so that the power delivered to each pixel in a scan is still adequate.11 41 4.Results and DiscussionFigure 6 shows the penetration depth of light into skin dermis, liver, and gallbladder. It clearly shows a window of transmission in the tissues extending from approximately 600 to 1800 nm, with an interruption around 1400 nm, which shows that optimum OCT imaging depths are achieved using light sources in this range. In liver, the penetration depth is much higher than in gallbladder, in which the penetration depth is much greater than in skin. Figure 7 shows the mean-free path in the three tissues at the wavelength of the peak intensity of each source. Figures 8 and 9 show the theoretical resolution of the source (based on a Gaussian autocorrelation) when used in OCT, and the changes in intensity and predicted resolution on travel to and from depths of 10, 60, and 100 μm in skin. Figures 10 and 11 show these changes for liver, and Figs. 12 and 13 show them for gallbladder tissue. It is important to note that changes, rather than absolute values, are considered because the absolute intensity and spectral profile depend on the manner in which a particular source has been designed or deployed. Improving the intensity of a source will improve the contrast of images at greater depths, but too high an intensity will cause tissue heating and associated changes. Figure 7Mean-free paths in skin, liver, and gallbladder at the wavelengths of the maxima of the light sources. Ti-s, titanium:sapphire laser; SLD, superluminescent diode; Yb, fiber, superfluorescent ytterbium fiber; Yb and Nd, superfluorescent combination of Yb-doped and neodymium-doped fibers; Cr-f, chromium:forsterite laser; SOA, semiconductor optical amplifier; Tm fiber, superfluorescent thulium fiber.  Figure 8Change in intensity of source light in skin, without interaction with tissue (0), after returning from 10-μm depth (10), 60-μm depth (60), and 100-μm depth (100).  Figure 9Change in resolution achievable in skin, without interaction with tissue (0), after returning from 10-μm depth (10), 60-μm depth (60), and 100-μm depth (100).  Figure 10Change in intensity of source light in liver, without interaction with tissue (0), after returning from 10-μm depth (10), 60-μm depth (60), and 100-μm depth (100). 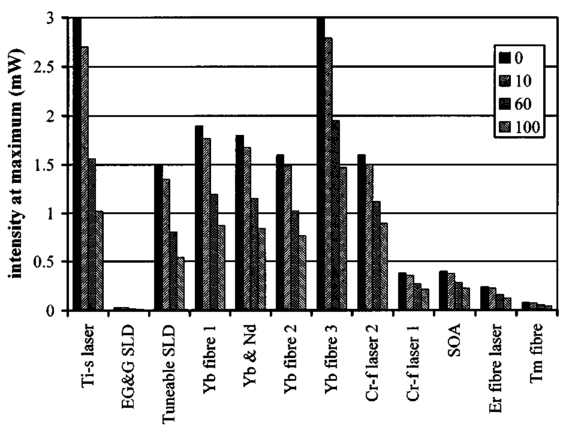 Figure 11Change in resolution achievable in liver, without interaction with tissue (0), after returning from 10-μm depth (10), 60-μm depth (60), and 100-μm depth (100).  Figure 12Change in intensity of source light in gallbladder, without interaction with tissue (0), after returning from 10-μm depth (10), 60-μm depth (60), and 100-μm depth (100).  Figure 13Change in resolution achievable in gallbladder, without interaction with tissue (0), after returning from 10-μm depth (10), 60-μm depth (60), and 100-μm depth (100).  The thulium source and one of the ytterbium sources gave the lowest resolutions, while Cr:forsterite laser 1 and the Ti:sapphire laser produced the highest. The SLDs and the Ti:sapphire laser have the shortest mean-free paths in the tissues, which means that images may suffer more degradation from multiple scattering than with other lasers at greater depths. They are also the most strongly attenuated in the tissues. In skin and liver, the attenuation decreases as the source peak wavelength increases, resulting in the thulium and erbium sources being the least strongly attenuated. In gallbladder tissue, the least strongly attenuated sources are the third ytterbium source, the SOA, and the Cr:forsterite sources. The resolutions of the sources are not greatly reduced by travel through tissue, apart from Cr:forsterite laser 1 in gallbladder. The resolution of the Ti:sapphire system decreases with penetration into tissue in all three tissues. Cr:forsterite laser 1 is the only other source that is attenuated in all three tissues. Cr:forsterite laser 1 has a much broader bandwidth than Cr:forsterite laser 2, even though it decreases through all three tissues; however, it has a much lower intensity at its spectral peak than the latter. Ytterbium fiber 1 shows a 3 increase in resolution in skin, and the thulium fiber shows a 1 increase in resolution in gallbladder at a 100-μm depth. This may be due either to errors, in particular rounding errors, or to changes with depth in spectral profiles, leading to a shift in the position of the peak relative to other parts of the profile. The EG&G SLD, Cr:forsterite laser 1, the SOA, and the erbium and thulium fibers have the lowest intensities at their spectral peaks. The EG&G SLD and the erbium and thulium also fibers have the lowest total power. It is important to note that the treatment used here does not take into consideration that the intensity profiles of the light source are generally not Gaussian. This would affect the resolution of an OCT system, owing mainly to side lobes on the coherence function. In addition, data on the spatial output characteristics, such as spot size or emission angle, of each source, which affects spatial coherence and hence lateral resolution, have not been considered. A more comprehensive treatment might also consider the change in spatial coherence of a beam within tissue21 and polarization and dispersion effects. Also, the artifacts in the scattering and isotropy coefficients around 1500 and 1900 nm are a source of error in these results. 5.ConclusionsLight sources at higher wavelengths i.e., Cr:forsterite lasers, SOAs, and erbium and thulium fibers, are shown to be capable of high-resolution OCT imaging at greater depths than all other sources considered, closely followed by ytterbium fiber sources. Ti:sapphire lasers would be most suited for high-resolution OCT over comparatively shallow depths into tissue, where image degradation caused by multiple scatter at this wavelength range does not become a problem. For lower-resolution applications of OCT, the semiconductor optical amplifier and ytterbium fiber sources have better powers and bandwidths than superluminescent diodes. The data support the existence of a window of penetration in tissue for OCT applications. It is also apparent that the resolution of OCT systems is not reduced significantly with imaging depth. AcknowledgmentsSupport for this work has been provided by the UK Engineering and Physical Sciences Research Council. REFERENCES
D. Huang
,
E. A. Swanson
,
C. P. Lin
,
J. S. Schuman
,
W. G. Stinson
,
W. Chang
,
M. R. Hee
,
T. Flotte
,
K. Gregory
,
C. A. Puliafito
, and
J. G. Fujimoto
,
“Optical coherence tomography,”
Science , 254 1178
–1181
(1991). Google Scholar
A. Podoleanu
,
J. A. Rogers
,
D. A. Jackson
, and
S. Dunne
,
“Three dimensional OCT images from retina and skin,”
Opt. Express , 7
(9), 292
–298
(2000). Google Scholar
J. A. Izatt
,
M. D. Kulkarni
,
K. Kobayashi
,
M. V. Sivak
,
J. K. Barton
, and
A. J. Welch
,
“Optical coherence tomography for biodiagnostics,”
Opt. Photonics News , 8 41
–45
(1997). Google Scholar
A. V. D’Amico
,
M. Weinstein
,
X. Li
,
J. P. Richie
, and
J. G. Fujimoto
,
“Optical coherence tomography as a method for identifying benign and malignant microscopic structures in the prostate gland,”
Urology , 55
(5), 783
–787
(2000). Google Scholar
J. G. Fujimoto
,
W. Drexler
,
U. Morgner
,
F. Ka¨rtner
, and
E. Ippen
,
“Optical coherence tomography: high resolution imaging using echoes of light,”
Opt. Photonics News , 11
(1), 24
–31
(2000). Google Scholar
R. R. Anderson
and
J. A. Parrish
,
“The optics of human skin,”
J. Invest. Dermatol. , 77
(1), 13
–19
(1981). Google Scholar
Y. Pan
and
D. Farkas
,
“Non-invasive imaging of living human skin with dual-wavelength optical coherence tomography in two and three dimensions,”
J. Biomed. Opt. , 3
(4), 446
–455
(1998). Google Scholar
J. M. Schmitt
,
A. Knu¨ttel
,
M. Yadlowsky
, and
M. A. Eckhaus
,
“Optical coherence tomography of a dense tissue: statistics of attenuation and backscattering,”
Phys. Med. Biol. , 39 1705
–1720
(1994). Google Scholar
B. E. Bouma
,
L. E. Nelson
,
G. J. Tearney
,
D. J. Jones
,
M. E. Brezinski
, and
J. G. Fujimoto
,
“Optical coherence tomographic imaging of human tissue at 1.55 μm and 1.81 μm using Er- and Tm-doped fiber sources,”
J. Biomed. Opt. , 3
(1), 76
–79
(1998). Google Scholar
J. M. Schmitt
,
“Optical coherence tomography (OCT): a review,”
J. Select. Top. Quant. Elec., 5
(4), 1205
–1215
(1999). Google Scholar
W. Drexler
,
U. Morgner
,
F. X. Ka¨rtner
,
C. Pitris
,
S. A. Boppart
,
X. D. Li
,
E. P. Ippen
, and
J. G. Fujimoto
,
“In vivo ultrahigh-resolution optical coherence tomography,”
Opt. Lett. , 24
(17), 1221
–1223
(1999). Google Scholar
J. A. Izatt
,
M. D. Kulkarni
,
H. Wang
,
K. Kobayashi
, and
M. V. Sivak Jr.,
,
“Optical coherence tomography and microscopy in gastrointestinal tissues,”
J. Selec. Top. Quant. Elec. , 2
(4), 1017
–1028
(1996). Google Scholar
C. A. Jesser
,
S. A. Boppart
,
C. Pitris
,
D. L. Stamper
,
G. P. Nielsen
,
M. E. Brezinski
, and
J. G. Fujimoto
,
“High resolution imaging of transitional cell carcinoma with optical coherence tomography: feasibility for the evaluation of bladder pathology,”
Br. J. Radiol. , 72 1170
–1176
(1999). Google Scholar
K. Yoo
and
R. Alfano
,
“Time-resolved coherent and incoherent components of forward light scattering in random media,”
Opt. Lett. , 15
(6), 320
–322
(1990). Google Scholar
K. P. Chan
,
B. Devaraj
,
M. Yamada
, and
H. Inaba
,
“Coherent detection techniques in optical imaging of tissues,”
Phys. Med. Biol. , 42 855
–867
(1997). Google Scholar
J. G. Fujimoto
,
“Biomedical imaging using optical coherence tomography,”
Proc. SPIE , 3749 402
–403
(1999). Google Scholar
G. J. Tearney
,
B. E. Bouma
,
S. A. Boppart
,
B. Golubovic
,
E. A. Swanson
, and
J. G. Fujimoto
,
“Rapid acquisition of in vivo biological images by use of optical coherence tomography,”
Opt. Lett. , 21
(17), 1408
–1410
(1996). Google Scholar
M. E. Brezinski
,
G. J. Tearney
,
N. J. Weissman
,
S. A. Boppart
,
B. E. Bouma
,
M. R. Hee
,
A. E. Weyman
,
E. A. Swanson
,
J. F. Southern
, and
J. G. Fujimoto
,
“Assessing atherosclerotic plaque morphology: comparison of optical coherence tomography and high frequency intravascular ultrasound,”
Heart , 77
(5), 397
–403
(1997). Google Scholar
J. A. Izatt
,
M. D. Kulkarni
,
S. Yazdanfar
,
J. K. Barton
, and
A. J. Welch
,
“In vivo bidirectional color doppler flow imaging of picoliter blood volumes using optical coherence tomography,”
Opt. Lett. , 22
(18), 1439
–1441
(1997). Google Scholar
R. M. P. Doornbos
,
R. Lang
,
M. C. Aalders
,
F. W. Cross
, and
H. J. C. M. Sterenborg
,
“The determination of in vivo human tissue optical properties and absolute chromophore concentrations using spatially resolved steady-state diffuse reflectance spectroscopy,”
Phys. Med. Biol. , 44 967
–981
(1999). Google Scholar
M. J. C. Van Gemert
,
S. L. Jacques
,
H. J. C. M. Sterenborg
, and
W. M. Star
,
“Skin optics,”
IEEE Trans. Biomed. Eng. , 36
(12), 1146
–1154
(1989). Google Scholar
R. Graaff
,
A. C. M. Dassel
,
M. H. Koelink
,
F. F. M. de Mul
,
J. G. Aarnoudse
, and
W. G. Zijlstra
,
“Optical properties of human dermis in vitro and in vivo,”
Appl. Opt. , 32
(4), 435
–447
(1993). Google Scholar
Y. Du
,
X. H. Hu
,
M. Cariveau
,
X. Ma
,
G. W. Kalmus
, and
J. Q. Lu
,
“Optical properties of porcine skin dermis between 900 nm and 1500 nm,”
Phys. Med. Biol. , 46 167
–181
(2001). Google Scholar
J. M. Schmitt
and
A. Knuttel
,
“Model of optical coherence tomography of heterogeneous tissue,”
J. Opt. Soc. Am. A , 14
(6), 1231
–1242
(1997). Google Scholar
P. Parsa
,
S. L. Jacques
, and
N. S. Nishioka
,
“Optical properties of rat liver between 350 and 2200 nm,”
Appl. Opt. , 28
(12), 2325
–2330
(1989). Google Scholar
J. M. Schmitt
,
A. Knu¨ttel
, and
R. F. Bonner
,
“Measurement of optical properties of biological tissues by low-coherence reflectometry,”
Appl. Opt. , 32
(30), 6032
–6042
(1993). Google Scholar
J. Ritz
,
A. Roggan
,
C. Isbert
,
G. Mu¨ller
,
H. J. Buhr
, and
C. Germer
,
“Optical properties of native and coagulated porcine liver tissue between 400 and 2400 nm,”
Lasers Surg. Med. , 29 205
–212
(2001). Google Scholar
T. L. Troy
and
S. N. Thennadil
,
“Optical properties of human skin in the NIR wavelength range of 1000–2200 nm,”
J. Biomed. Opt. , 6
(2), 167
–176
(2001). Google Scholar
D. J. Maitland
,
J. T. Walsh Jr.,
and
J. B. Prystowsky
,
“Optical properties of human gallbladder tissue and bile,”
Appl. Opt. , 32
(4), 586
–591
(1993). Google Scholar
M. Bashkansky
,
M. D. Duncan
,
L. Goldberg
,
J. P. Koplow
, and
J. Reintjes
,
“Characteristics of a Yb-doped superfluorescent fiber source for use in optical coherence tomography,”
Opt. Express , 3
(8), 305
–310
(1998). Google Scholar
R. Paschotta
,
J. Nilsson
,
A. C. Tropper
, and
D. C. Hanna
,
“Efficient superfluorescent light sources with broad bandwidth,”
IEEE J. Sel. Top. Quantum Electron. , 3
(4), 1097
–1099
(1997). Google Scholar
B. Bouma
,
G. J. Tearney
,
S. A. Boppart
,
M. R. Hee
,
M. E. Brezinski
, and
J. G. Fujimoto
,
“High-resolution optical coherence tomography imaging using a mode-locked
Ti:Al2O3
laser source,”
Opt. Lett. , 20
(13), 1486
–1488
(1995). Google Scholar
R. Leitgeb
,
M. Wojtkowski
,
A. Kowalczyk
,
C. K. Hitzenberger
,
M. Sticker
, and
A. F. Fercher
,
“Spectral measurement of absorption by spectroscopic frequency-domain optical coherence tomography,”
Opt. Lett. , 25
(11), 820
–822
(2000). Google Scholar
B. E. Bouma
,
G. J. Tearney
,
I. P. Bilinsky
,
B. Golubovic
, and
J. G. Fujimoto
,
“Self-phase-modulated Kerr-lens mode-locked Cr:forsterite laser source for optical coherence tomography,”
Opt. Lett. , 21
(22), 1839
–1841
(1996). Google Scholar
C. Chudoba
,
J. G. Fujimoto
,
E. P. Ippen
,
H. A. Haus
,
U. Morgner
,
F. X. Ka¨rtner
,
V. Scheuer
,
G. Angelow
, and
T. Tschudi
,
“All-solid-state Cr:forsterite laser generating 14-fs pulses at 1.3 μm,”
Opt. Lett. , 26
(5), 292
–294
(2001). Google Scholar
A. M. Rollins
,
M. D. Kulkarni
,
S. Yazdanfar
,
R. Ung-arunyawee
, and
J. A. Izatt
,
“In vivo video rate optical coherence tomography,”
Opt. Express , 3
(6), 219
–229
(1998). Google Scholar
|


CITATIONS
Cited by 36 scholarly publications and 1 patent.
Optical coherence tomography
Tissues
Tissue optics
Skin
Gallbladder
Liver
Scattering


